Zip Codes with the Highest Percentage of Population Employed in Health Diagnosing & Treating in Green Valley, AZ
RELATED REPORTS & OPTIONS
Health Diagnosing & Treating
Green Valley
Compare Zip Codes
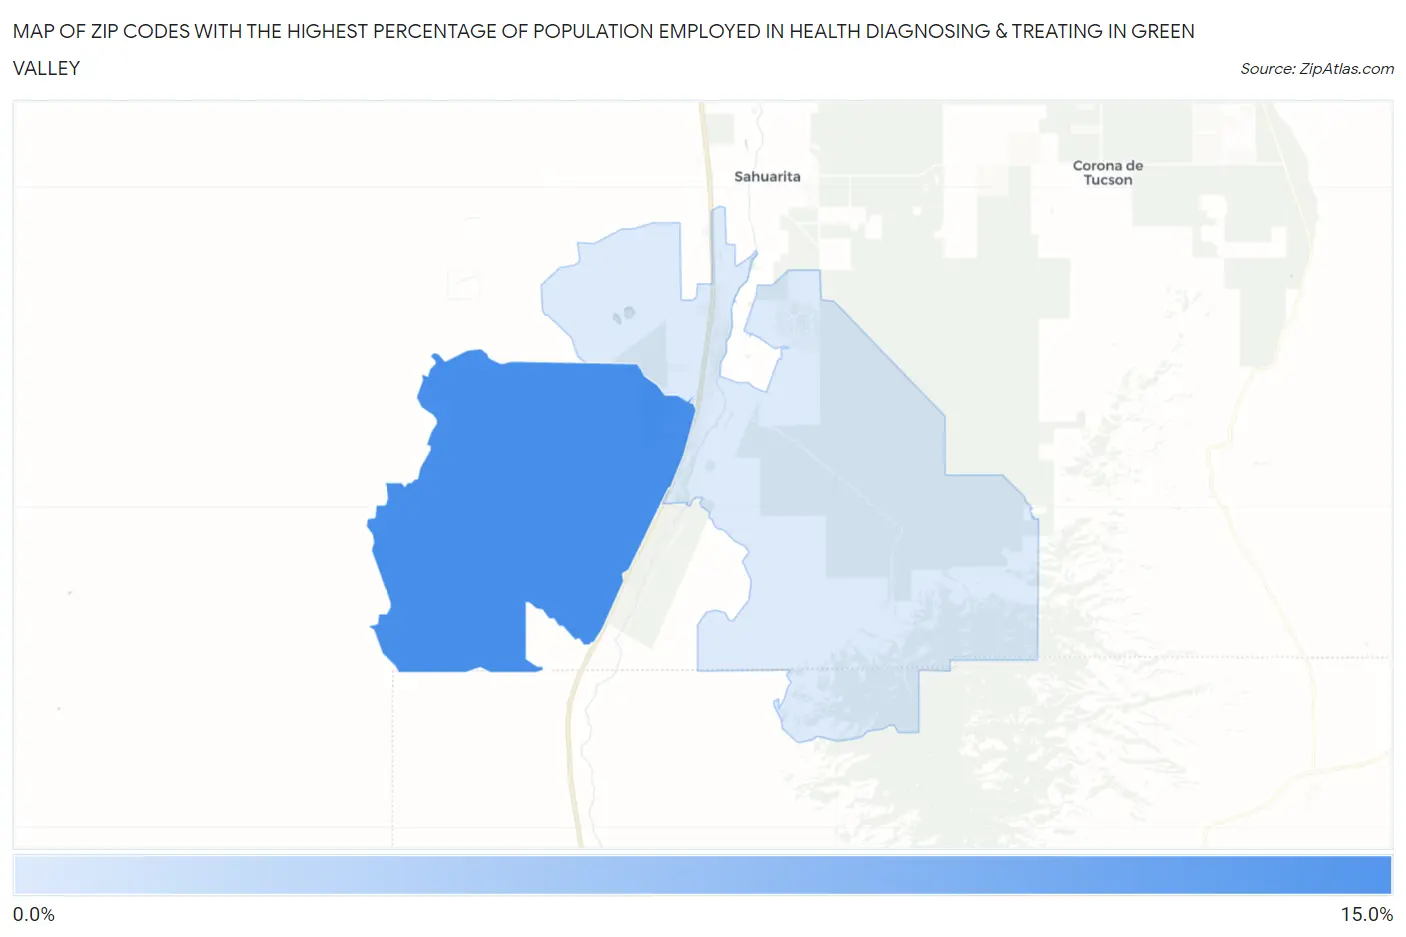
Map of Zip Codes with the Highest Percentage of Population Employed in Health Diagnosing & Treating in Green Valley
0.0%
15.0%
Zip Codes with the Highest Percentage of Population Employed in Health Diagnosing & Treating in Green Valley, AZ
| Zip Code | % Employed | vs State | vs National | |
| 1. | 85622 | 11.9% | 5.9%(+5.97)#23 | 6.2%(+5.61)#2,298 |
| 2. | 85614 | 3.5% | 5.9%(-2.36)#260 | 6.2%(-2.73)#22,870 |
1
Common Questions
What are the Top Zip Codes with the Highest Percentage of Population Employed in Health Diagnosing & Treating in Green Valley, AZ?
Top Zip Codes with the Highest Percentage of Population Employed in Health Diagnosing & Treating in Green Valley, AZ are:
What zip code has the Highest Percentage of Population Employed in Health Diagnosing & Treating in Green Valley, AZ?
85622 has the Highest Percentage of Population Employed in Health Diagnosing & Treating in Green Valley, AZ with 11.9%.
What is the Percentage of Population Employed in Health Diagnosing & Treating in Green Valley, AZ?
Percentage of Population Employed in Health Diagnosing & Treating in Green Valley is 6.4%.
What is the Percentage of Population Employed in Health Diagnosing & Treating in Arizona?
Percentage of Population Employed in Health Diagnosing & Treating in Arizona is 5.9%.
What is the Percentage of Population Employed in Health Diagnosing & Treating in the United States?
Percentage of Population Employed in Health Diagnosing & Treating in the United States is 6.2%.