Zip Codes with the Highest Costs of Housing as Percentage of Income in Green Valley, AZ
RELATED REPORTS & OPTIONS
Highest Housing Costs / Income
Green Valley
Compare Zip Codes
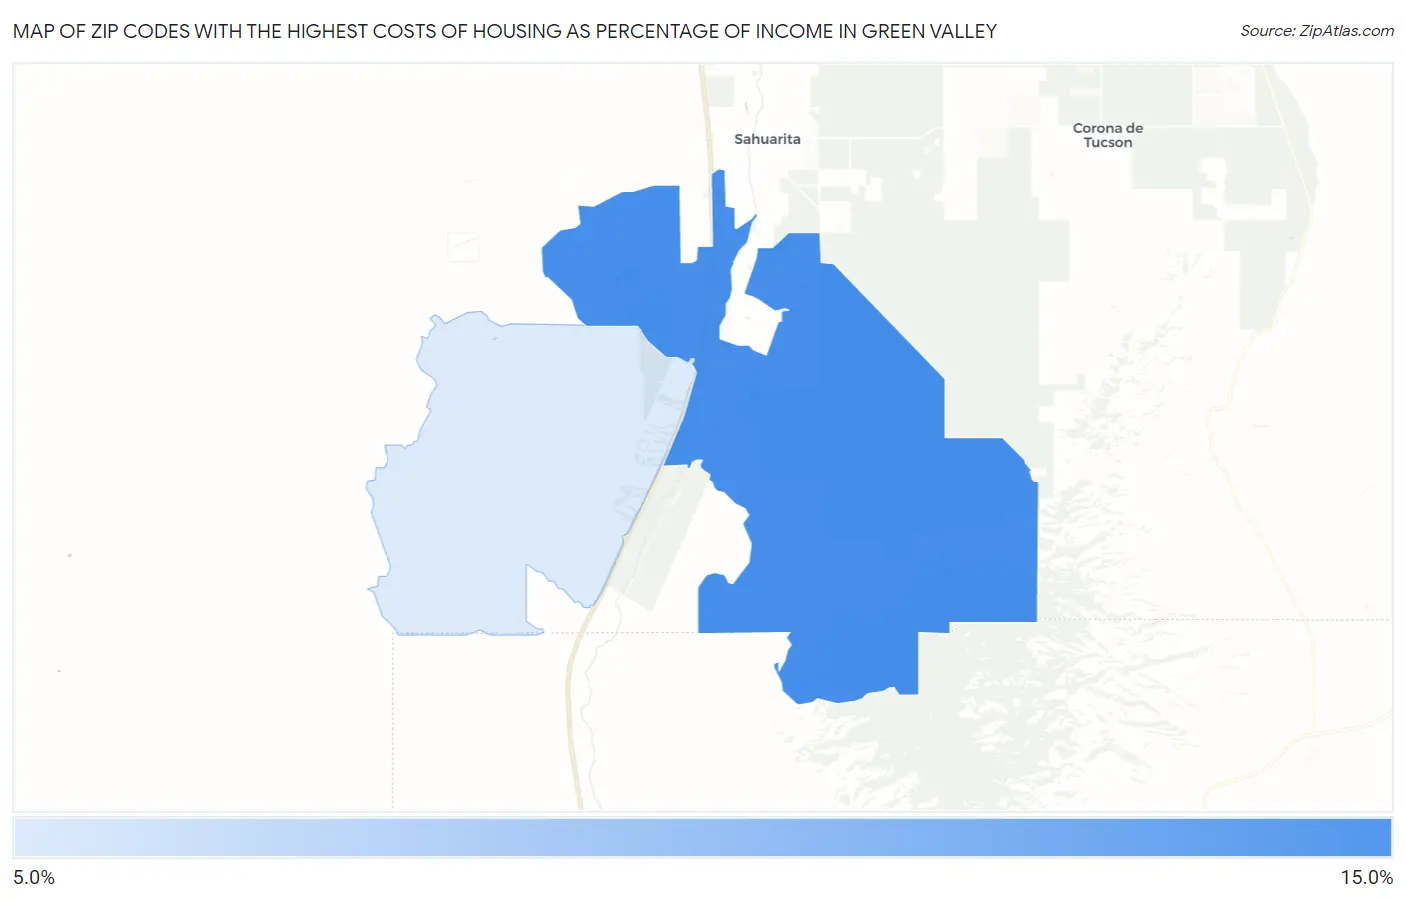
Map of Zip Codes with the Highest Costs of Housing as Percentage of Income in Green Valley
0.0%
15.0%
Zip Codes with the Highest Costs of Housing as Percentage of Income in Green Valley, AZ
| Zip Code | Housing Costs / Income | vs State | vs National | |
| 1. | 85614 | 14.9% | 20.7%(-5.79)#264 | 20.4%(-5.48)#21,152 |
| 2. | 85622 | 10.2% | 20.7%(-10.5)#336 | 20.4%(-10.2)#28,453 |
1
Common Questions
What are the Top Zip Codes with the Highest Costs of Housing as Percentage of Income in Green Valley, AZ?
Top Zip Codes with the Highest Costs of Housing as Percentage of Income in Green Valley, AZ are:
What zip code has the Highest Costs of Housing as Percentage of Income in Green Valley, AZ?
85614 has the Highest Costs of Housing as Percentage of Income in Green Valley, AZ with 14.9%.
What is the Average Housing Costs as Percentage of Income in Green Valley, AZ?
Average Housing Costs as Percentage of Income in Green Valley is 13.1%.
What is the Average Housing Costs as Percentage of Income in Arizona?
Average Housing Costs as Percentage of Income in Arizona is 20.7%.
What is the Average Housing Costs as Percentage of Income in the United States?
Average Housing Costs as Percentage of Income in the United States is 20.4%.