Zip Codes with the Highest Percentage of Population Employed in Food Preparation & Serving in Sedona, AZ
RELATED REPORTS & OPTIONS
Food Preparation & Serving
Sedona
Compare Zip Codes
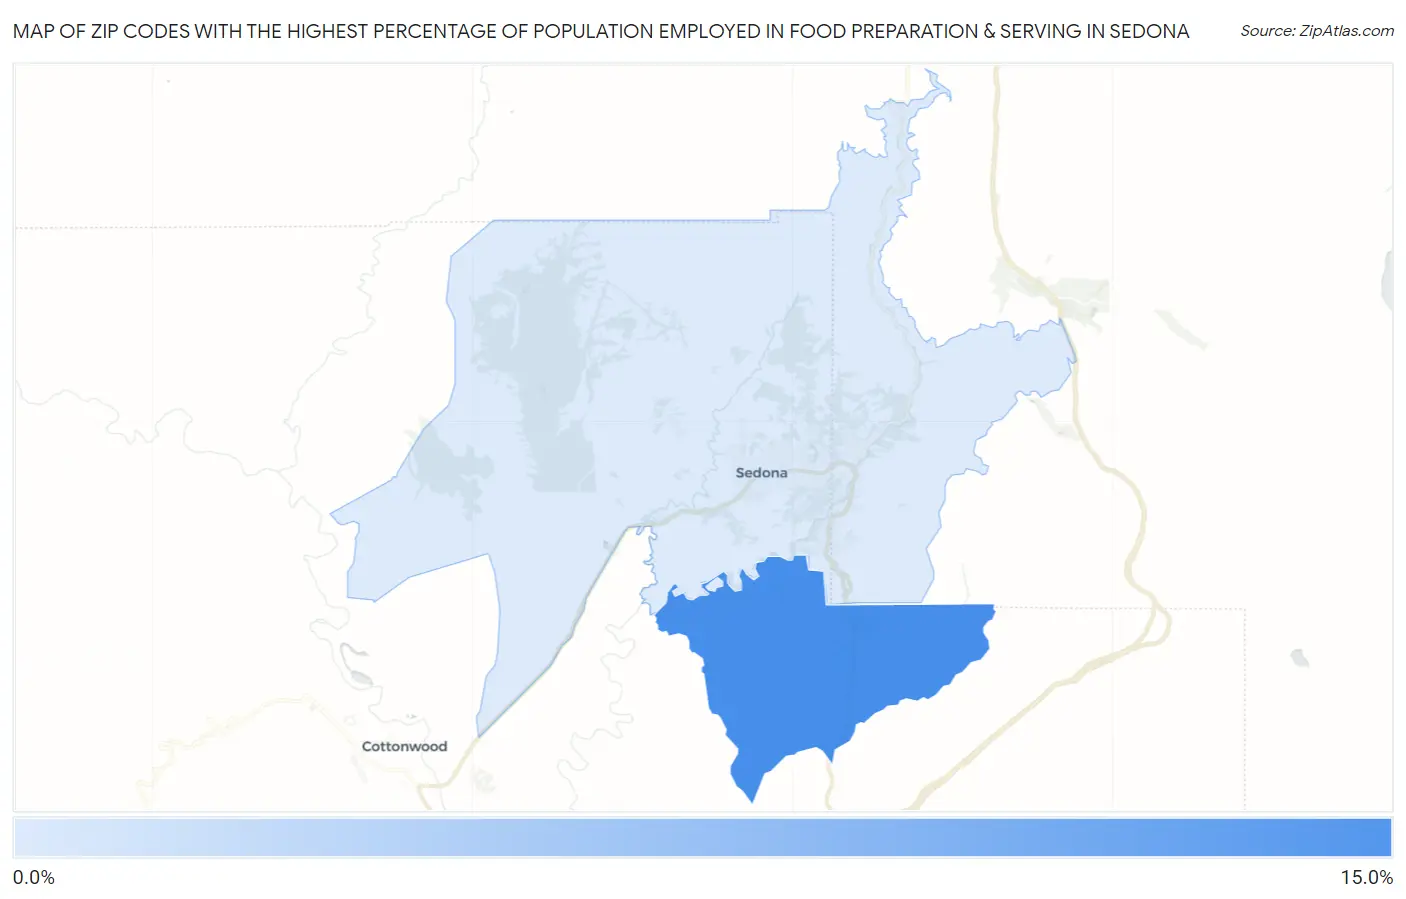
Map of Zip Codes with the Highest Percentage of Population Employed in Food Preparation & Serving in Sedona
0.0%
15.0%
Zip Codes with the Highest Percentage of Population Employed in Food Preparation & Serving in Sedona, AZ
| Zip Code | % Employed | vs State | vs National | |
| 1. | 86351 | 10.8% | 5.7%(+5.18)#39 | 5.3%(+5.56)#2,138 |
| 2. | 86336 | 3.8% | 5.7%(-1.86)#254 | 5.3%(-1.48)#17,919 |
1
Common Questions
What are the Top Zip Codes with the Highest Percentage of Population Employed in Food Preparation & Serving in Sedona, AZ?
Top Zip Codes with the Highest Percentage of Population Employed in Food Preparation & Serving in Sedona, AZ are:
What zip code has the Highest Percentage of Population Employed in Food Preparation & Serving in Sedona, AZ?
86351 has the Highest Percentage of Population Employed in Food Preparation & Serving in Sedona, AZ with 10.8%.
What is the Percentage of Population Employed in Food Preparation & Serving in Sedona, AZ?
Percentage of Population Employed in Food Preparation & Serving in Sedona is 3.5%.
What is the Percentage of Population Employed in Food Preparation & Serving in Arizona?
Percentage of Population Employed in Food Preparation & Serving in Arizona is 5.7%.
What is the Percentage of Population Employed in Food Preparation & Serving in the United States?
Percentage of Population Employed in Food Preparation & Serving in the United States is 5.3%.