Zip Codes with the Highest Percentage of Population Employed in Food Preparation & Serving in Glendale, AZ
RELATED REPORTS & OPTIONS
Food Preparation & Serving
Glendale
Compare Zip Codes
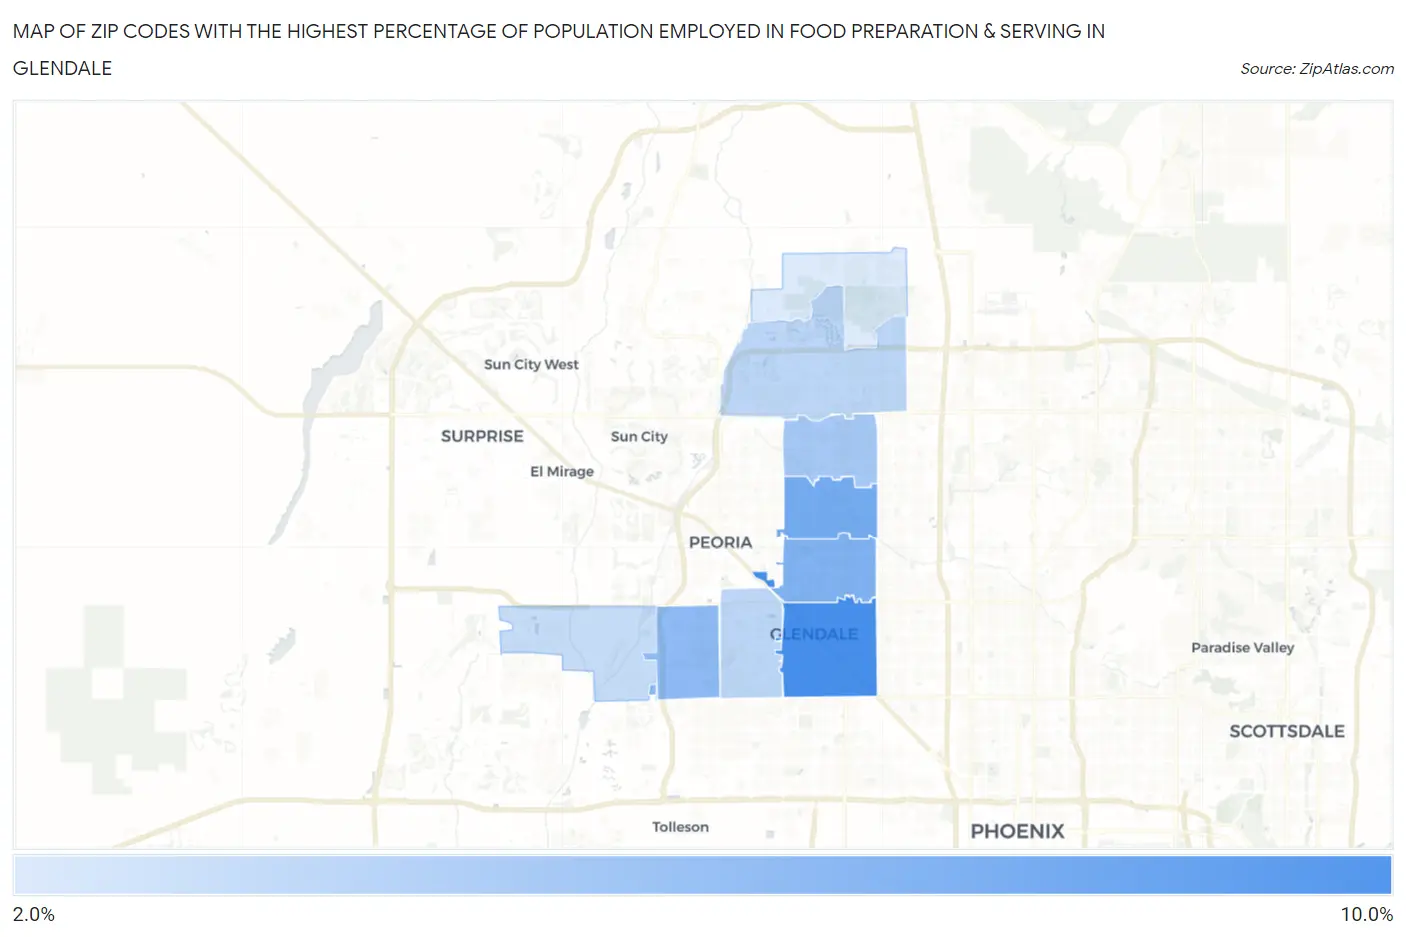
Map of Zip Codes with the Highest Percentage of Population Employed in Food Preparation & Serving in Glendale
0.0%
10.0%
Zip Codes with the Highest Percentage of Population Employed in Food Preparation & Serving in Glendale, AZ
| Zip Code | % Employed | vs State | vs National | |
| 1. | 85301 | 8.4% | 5.7%(+2.71)#76 | 5.3%(+3.09)#4,205 |
| 2. | 85304 | 6.6% | 5.7%(+0.970)#117 | 5.3%(+1.35)#7,517 |
| 3. | 85302 | 6.3% | 5.7%(+0.585)#139 | 5.3%(+0.966)#8,570 |
| 4. | 85305 | 5.7% | 5.7%(+0.036)#170 | 5.3%(+0.417)#10,330 |
| 5. | 85306 | 4.9% | 5.7%(-0.731)#197 | 5.3%(-0.350)#13,199 |
| 6. | 85303 | 4.0% | 5.7%(-1.62)#245 | 5.3%(-1.24)#16,940 |
| 7. | 85308 | 4.0% | 5.7%(-1.63)#248 | 5.3%(-1.25)#16,987 |
| 8. | 85307 | 3.7% | 5.7%(-1.96)#257 | 5.3%(-1.58)#18,311 |
| 9. | 85310 | 2.9% | 5.7%(-2.75)#299 | 5.3%(-2.37)#21,582 |
1
Common Questions
What are the Top 5 Zip Codes with the Highest Percentage of Population Employed in Food Preparation & Serving in Glendale, AZ?
Top 5 Zip Codes with the Highest Percentage of Population Employed in Food Preparation & Serving in Glendale, AZ are:
What zip code has the Highest Percentage of Population Employed in Food Preparation & Serving in Glendale, AZ?
85301 has the Highest Percentage of Population Employed in Food Preparation & Serving in Glendale, AZ with 8.4%.
What is the Percentage of Population Employed in Food Preparation & Serving in Glendale, AZ?
Percentage of Population Employed in Food Preparation & Serving in Glendale is 6.0%.
What is the Percentage of Population Employed in Food Preparation & Serving in Arizona?
Percentage of Population Employed in Food Preparation & Serving in Arizona is 5.7%.
What is the Percentage of Population Employed in Food Preparation & Serving in the United States?
Percentage of Population Employed in Food Preparation & Serving in the United States is 5.3%.