Zip Codes with the Highest Percentage of Population Employed in Food Preparation & Serving in Apache Junction, AZ
RELATED REPORTS & OPTIONS
Food Preparation & Serving
Apache Junction
Compare Zip Codes
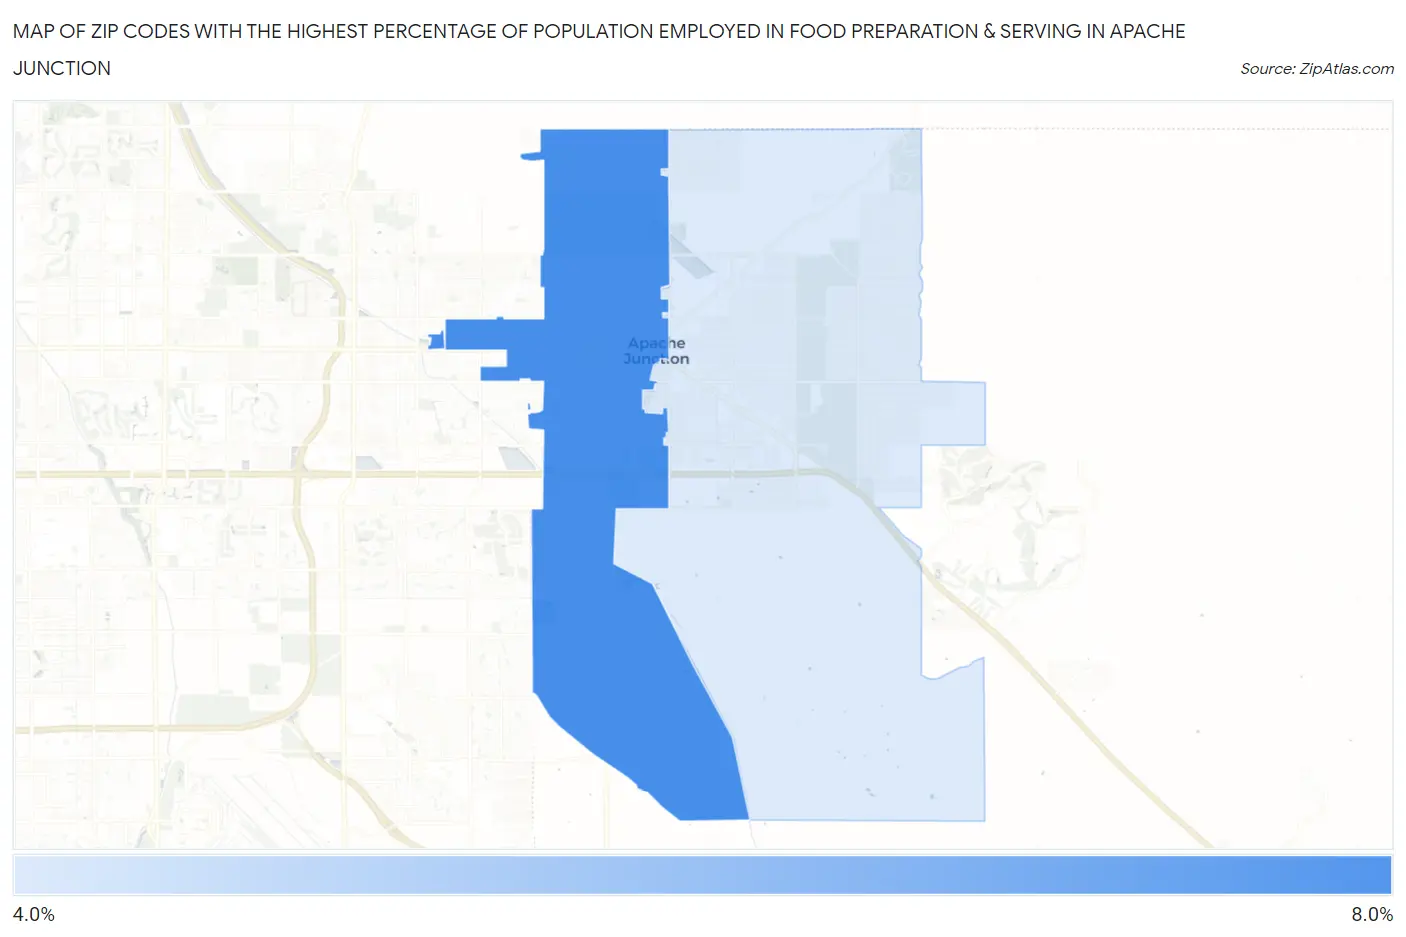
Map of Zip Codes with the Highest Percentage of Population Employed in Food Preparation & Serving in Apache Junction
0.0%
8.0%
Zip Codes with the Highest Percentage of Population Employed in Food Preparation & Serving in Apache Junction, AZ
| Zip Code | % Employed | vs State | vs National | |
| 1. | 85120 | 7.1% | 5.7%(+1.45)#97 | 5.3%(+1.83)#6,306 |
| 2. | 85119 | 4.7% | 5.7%(-0.993)#213 | 5.3%(-0.611)#14,267 |
1
Common Questions
What are the Top Zip Codes with the Highest Percentage of Population Employed in Food Preparation & Serving in Apache Junction, AZ?
Top Zip Codes with the Highest Percentage of Population Employed in Food Preparation & Serving in Apache Junction, AZ are:
What zip code has the Highest Percentage of Population Employed in Food Preparation & Serving in Apache Junction, AZ?
85120 has the Highest Percentage of Population Employed in Food Preparation & Serving in Apache Junction, AZ with 7.1%.
What is the Percentage of Population Employed in Food Preparation & Serving in Apache Junction, AZ?
Percentage of Population Employed in Food Preparation & Serving in Apache Junction is 4.9%.
What is the Percentage of Population Employed in Food Preparation & Serving in Arizona?
Percentage of Population Employed in Food Preparation & Serving in Arizona is 5.7%.
What is the Percentage of Population Employed in Food Preparation & Serving in the United States?
Percentage of Population Employed in Food Preparation & Serving in the United States is 5.3%.