Kodiak, AK Map & Demographics
Kodiak Map
Kodiak Overview
$36,227
PER CAPITA INCOME
$95,739
AVG FAMILY INCOME
$76,765
AVG HOUSEHOLD INCOME
23.4%
WAGE / INCOME GAP [ % ]
76.6¢/ $1
WAGE / INCOME GAP [ $ ]
$7,007
FAMILY INCOME DEFICIT
0.44
INEQUALITY / GINI INDEX
5,584
TOTAL POPULATION
2,976
MALE POPULATION
2,608
FEMALE POPULATION
114.11
MALES / 100 FEMALES
87.63
FEMALES / 100 MALES
41.1
MEDIAN AGE
3.9
AVG FAMILY SIZE
3.1
AVG HOUSEHOLD SIZE
3,221
LABOR FORCE [ PEOPLE ]
69.4%
PERCENT IN LABOR FORCE
4.8%
UNEMPLOYMENT RATE
Kodiak Zip Codes
Kodiak Area Codes
Income in Kodiak
Income Overview in Kodiak
Per Capita Income in Kodiak is $36,227, while median incomes of families and households are $95,739 and $76,765 respectively.
| Characteristic | Number | Measure |
| Per Capita Income | 5,584 | $36,227 |
| Median Family Income | 1,125 | $95,739 |
| Mean Family Income | 1,125 | $102,073 |
| Median Household Income | 1,768 | $76,765 |
| Mean Household Income | 1,768 | $103,879 |
| Income Deficit | 1,125 | $7,007 |
| Wage / Income Gap (%) | 5,584 | 23.44% |
| Wage / Income Gap ($) | 5,584 | 76.56¢ per $1 |
| Gini / Inequality Index | 5,584 | 0.44 |
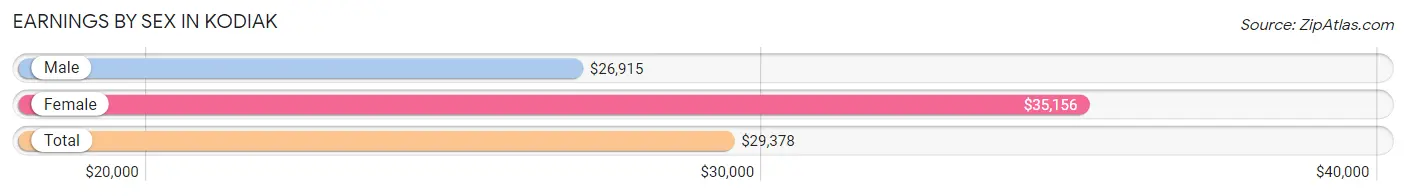
Earnings by Sex in Kodiak
Average Earnings in Kodiak are $29,378, $26,915 for men and $35,156 for women, a difference of 23.4%.
| Sex | Number | Average Earnings |
| Male | 1,866 (55.7%) | $26,915 |
| Female | 1,484 (44.3%) | $35,156 |
| Total | 3,350 (100.0%) | $29,378 |
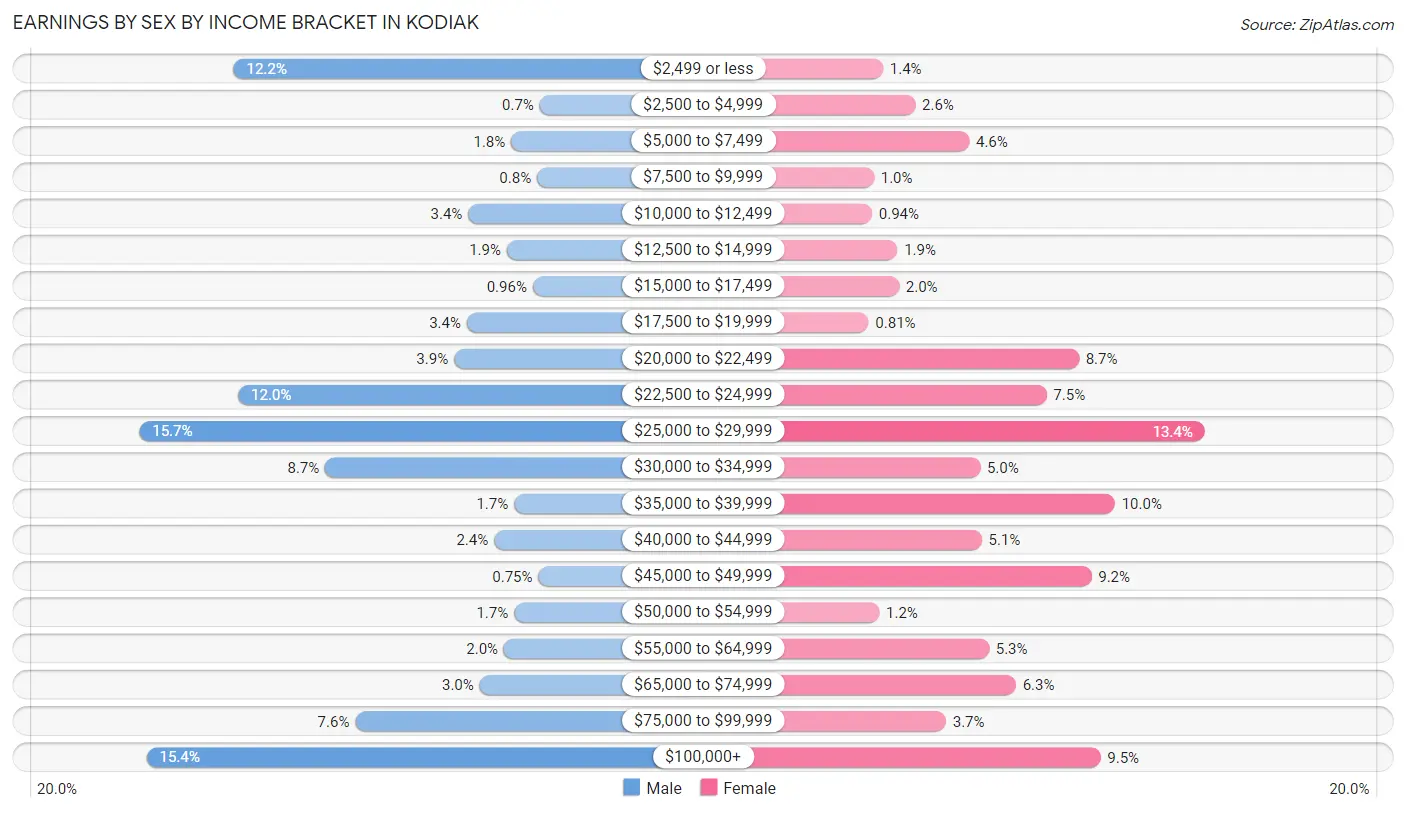
Earnings by Sex by Income Bracket in Kodiak
The most common earnings brackets in Kodiak are $25,000 to $29,999 for men (293 | 15.7%) and $25,000 to $29,999 for women (199 | 13.4%).
| Income | Male | Female |
| $2,499 or less | 227 (12.2%) | 20 (1.3%) |
| $2,500 to $4,999 | 13 (0.7%) | 38 (2.6%) |
| $5,000 to $7,499 | 33 (1.8%) | 68 (4.6%) |
| $7,500 to $9,999 | 15 (0.8%) | 15 (1.0%) |
| $10,000 to $12,499 | 63 (3.4%) | 14 (0.9%) |
| $12,500 to $14,999 | 36 (1.9%) | 28 (1.9%) |
| $15,000 to $17,499 | 18 (1.0%) | 29 (1.9%) |
| $17,500 to $19,999 | 64 (3.4%) | 12 (0.8%) |
| $20,000 to $22,499 | 73 (3.9%) | 129 (8.7%) |
| $22,500 to $24,999 | 224 (12.0%) | 111 (7.5%) |
| $25,000 to $29,999 | 293 (15.7%) | 199 (13.4%) |
| $30,000 to $34,999 | 163 (8.7%) | 74 (5.0%) |
| $35,000 to $39,999 | 31 (1.7%) | 149 (10.0%) |
| $40,000 to $44,999 | 45 (2.4%) | 75 (5.1%) |
| $45,000 to $49,999 | 14 (0.7%) | 136 (9.2%) |
| $50,000 to $54,999 | 31 (1.7%) | 18 (1.2%) |
| $55,000 to $64,999 | 38 (2.0%) | 79 (5.3%) |
| $65,000 to $74,999 | 55 (2.9%) | 94 (6.3%) |
| $75,000 to $99,999 | 142 (7.6%) | 55 (3.7%) |
| $100,000+ | 288 (15.4%) | 141 (9.5%) |
| Total | 1,866 (100.0%) | 1,484 (100.0%) |
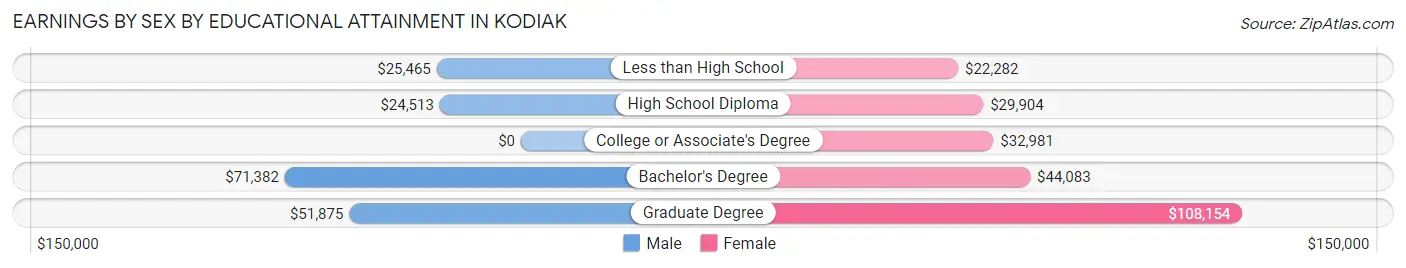
Earnings by Sex by Educational Attainment in Kodiak
Average earnings in Kodiak are $27,157 for men and $35,797 for women, a difference of 24.1%. Men with an educational attainment of bachelor's degree enjoy the highest average annual earnings of $71,382, while those with high school diploma education earn the least with $24,513. Women with an educational attainment of graduate degree earn the most with the average annual earnings of $108,154, while those with less than high school education have the smallest earnings of $22,282.
| Educational Attainment | Male Income | Female Income |
| Less than High School | $25,465 | $22,282 |
| High School Diploma | $24,513 | $29,904 |
| College or Associate's Degree | - | - |
| Bachelor's Degree | $71,382 | $44,083 |
| Graduate Degree | $51,875 | $108,154 |
| Total | $27,157 | $35,797 |
Family Income in Kodiak
Family Income Brackets in Kodiak
According to the Kodiak family income data, there are 392 families falling into the $100,000 to $149,999 income range, which is the most common income bracket and makes up 34.8% of all families. Conversely, the $10,000 to $14,999 income bracket is the least frequent group with only 9 families (0.8%) belonging to this category.
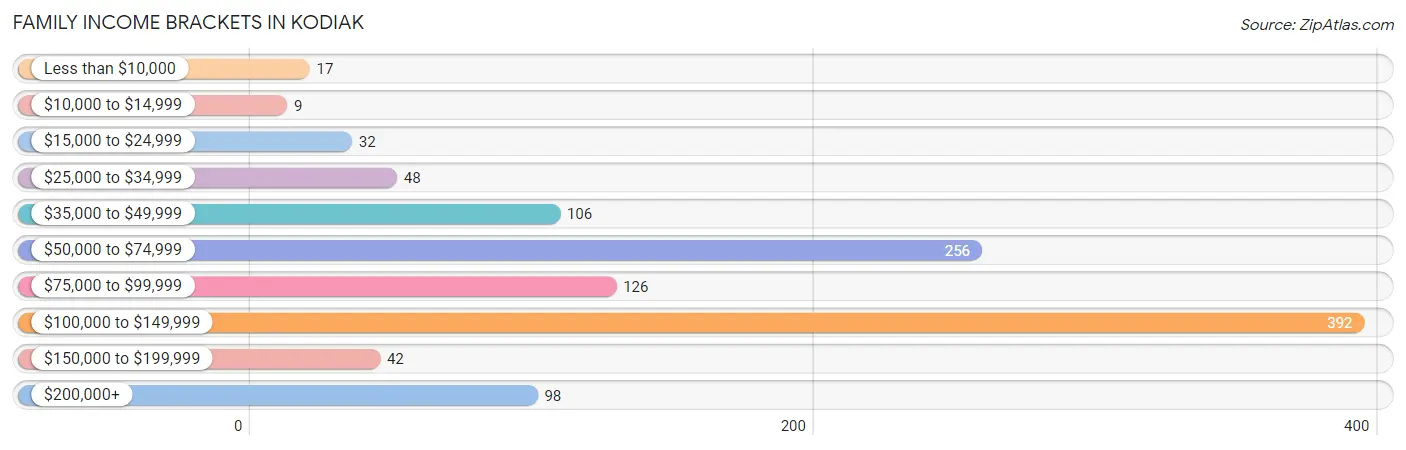
| Income Bracket | # Families | % Families |
| Less than $10,000 | 17 | 1.5% |
| $10,000 to $14,999 | 9 | 0.8% |
| $15,000 to $24,999 | 32 | 2.8% |
| $25,000 to $34,999 | 48 | 4.3% |
| $35,000 to $49,999 | 106 | 9.4% |
| $50,000 to $74,999 | 256 | 22.8% |
| $75,000 to $99,999 | 126 | 11.2% |
| $100,000 to $149,999 | 392 | 34.8% |
| $150,000 to $199,999 | 42 | 3.7% |
| $200,000+ | 98 | 8.7% |
Family Income by Famaliy Size in Kodiak
6-person families (82 | 7.3%) account for the highest median family income in Kodiak with $118,640 per family, while 3-person families (270 | 24.0%) have the highest median income of $36,319 per family member.
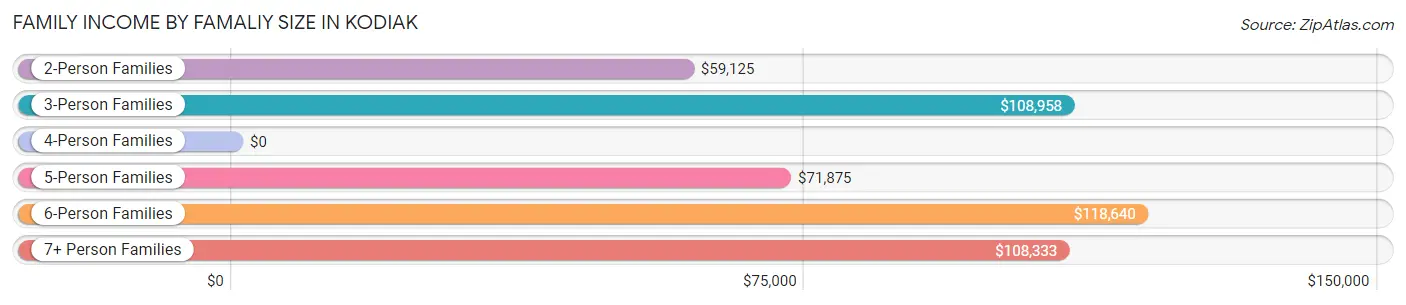
| Income Bracket | # Families | Median Income |
| 2-Person Families | 313 (27.8%) | $59,125 |
| 3-Person Families | 270 (24.0%) | $108,958 |
| 4-Person Families | 224 (19.9%) | $0 |
| 5-Person Families | 190 (16.9%) | $71,875 |
| 6-Person Families | 82 (7.3%) | $118,640 |
| 7+ Person Families | 46 (4.1%) | $108,333 |
| Total | 1,125 (100.0%) | $95,739 |
Family Income by Number of Earners in Kodiak
The median family income in Kodiak is $95,739, with families comprising 3+ earners (307) having the highest median family income of $119,364, while families with 1 earner (212) have the lowest median family income of $48,750, accounting for 27.3% and 18.8% of families, respectively.
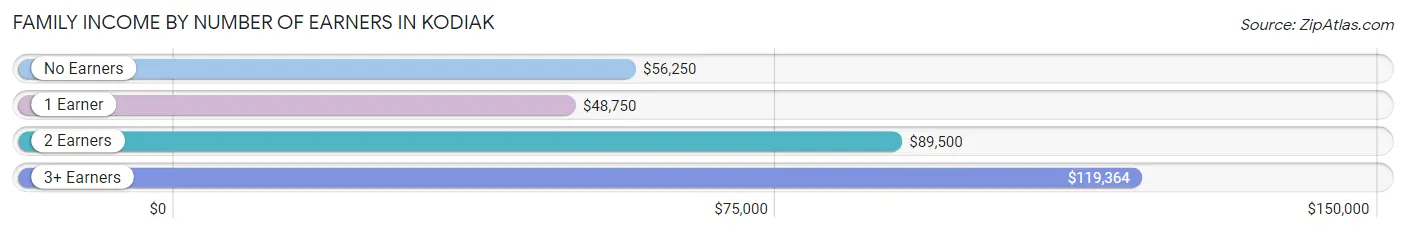
| Number of Earners | # Families | Median Income |
| No Earners | 92 (8.2%) | $56,250 |
| 1 Earner | 212 (18.8%) | $48,750 |
| 2 Earners | 514 (45.7%) | $89,500 |
| 3+ Earners | 307 (27.3%) | $119,364 |
| Total | 1,125 (100.0%) | $95,739 |
Household Income in Kodiak
Household Income Brackets in Kodiak
With 529 households falling in the category, the $100,000 to $149,999 income range is the most frequent in Kodiak, accounting for 29.9% of all households. In contrast, only 28 households (1.6%) fall into the $10,000 to $14,999 income bracket, making it the least populous group.
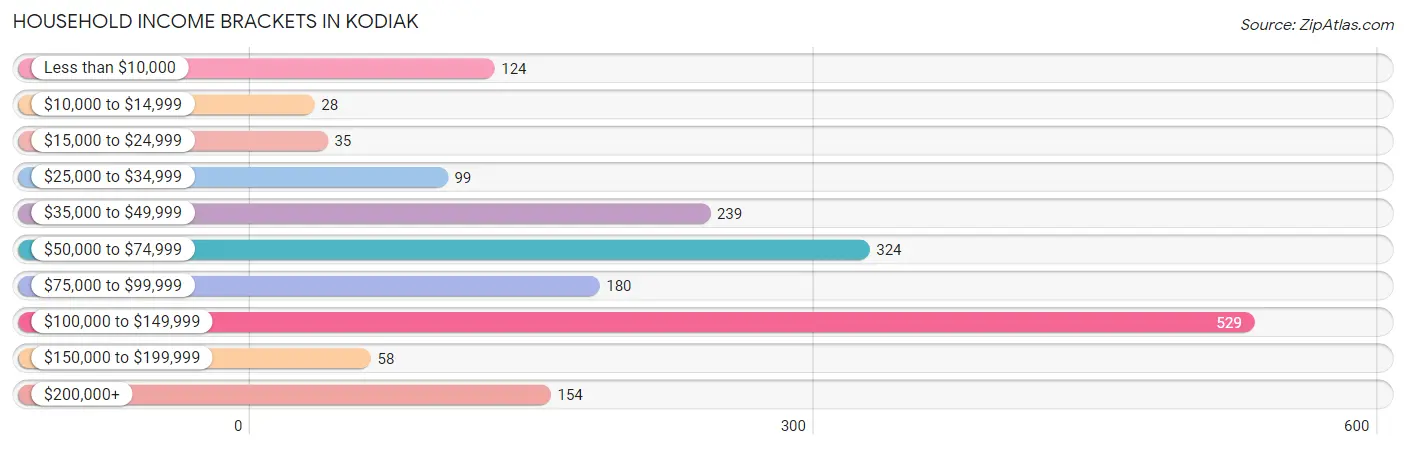
| Income Bracket | # Households | % Households |
| Less than $10,000 | 124 | 7.0% |
| $10,000 to $14,999 | 28 | 1.6% |
| $15,000 to $24,999 | 35 | 2.0% |
| $25,000 to $34,999 | 99 | 5.6% |
| $35,000 to $49,999 | 239 | 13.5% |
| $50,000 to $74,999 | 324 | 18.3% |
| $75,000 to $99,999 | 180 | 10.2% |
| $100,000 to $149,999 | 529 | 29.9% |
| $150,000 to $199,999 | 58 | 3.3% |
| $200,000+ | 154 | 8.7% |
Household Income by Householder Age in Kodiak
The median household income in Kodiak is $76,765, with the highest median household income of $95,847 found in the 45 to 64 years age bracket for the primary householder. A total of 659 households (37.3%) fall into this category. Meanwhile, the 15 to 24 years age bracket for the primary householder has the lowest median household income of $0, with 197 households (11.1%) in this group.
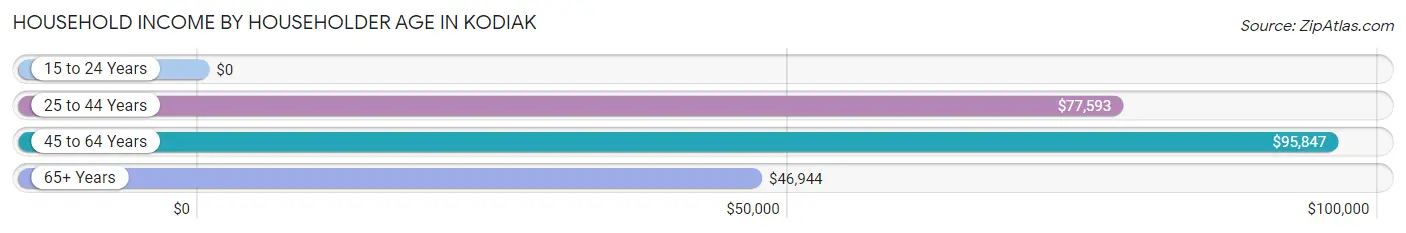
| Income Bracket | # Households | Median Income |
| 15 to 24 Years | 197 (11.1%) | $0 |
| 25 to 44 Years | 638 (36.1%) | $77,593 |
| 45 to 64 Years | 659 (37.3%) | $95,847 |
| 65+ Years | 274 (15.5%) | $46,944 |
| Total | 1,768 (100.0%) | $76,765 |
Poverty in Kodiak
Income Below Poverty by Sex and Age in Kodiak
With 6.7% poverty level for males and 11.6% for females among the residents of Kodiak, 15 year old males and 25 to 34 year old females are the most vulnerable to poverty, with 15 males (48.4%) and 69 females (27.8%) in their respective age groups living below the poverty level.
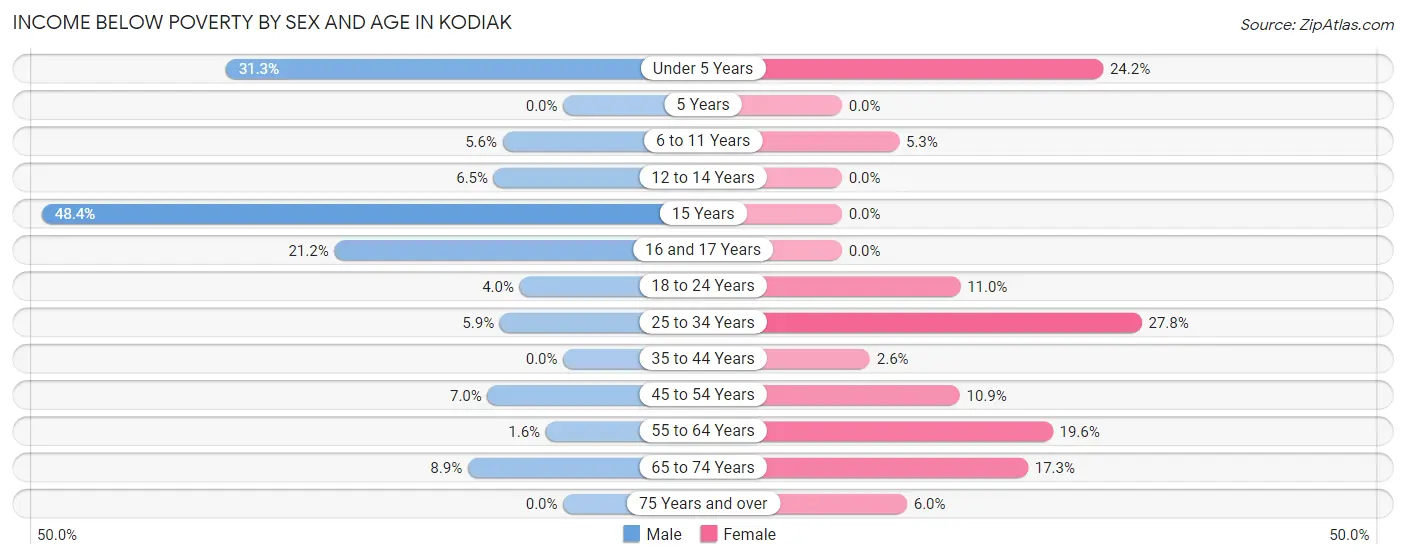
| Age Bracket | Male | Female |
| Under 5 Years | 47 (31.3%) | 24 (24.2%) |
| 5 Years | 0 (0.0%) | 0 (0.0%) |
| 6 to 11 Years | 14 (5.6%) | 6 (5.3%) |
| 12 to 14 Years | 4 (6.5%) | 0 (0.0%) |
| 15 Years | 15 (48.4%) | 0 (0.0%) |
| 16 and 17 Years | 24 (21.2%) | 0 (0.0%) |
| 18 to 24 Years | 16 (4.0%) | 31 (11.0%) |
| 25 to 34 Years | 15 (5.9%) | 69 (27.8%) |
| 35 to 44 Years | 0 (0.0%) | 12 (2.6%) |
| 45 to 54 Years | 23 (7.0%) | 41 (10.9%) |
| 55 to 64 Years | 9 (1.6%) | 62 (19.6%) |
| 65 to 74 Years | 30 (8.8%) | 39 (17.3%) |
| 75 Years and over | 0 (0.0%) | 14 (6.0%) |
| Total | 197 (6.7%) | 298 (11.6%) |
Income Above Poverty by Sex and Age in Kodiak
According to the poverty statistics in Kodiak, males aged 5 years and females aged 5 years are the age groups that are most secure financially, with 100.0% of males and 100.0% of females in these age groups living above the poverty line.
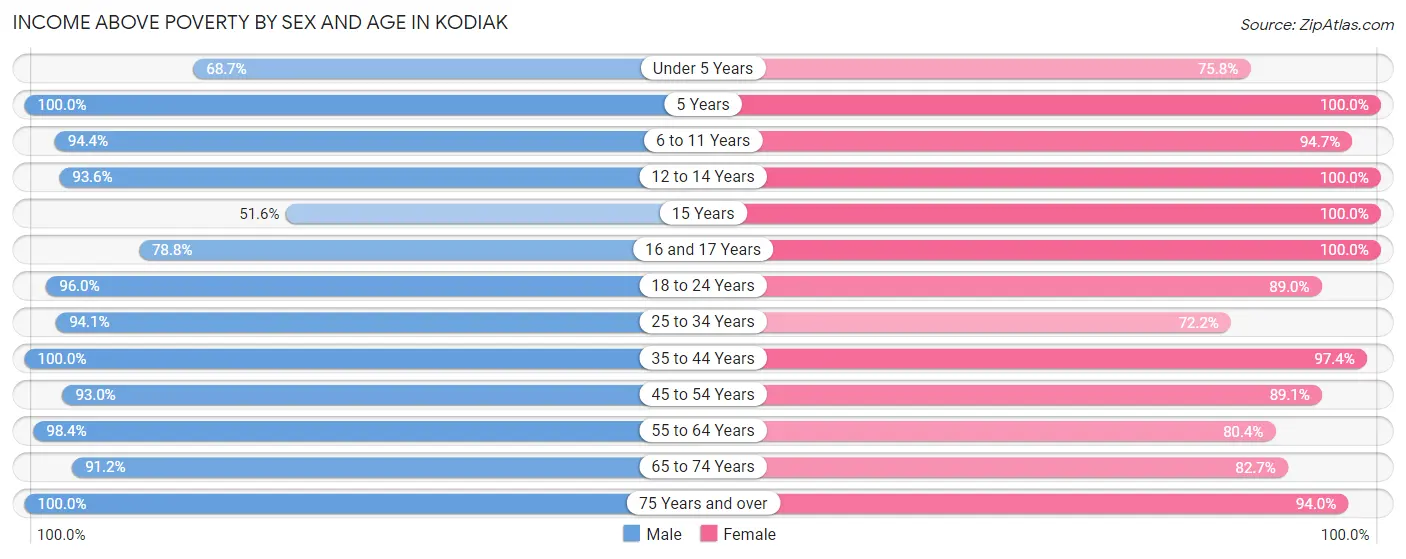
| Age Bracket | Male | Female |
| Under 5 Years | 103 (68.7%) | 75 (75.8%) |
| 5 Years | 25 (100.0%) | 91 (100.0%) |
| 6 to 11 Years | 235 (94.4%) | 107 (94.7%) |
| 12 to 14 Years | 58 (93.5%) | 51 (100.0%) |
| 15 Years | 16 (51.6%) | 72 (100.0%) |
| 16 and 17 Years | 89 (78.8%) | 13 (100.0%) |
| 18 to 24 Years | 380 (96.0%) | 251 (89.0%) |
| 25 to 34 Years | 240 (94.1%) | 179 (72.2%) |
| 35 to 44 Years | 357 (100.0%) | 450 (97.4%) |
| 45 to 54 Years | 304 (93.0%) | 334 (89.1%) |
| 55 to 64 Years | 547 (98.4%) | 255 (80.4%) |
| 65 to 74 Years | 309 (91.1%) | 187 (82.7%) |
| 75 Years and over | 76 (100.0%) | 218 (94.0%) |
| Total | 2,739 (93.3%) | 2,283 (88.4%) |
Income Below Poverty Among Married-Couple Families in Kodiak
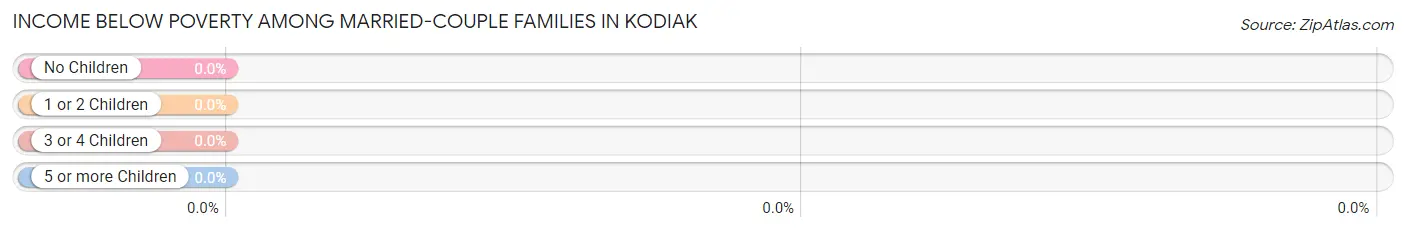
| Children | Above Poverty | Below Poverty |
| No Children | 428 (100.0%) | 0 (0.0%) |
| 1 or 2 Children | 378 (100.0%) | 0 (0.0%) |
| 3 or 4 Children | 60 (100.0%) | 0 (0.0%) |
| 5 or more Children | 9 (100.0%) | 0 (0.0%) |
| Total | 875 (100.0%) | 0 (0.0%) |
Income Below Poverty Among Single-Parent Households in Kodiak
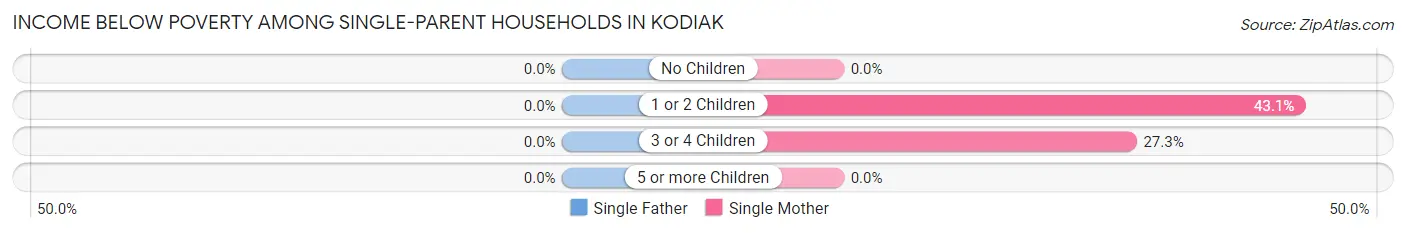
| Children | Single Father | Single Mother |
| No Children | 0 (0.0%) | 0 (0.0%) |
| 1 or 2 Children | 0 (0.0%) | 59 (43.1%) |
| 3 or 4 Children | 0 (0.0%) | 12 (27.3%) |
| 5 or more Children | 0 (0.0%) | 0 (0.0%) |
| Total | 0 (0.0%) | 71 (30.5%) |
Income Below Poverty Among Married-Couple vs Single-Parent Households in Kodiak
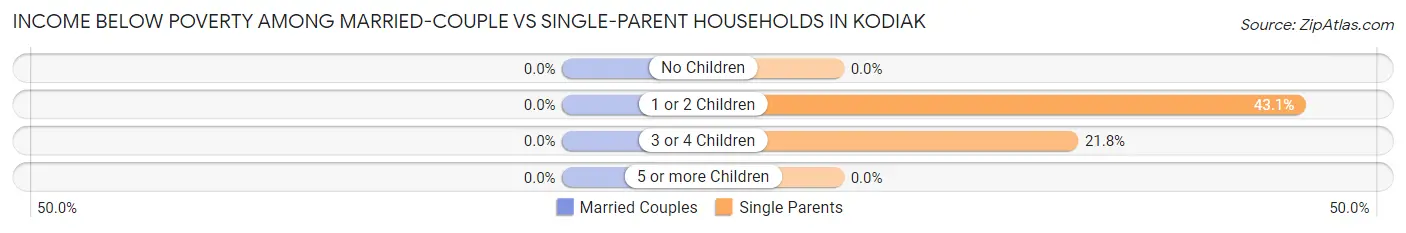
| Children | Married-Couple Families | Single-Parent Households |
| No Children | 0 (0.0%) | 0 (0.0%) |
| 1 or 2 Children | 0 (0.0%) | 59 (43.1%) |
| 3 or 4 Children | 0 (0.0%) | 12 (21.8%) |
| 5 or more Children | 0 (0.0%) | 0 (0.0%) |
| Total | 0 (0.0%) | 71 (28.4%) |
Race in Kodiak
The most populous races in Kodiak are Asian (2,677 | 47.9%), White / Caucasian (2,147 | 38.5%), and Hispanic or Latino (494 | 8.8%).
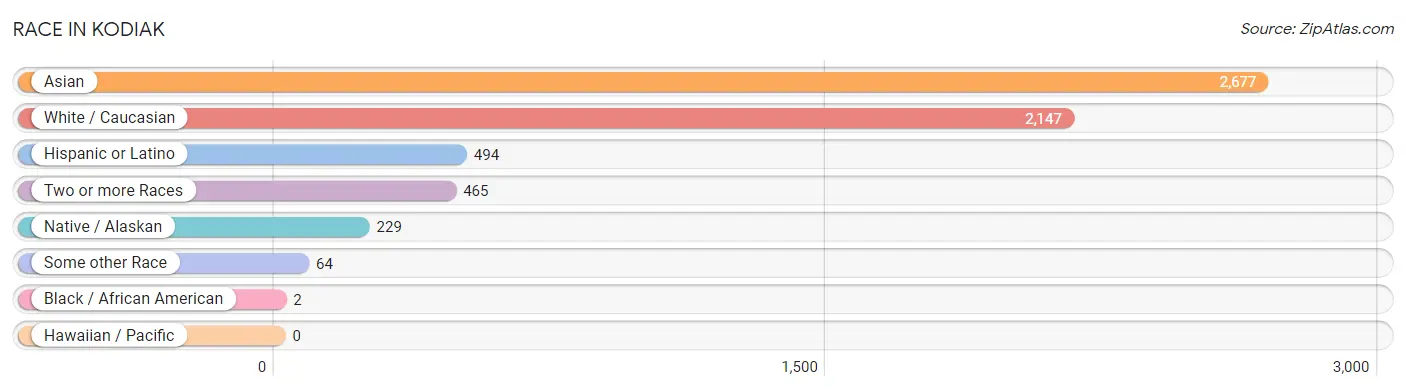
| Race | # Population | % Population |
| Asian | 2,677 | 47.9% |
| Black / African American | 2 | 0.0% |
| Hawaiian / Pacific | 0 | 0.0% |
| Hispanic or Latino | 494 | 8.8% |
| Native / Alaskan | 229 | 4.1% |
| White / Caucasian | 2,147 | 38.5% |
| Two or more Races | 465 | 8.3% |
| Some other Race | 64 | 1.1% |
| Total | 5,584 | 100.0% |
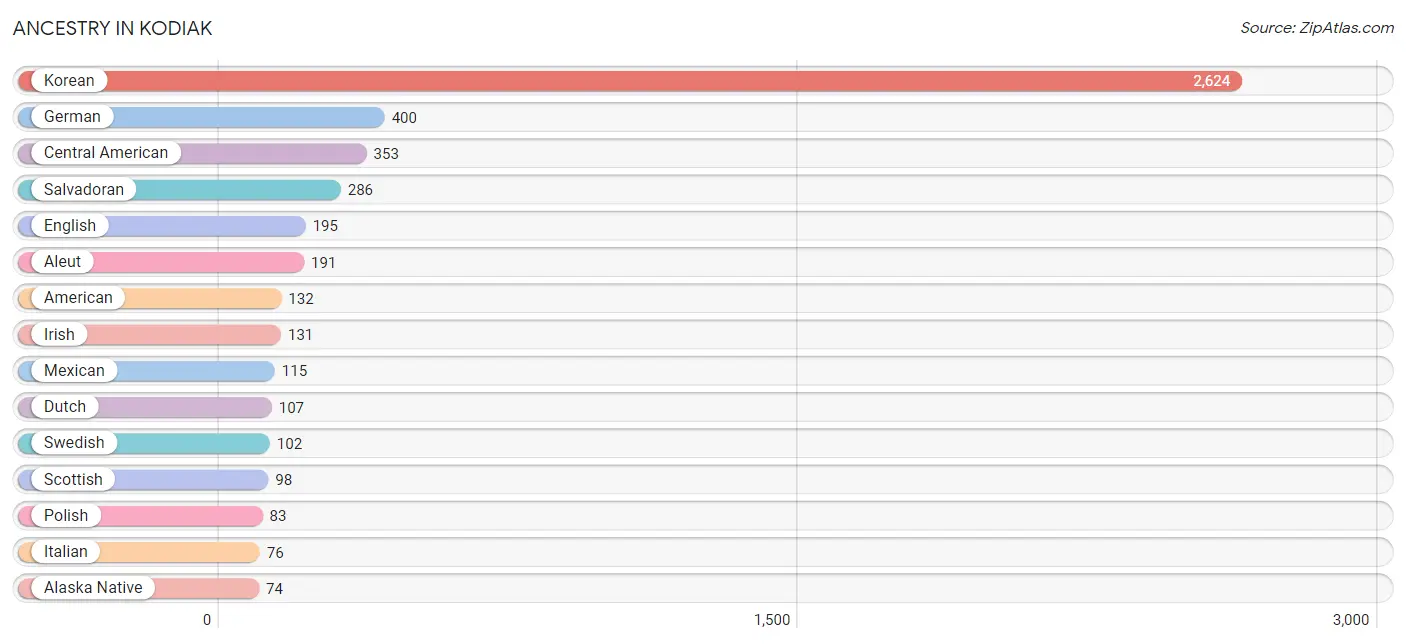
Ancestry in Kodiak
The most populous ancestries reported in Kodiak are Korean (2,624 | 47.0%), German (400 | 7.2%), Central American (353 | 6.3%), Salvadoran (286 | 5.1%), and English (195 | 3.5%), together accounting for 69.1% of all Kodiak residents.
| Ancestry | # Population | % Population |
| African | 1 | 0.0% |
| Alaska Native | 74 | 1.3% |
| Alaskan Athabascan | 44 | 0.8% |
| Aleut | 191 | 3.4% |
| American | 132 | 2.4% |
| Basque | 3 | 0.1% |
| Bhutanese | 32 | 0.6% |
| British | 8 | 0.1% |
| British West Indian | 16 | 0.3% |
| Burmese | 28 | 0.5% |
| Canadian | 72 | 1.3% |
| Central American | 353 | 6.3% |
| Chippewa | 14 | 0.3% |
| Danish | 10 | 0.2% |
| Dominican | 16 | 0.3% |
| Dutch | 107 | 1.9% |
| Eastern European | 3 | 0.1% |
| English | 195 | 3.5% |
| European | 57 | 1.0% |
| Finnish | 47 | 0.8% |
| French | 44 | 0.8% |
| German | 400 | 7.2% |
| Greek | 10 | 0.2% |
| Guatemalan | 67 | 1.2% |
| Hungarian | 14 | 0.3% |
| Indian (Asian) | 14 | 0.3% |
| Inupiat | 7 | 0.1% |
| Irish | 131 | 2.4% |
| Italian | 76 | 1.4% |
| Korean | 2,624 | 47.0% |
| Lithuanian | 3 | 0.1% |
| Malaysian | 14 | 0.3% |
| Mexican | 115 | 2.1% |
| Northern European | 23 | 0.4% |
| Norwegian | 32 | 0.6% |
| Pakistani | 8 | 0.1% |
| Polish | 83 | 1.5% |
| Portuguese | 4 | 0.1% |
| Pueblo | 6 | 0.1% |
| Puerto Rican | 9 | 0.2% |
| Russian | 7 | 0.1% |
| Salvadoran | 286 | 5.1% |
| Scandinavian | 2 | 0.0% |
| Scotch-Irish | 20 | 0.4% |
| Scottish | 98 | 1.8% |
| Slavic | 5 | 0.1% |
| Sri Lankan | 20 | 0.4% |
| Subsaharan African | 1 | 0.0% |
| Swedish | 102 | 1.8% |
| Tlingit-Haida | 9 | 0.2% |
| Ukrainian | 26 | 0.5% |
| Welsh | 2 | 0.0% |
| Yup'ik | 2 | 0.0% | View All 53 Rows |
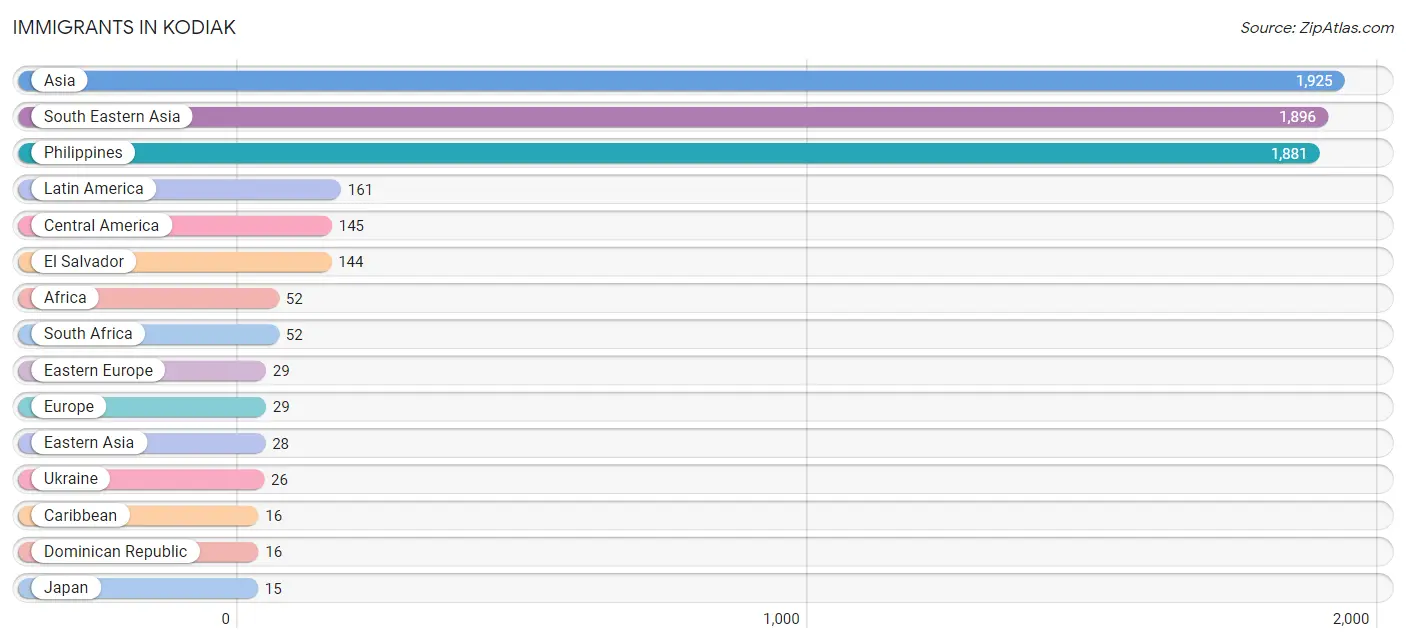
Immigrants in Kodiak
The most numerous immigrant groups reported in Kodiak came from Asia (1,925 | 34.5%), South Eastern Asia (1,896 | 34.0%), Philippines (1,881 | 33.7%), Latin America (161 | 2.9%), and Central America (145 | 2.6%), together accounting for 107.6% of all Kodiak residents.
| Immigration Origin | # Population | % Population |
| Africa | 52 | 0.9% |
| Armenia | 1 | 0.0% |
| Asia | 1,925 | 34.5% |
| Canada | 5 | 0.1% |
| Caribbean | 16 | 0.3% |
| Central America | 145 | 2.6% |
| Dominican Republic | 16 | 0.3% |
| Eastern Asia | 28 | 0.5% |
| Eastern Europe | 29 | 0.5% |
| El Salvador | 144 | 2.6% |
| Europe | 29 | 0.5% |
| Japan | 15 | 0.3% |
| Korea | 13 | 0.2% |
| Latin America | 161 | 2.9% |
| Lithuania | 3 | 0.1% |
| Mexico | 1 | 0.0% |
| Oceania | 11 | 0.2% |
| Philippines | 1,881 | 33.7% |
| South Africa | 52 | 0.9% |
| South Eastern Asia | 1,896 | 34.0% |
| Ukraine | 26 | 0.5% |
| Vietnam | 15 | 0.3% |
| Western Asia | 1 | 0.0% | View All 23 Rows |
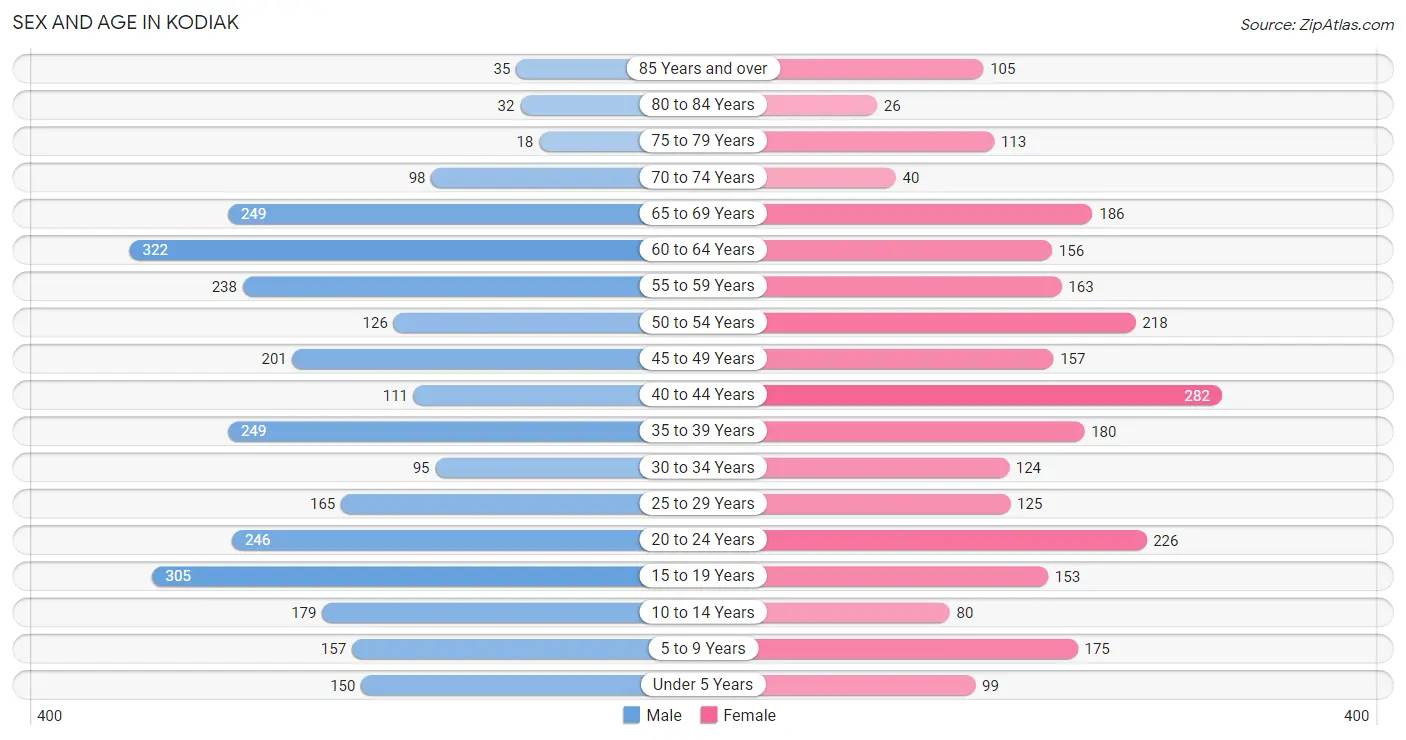
Sex and Age in Kodiak
Sex and Age in Kodiak
The most populous age groups in Kodiak are 60 to 64 Years (322 | 10.8%) for men and 40 to 44 Years (282 | 10.8%) for women.
| Age Bracket | Male | Female |
| Under 5 Years | 150 (5.0%) | 99 (3.8%) |
| 5 to 9 Years | 157 (5.3%) | 175 (6.7%) |
| 10 to 14 Years | 179 (6.0%) | 80 (3.1%) |
| 15 to 19 Years | 305 (10.2%) | 153 (5.9%) |
| 20 to 24 Years | 246 (8.3%) | 226 (8.7%) |
| 25 to 29 Years | 165 (5.5%) | 125 (4.8%) |
| 30 to 34 Years | 95 (3.2%) | 124 (4.8%) |
| 35 to 39 Years | 249 (8.4%) | 180 (6.9%) |
| 40 to 44 Years | 111 (3.7%) | 282 (10.8%) |
| 45 to 49 Years | 201 (6.8%) | 157 (6.0%) |
| 50 to 54 Years | 126 (4.2%) | 218 (8.4%) |
| 55 to 59 Years | 238 (8.0%) | 163 (6.2%) |
| 60 to 64 Years | 322 (10.8%) | 156 (6.0%) |
| 65 to 69 Years | 249 (8.4%) | 186 (7.1%) |
| 70 to 74 Years | 98 (3.3%) | 40 (1.5%) |
| 75 to 79 Years | 18 (0.6%) | 113 (4.3%) |
| 80 to 84 Years | 32 (1.1%) | 26 (1.0%) |
| 85 Years and over | 35 (1.2%) | 105 (4.0%) |
| Total | 2,976 (100.0%) | 2,608 (100.0%) |
Families and Households in Kodiak
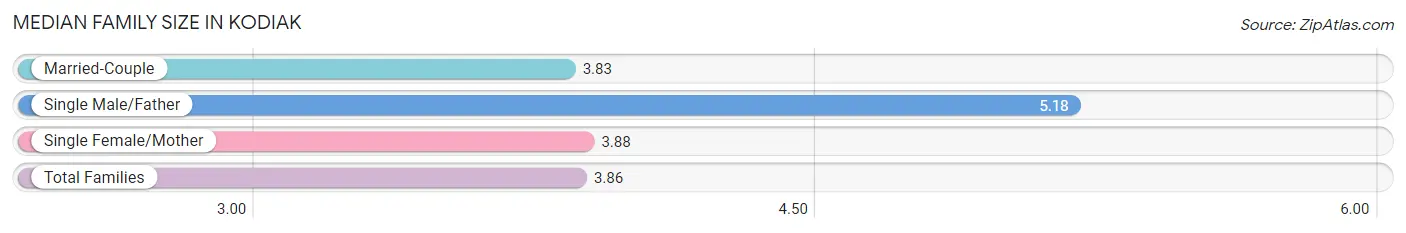
Median Family Size in Kodiak
The median family size in Kodiak is 3.86 persons per family, with single male/father families (17 | 1.5%) accounting for the largest median family size of 5.18 persons per family. On the other hand, married-couple families (875 | 77.8%) represent the smallest median family size with 3.83 persons per family.
| Family Type | # Families | Family Size |
| Married-Couple | 875 (77.8%) | 3.83 |
| Single Male/Father | 17 (1.5%) | 5.18 |
| Single Female/Mother | 233 (20.7%) | 3.88 |
| Total Families | 1,125 (100.0%) | 3.86 |
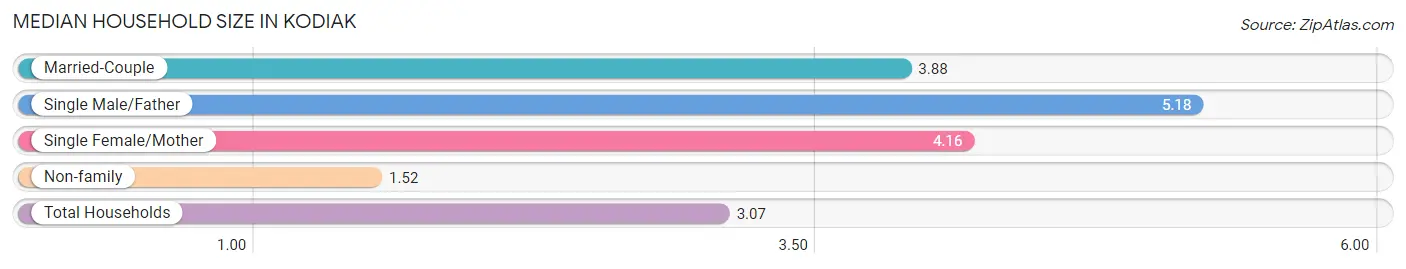
Median Household Size in Kodiak
The median household size in Kodiak is 3.07 persons per household, with single male/father households (17 | 1.0%) accounting for the largest median household size of 5.18 persons per household. non-family households (643 | 36.4%) represent the smallest median household size with 1.52 persons per household.
| Household Type | # Households | Household Size |
| Married-Couple | 875 (49.5%) | 3.88 |
| Single Male/Father | 17 (1.0%) | 5.18 |
| Single Female/Mother | 233 (13.2%) | 4.16 |
| Non-family | 643 (36.4%) | 1.52 |
| Total Households | 1,768 (100.0%) | 3.07 |
Household Size by Marriage Status in Kodiak
Out of a total of 1,768 households in Kodiak, 1,125 (63.6%) are family households, while 643 (36.4%) are nonfamily households. The most numerous type of family households are 2-person households, comprising 284, and the most common type of nonfamily households are 1-person households, comprising 447.
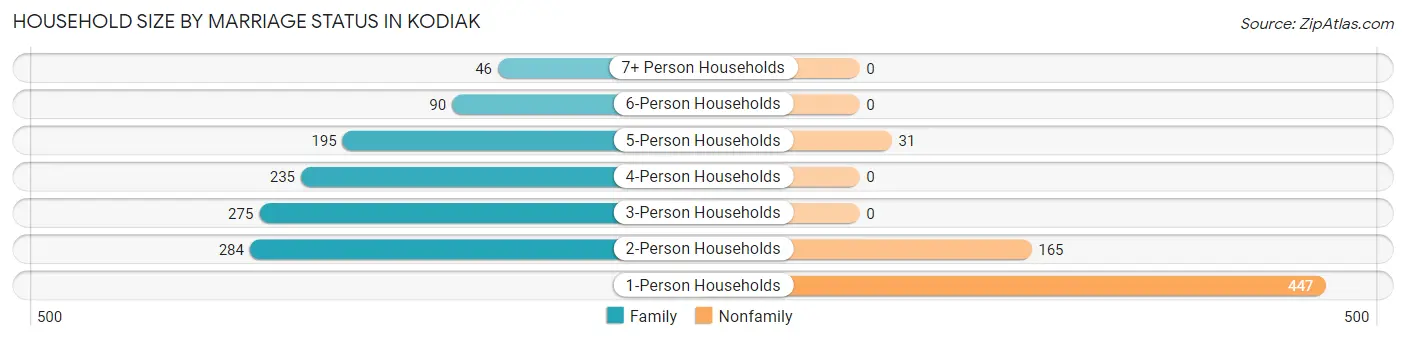
| Household Size | Family Households | Nonfamily Households |
| 1-Person Households | - | 447 (25.3%) |
| 2-Person Households | 284 (16.1%) | 165 (9.3%) |
| 3-Person Households | 275 (15.5%) | 0 (0.0%) |
| 4-Person Households | 235 (13.3%) | 0 (0.0%) |
| 5-Person Households | 195 (11.0%) | 31 (1.8%) |
| 6-Person Households | 90 (5.1%) | 0 (0.0%) |
| 7+ Person Households | 46 (2.6%) | 0 (0.0%) |
| Total | 1,125 (63.6%) | 643 (36.4%) |
Female Fertility in Kodiak
Fertility by Age in Kodiak
Average fertility rate in Kodiak is 63.0 births per 1,000 women. Women in the age bracket of 35 to 50 years have the highest fertility rate with 115.0 births per 1,000 women. Women in the age bracket of 35 to 50 years acount for 93.8% of all women with births.
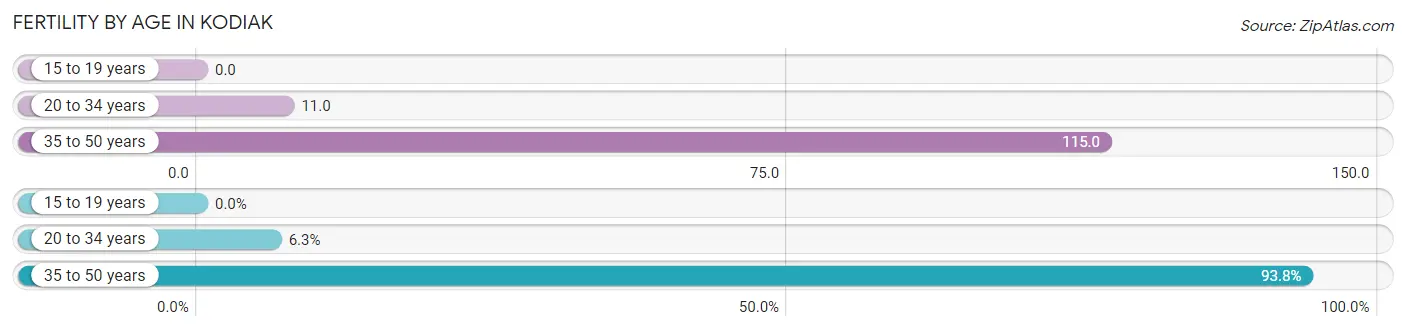
| Age Bracket | Women with Births | Births / 1,000 Women |
| 15 to 19 years | 0 (0.0%) | 0.0 |
| 20 to 34 years | 5 (6.2%) | 11.0 |
| 35 to 50 years | 75 (93.8%) | 115.0 |
| Total | 80 (100.0%) | 63.0 |
Fertility by Age by Marriage Status in Kodiak
85.0% of women with births (80) in Kodiak are married. The highest percentage of unmarried women with births falls into 20 to 34 years age bracket with 20.0% of them unmarried at the time of birth, while the lowest percentage of unmarried women with births belong to 35 to 50 years age bracket with 14.7% of them unmarried.
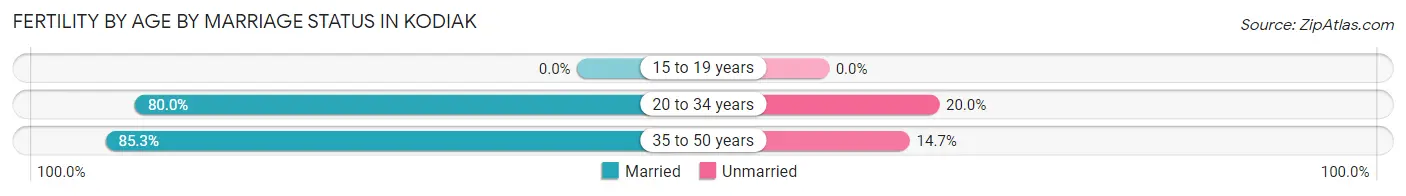
| Age Bracket | Married | Unmarried |
| 15 to 19 years | 0 (0.0%) | 0 (0.0%) |
| 20 to 34 years | 4 (80.0%) | 1 (20.0%) |
| 35 to 50 years | 64 (85.3%) | 11 (14.7%) |
| Total | 68 (85.0%) | 12 (15.0%) |
Fertility by Education in Kodiak
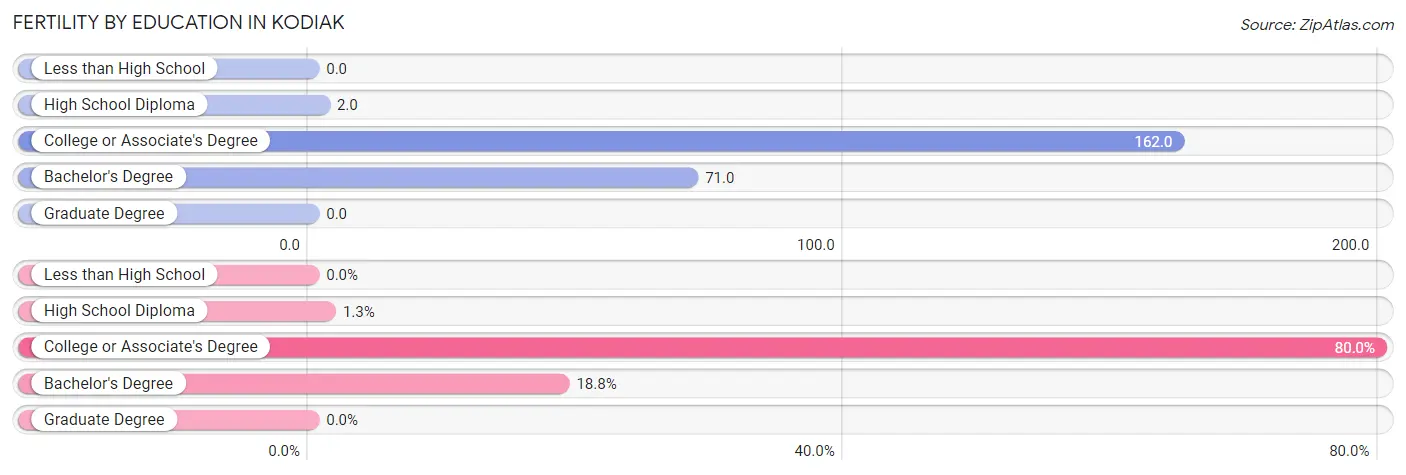
| Educational Attainment | Women with Births | Births / 1,000 Women |
| Less than High School | 0 (0.0%) | 0.0 |
| High School Diploma | 1 (1.3%) | 2.0 |
| College or Associate's Degree | 64 (80.0%) | 162.0 |
| Bachelor's Degree | 15 (18.8%) | 71.0 |
| Graduate Degree | 0 (0.0%) | 0.0 |
| Total | 80 (100.0%) | 63.0 |
Fertility by Education by Marriage Status in Kodiak
15.0% of women with births in Kodiak are unmarried. Women with the educational attainment of college or associate's degree are most likely to be married with 100.0% of them married at childbirth, while women with the educational attainment of high school diploma are least likely to be married with 100.0% of them unmarried at childbirth.
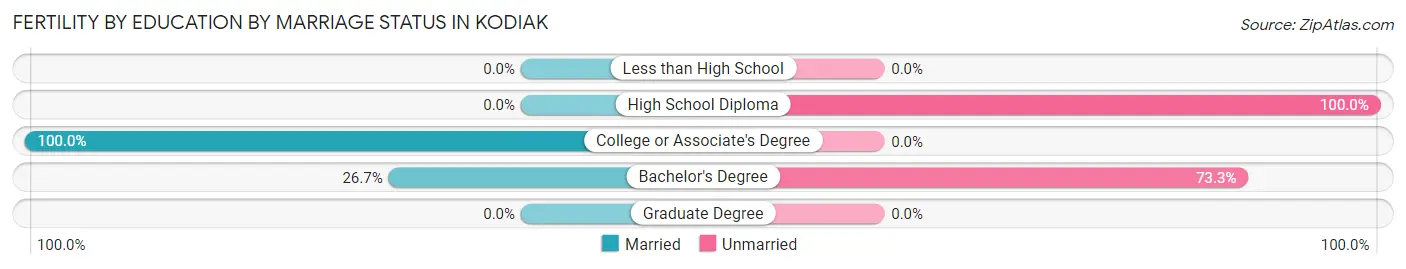
| Educational Attainment | Married | Unmarried |
| Less than High School | 0 (0.0%) | 0 (0.0%) |
| High School Diploma | 0 (0.0%) | 1 (100.0%) |
| College or Associate's Degree | 64 (100.0%) | 0 (0.0%) |
| Bachelor's Degree | 4 (26.7%) | 11 (73.3%) |
| Graduate Degree | 0 (0.0%) | 0 (0.0%) |
| Total | 68 (85.0%) | 12 (15.0%) |
Employment Characteristics in Kodiak
Employment by Class of Employer in Kodiak
Among the 3,029 employed individuals in Kodiak, private company employees (1,763 | 58.2%), federal government employees (421 | 13.9%), and not-for-profit organizations (413 | 13.6%) make up the most common classes of employment.
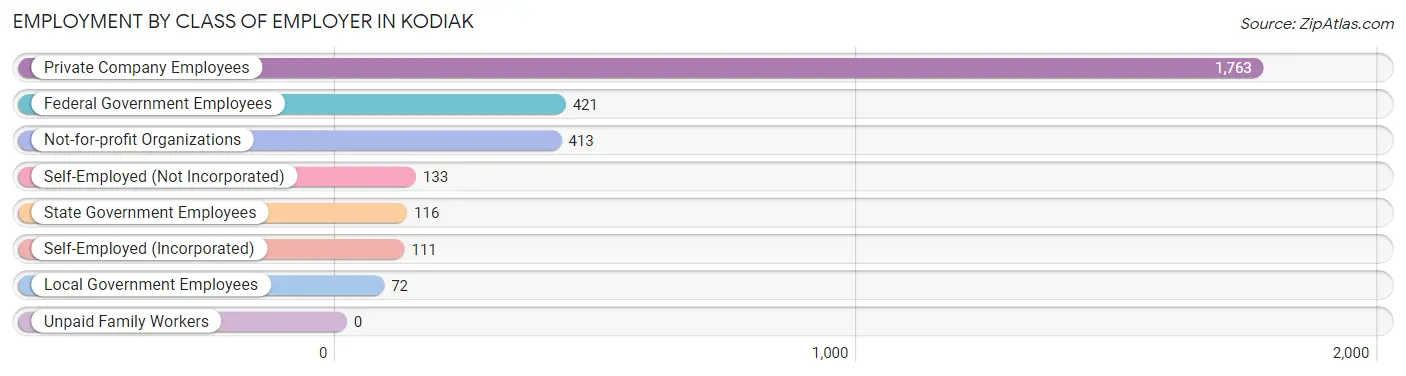
| Employer Class | # Employees | % Employees |
| Private Company Employees | 1,763 | 58.2% |
| Self-Employed (Incorporated) | 111 | 3.7% |
| Self-Employed (Not Incorporated) | 133 | 4.4% |
| Not-for-profit Organizations | 413 | 13.6% |
| Local Government Employees | 72 | 2.4% |
| State Government Employees | 116 | 3.8% |
| Federal Government Employees | 421 | 13.9% |
| Unpaid Family Workers | 0 | 0.0% |
| Total | 3,029 | 100.0% |
Employment Status by Age in Kodiak
According to the labor force statistics for Kodiak, out of the total population over 16 years of age (4,641), 69.4% or 3,221 individuals are in the labor force, with 4.8% or 155 of them unemployed. The age group with the highest labor force participation rate is 35 to 44 years, with 97.6% or 802 individuals in the labor force. Within the labor force, the 25 to 29 years age range has the highest percentage of unemployed individuals, with 41.1% or 96 of them being unemployed.
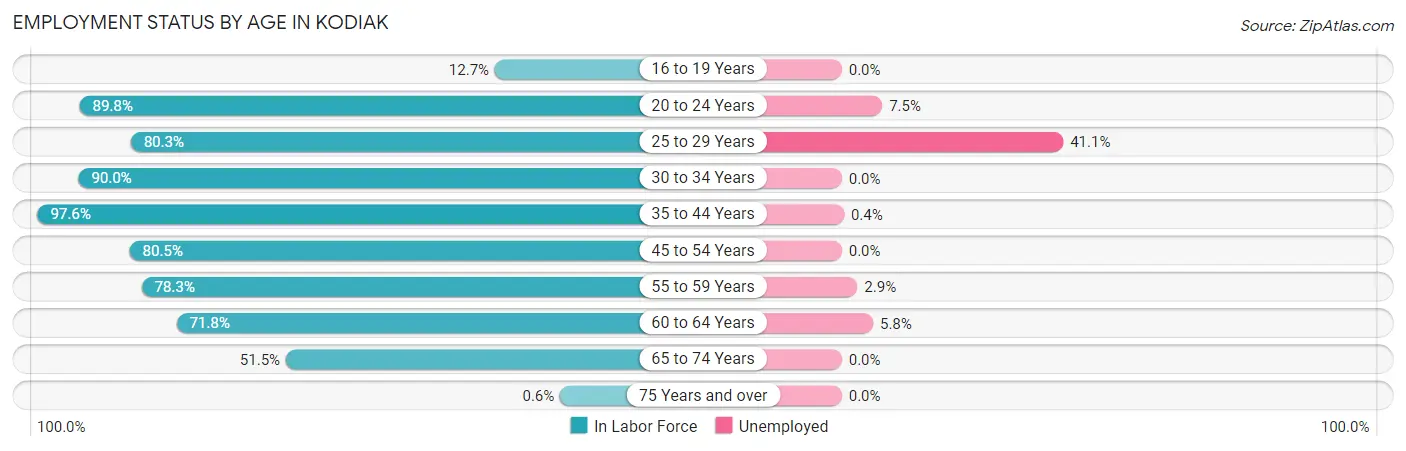
| Age Bracket | In Labor Force | Unemployed |
| 16 to 19 Years | 45 (12.7%) | 0 (0.0%) |
| 20 to 24 Years | 424 (89.8%) | 32 (7.5%) |
| 25 to 29 Years | 233 (80.3%) | 96 (41.1%) |
| 30 to 34 Years | 197 (90.0%) | 0 (0.0%) |
| 35 to 44 Years | 802 (97.6%) | 3 (0.4%) |
| 45 to 54 Years | 565 (80.5%) | 0 (0.0%) |
| 55 to 59 Years | 314 (78.3%) | 9 (2.9%) |
| 60 to 64 Years | 343 (71.8%) | 20 (5.8%) |
| 65 to 74 Years | 295 (51.5%) | 0 (0.0%) |
| 75 Years and over | 2 (0.6%) | 0 (0.0%) |
| Total | 3,221 (69.4%) | 155 (4.8%) |
Employment Status by Educational Attainment in Kodiak
According to labor force statistics for Kodiak, 84.3% of individuals (2,455) out of the total population between 25 and 64 years of age (2,912) are in the labor force, with 5.0% or 123 of them being unemployed. The group with the highest labor force participation rate are those with the educational attainment of bachelor's degree or higher, with 96.0% or 713 individuals in the labor force. Within the labor force, individuals with high school diploma education have the highest percentage of unemployment, with 10.4% or 87 of them being unemployed.
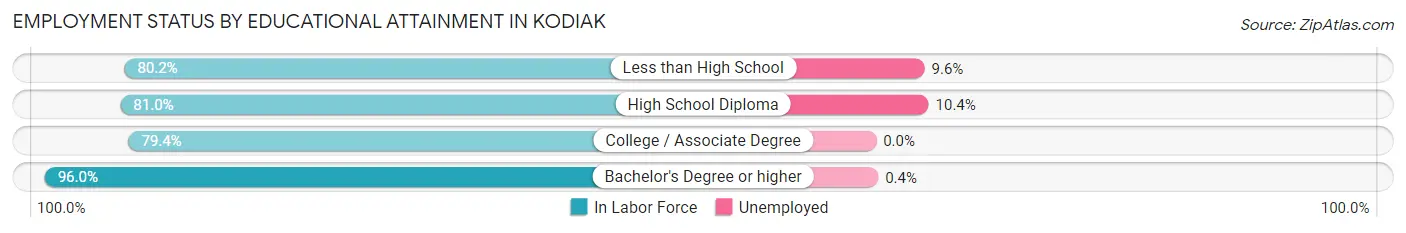
| Educational Attainment | In Labor Force | Unemployed |
| Less than High School | 303 (80.2%) | 36 (9.6%) |
| High School Diploma | 833 (81.0%) | 107 (10.4%) |
| College / Associate Degree | 605 (79.4%) | 0 (0.0%) |
| Bachelor's Degree or higher | 713 (96.0%) | 3 (0.4%) |
| Total | 2,455 (84.3%) | 146 (5.0%) |
Employment Occupations by Sex in Kodiak
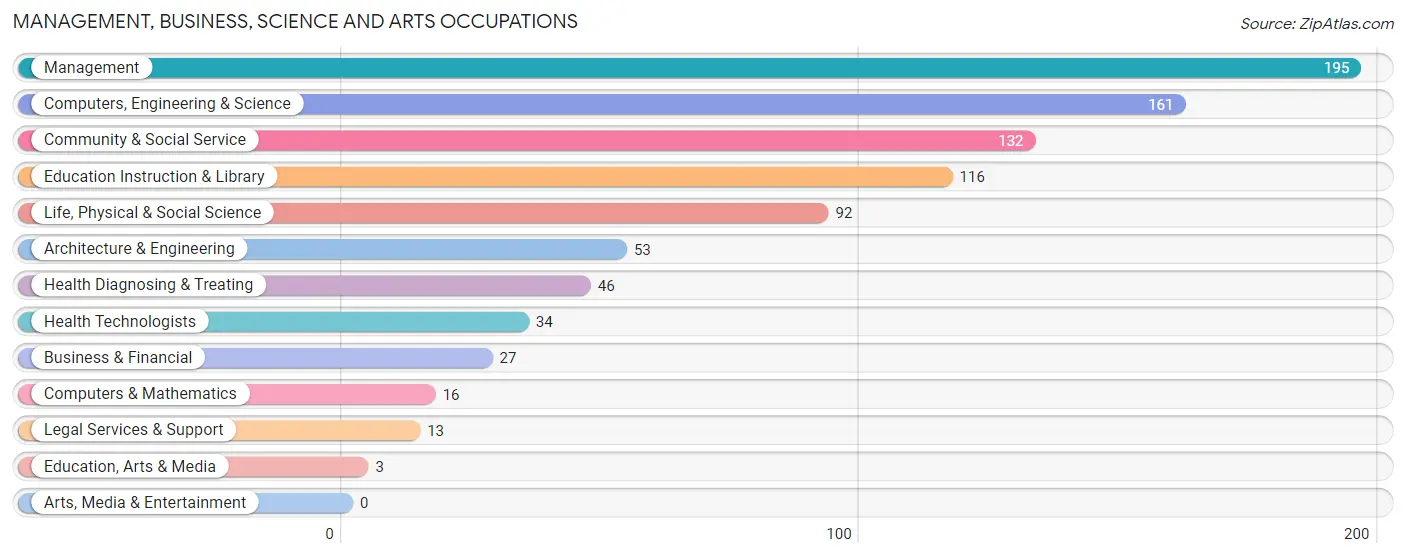
Management, Business, Science and Arts Occupations
The most common Management, Business, Science and Arts occupations in Kodiak are Management (195 | 6.7%), Computers, Engineering & Science (161 | 5.5%), Community & Social Service (132 | 4.5%), Education Instruction & Library (116 | 4.0%), and Life, Physical & Social Science (92 | 3.1%).
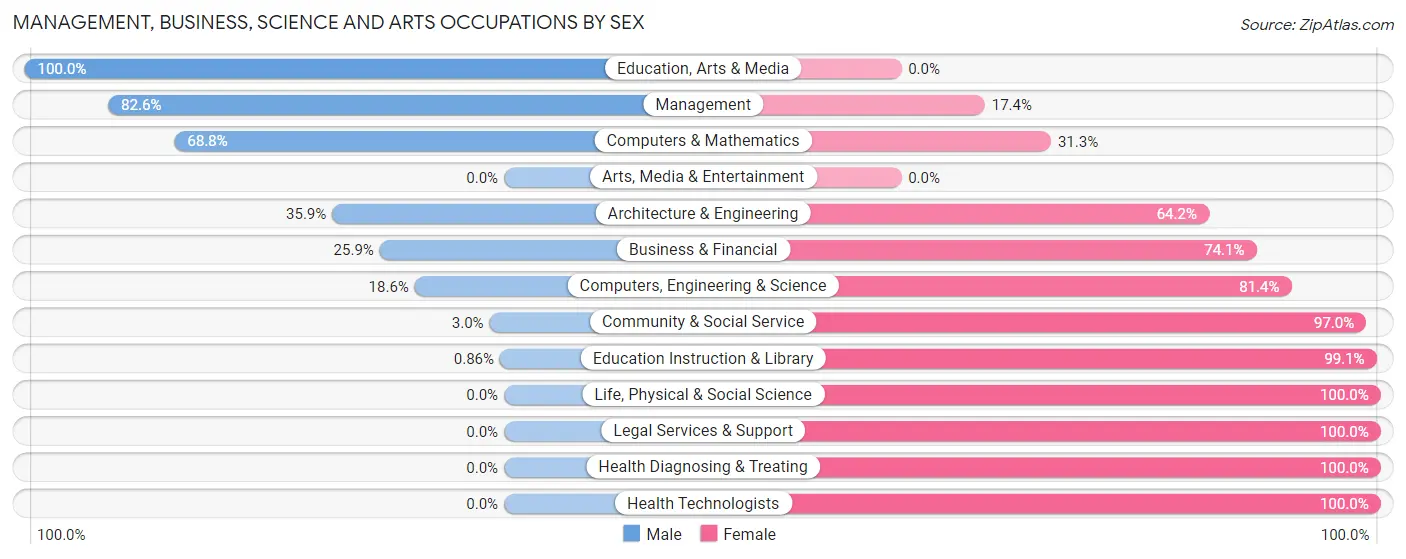
Management, Business, Science and Arts Occupations by Sex
Within the Management, Business, Science and Arts occupations in Kodiak, the most male-oriented occupations are Education, Arts & Media (100.0%), Management (82.6%), and Computers & Mathematics (68.8%), while the most female-oriented occupations are Life, Physical & Social Science (100.0%), Legal Services & Support (100.0%), and Health Diagnosing & Treating (100.0%).
| Occupation | Male | Female |
| Management | 161 (82.6%) | 34 (17.4%) |
| Business & Financial | 7 (25.9%) | 20 (74.1%) |
| Computers, Engineering & Science | 30 (18.6%) | 131 (81.4%) |
| Computers & Mathematics | 11 (68.8%) | 5 (31.2%) |
| Architecture & Engineering | 19 (35.8%) | 34 (64.1%) |
| Life, Physical & Social Science | 0 (0.0%) | 92 (100.0%) |
| Community & Social Service | 4 (3.0%) | 128 (97.0%) |
| Education, Arts & Media | 3 (100.0%) | 0 (0.0%) |
| Legal Services & Support | 0 (0.0%) | 13 (100.0%) |
| Education Instruction & Library | 1 (0.9%) | 115 (99.1%) |
| Arts, Media & Entertainment | 0 (0.0%) | 0 (0.0%) |
| Health Diagnosing & Treating | 0 (0.0%) | 46 (100.0%) |
| Health Technologists | 0 (0.0%) | 34 (100.0%) |
| Total (Category) | 202 (36.0%) | 359 (64.0%) |
| Total (Overall) | 1,561 (53.3%) | 1,365 (46.7%) |
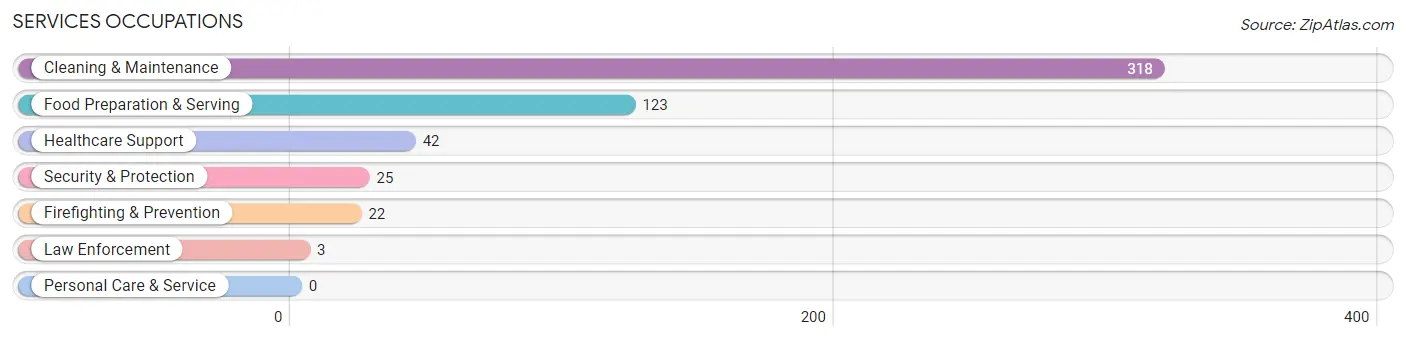
Services Occupations
The most common Services occupations in Kodiak are Cleaning & Maintenance (318 | 10.9%), Food Preparation & Serving (123 | 4.2%), Healthcare Support (42 | 1.4%), Security & Protection (25 | 0.9%), and Firefighting & Prevention (22 | 0.7%).
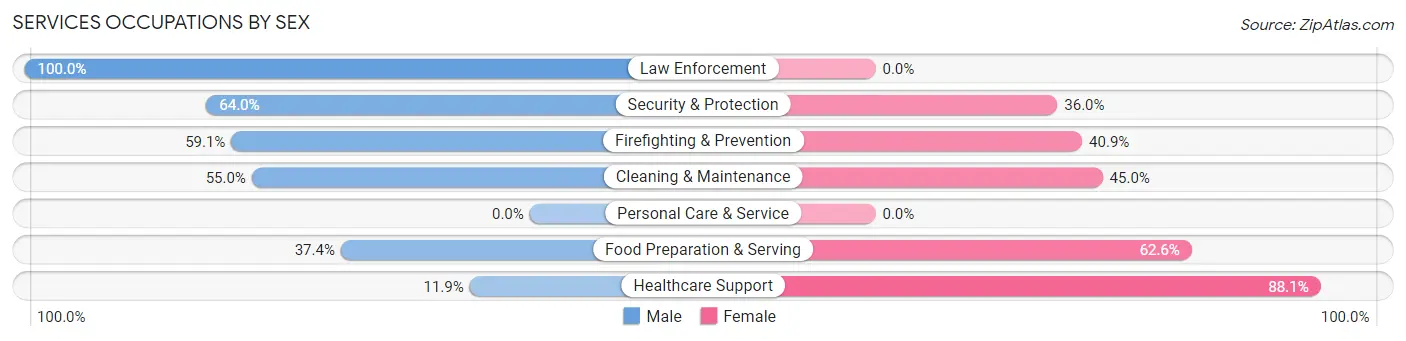
Services Occupations by Sex
Within the Services occupations in Kodiak, the most male-oriented occupations are Law Enforcement (100.0%), Security & Protection (64.0%), and Firefighting & Prevention (59.1%), while the most female-oriented occupations are Healthcare Support (88.1%), Food Preparation & Serving (62.6%), and Cleaning & Maintenance (45.0%).
| Occupation | Male | Female |
| Healthcare Support | 5 (11.9%) | 37 (88.1%) |
| Security & Protection | 16 (64.0%) | 9 (36.0%) |
| Firefighting & Prevention | 13 (59.1%) | 9 (40.9%) |
| Law Enforcement | 3 (100.0%) | 0 (0.0%) |
| Food Preparation & Serving | 46 (37.4%) | 77 (62.6%) |
| Cleaning & Maintenance | 175 (55.0%) | 143 (45.0%) |
| Personal Care & Service | 0 (0.0%) | 0 (0.0%) |
| Total (Category) | 242 (47.6%) | 266 (52.4%) |
| Total (Overall) | 1,561 (53.3%) | 1,365 (46.7%) |
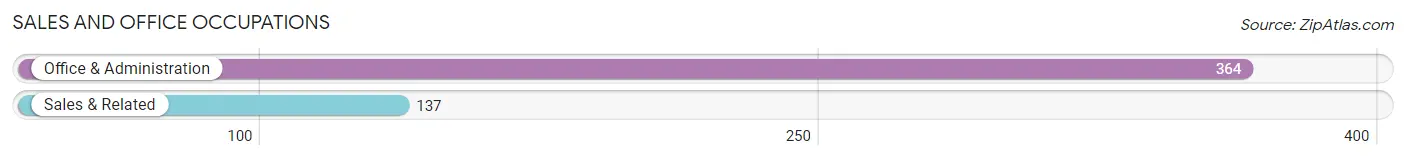
Sales and Office Occupations
The most common Sales and Office occupations in Kodiak are Office & Administration (364 | 12.4%), and Sales & Related (137 | 4.7%).
Sales and Office Occupations by Sex
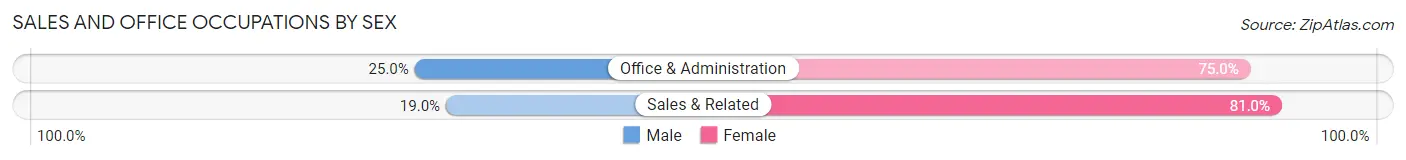
| Occupation | Male | Female |
| Sales & Related | 26 (19.0%) | 111 (81.0%) |
| Office & Administration | 91 (25.0%) | 273 (75.0%) |
| Total (Category) | 117 (23.4%) | 384 (76.6%) |
| Total (Overall) | 1,561 (53.3%) | 1,365 (46.7%) |
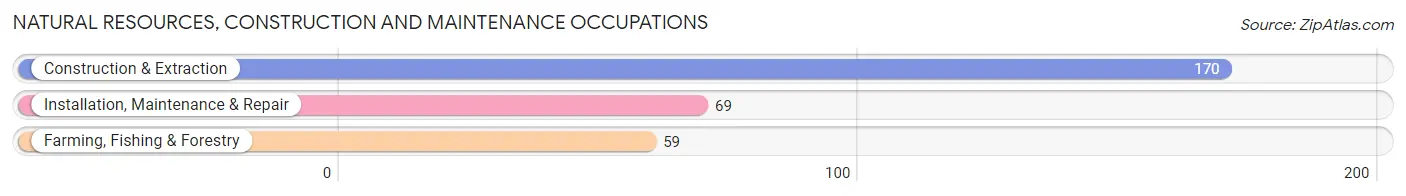
Natural Resources, Construction and Maintenance Occupations
The most common Natural Resources, Construction and Maintenance occupations in Kodiak are Construction & Extraction (170 | 5.8%), Installation, Maintenance & Repair (69 | 2.4%), and Farming, Fishing & Forestry (59 | 2.0%).
Natural Resources, Construction and Maintenance Occupations by Sex
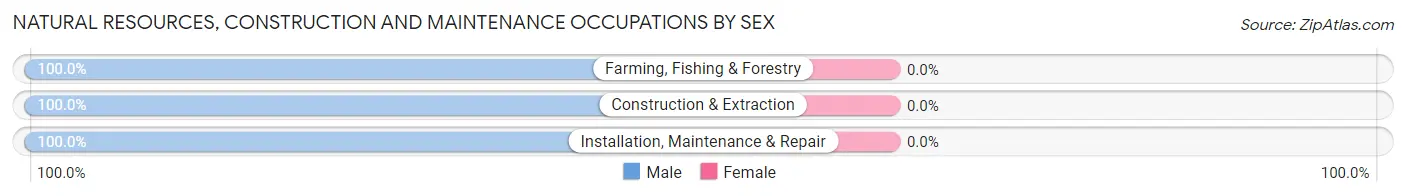
| Occupation | Male | Female |
| Farming, Fishing & Forestry | 59 (100.0%) | 0 (0.0%) |
| Construction & Extraction | 170 (100.0%) | 0 (0.0%) |
| Installation, Maintenance & Repair | 69 (100.0%) | 0 (0.0%) |
| Total (Category) | 298 (100.0%) | 0 (0.0%) |
| Total (Overall) | 1,561 (53.3%) | 1,365 (46.7%) |
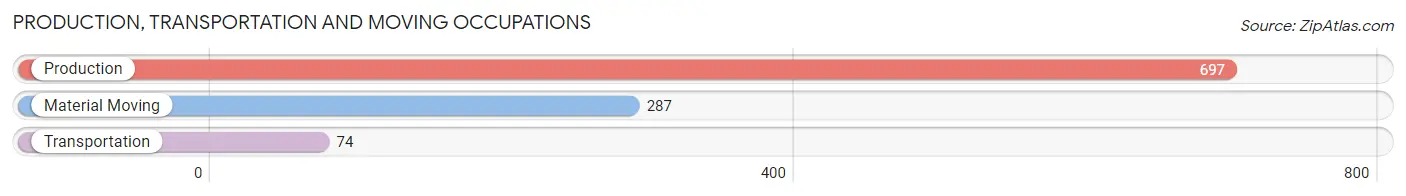
Production, Transportation and Moving Occupations
The most common Production, Transportation and Moving occupations in Kodiak are Production (697 | 23.8%), Material Moving (287 | 9.8%), and Transportation (74 | 2.5%).
Production, Transportation and Moving Occupations by Sex
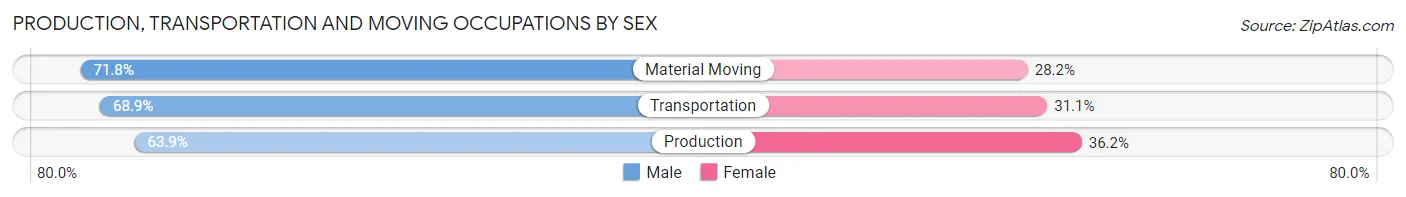
| Occupation | Male | Female |
| Production | 445 (63.8%) | 252 (36.1%) |
| Transportation | 51 (68.9%) | 23 (31.1%) |
| Material Moving | 206 (71.8%) | 81 (28.2%) |
| Total (Category) | 702 (66.3%) | 356 (33.7%) |
| Total (Overall) | 1,561 (53.3%) | 1,365 (46.7%) |
Employment Industries by Sex in Kodiak
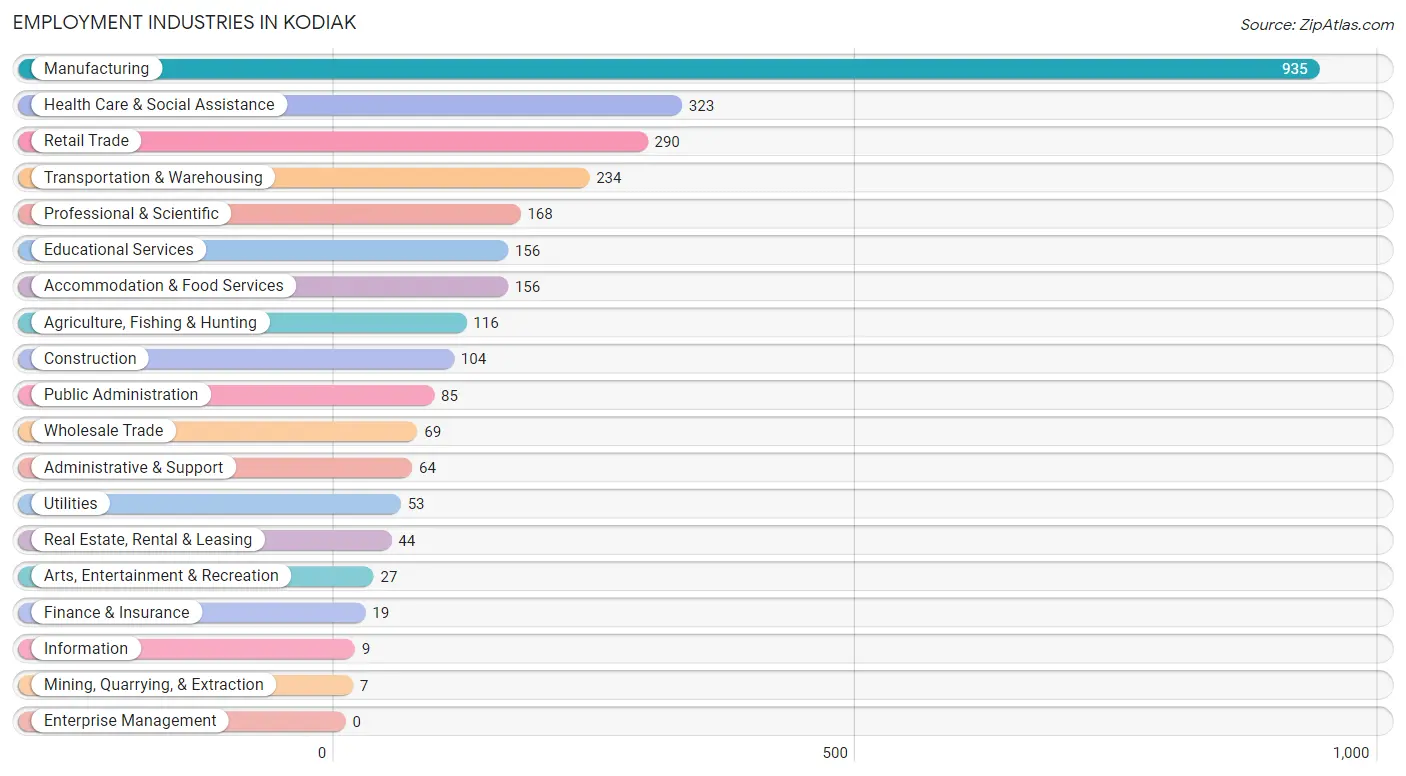
Employment Industries in Kodiak
The major employment industries in Kodiak include Manufacturing (935 | 32.0%), Health Care & Social Assistance (323 | 11.0%), Retail Trade (290 | 9.9%), Transportation & Warehousing (234 | 8.0%), and Professional & Scientific (168 | 5.7%).
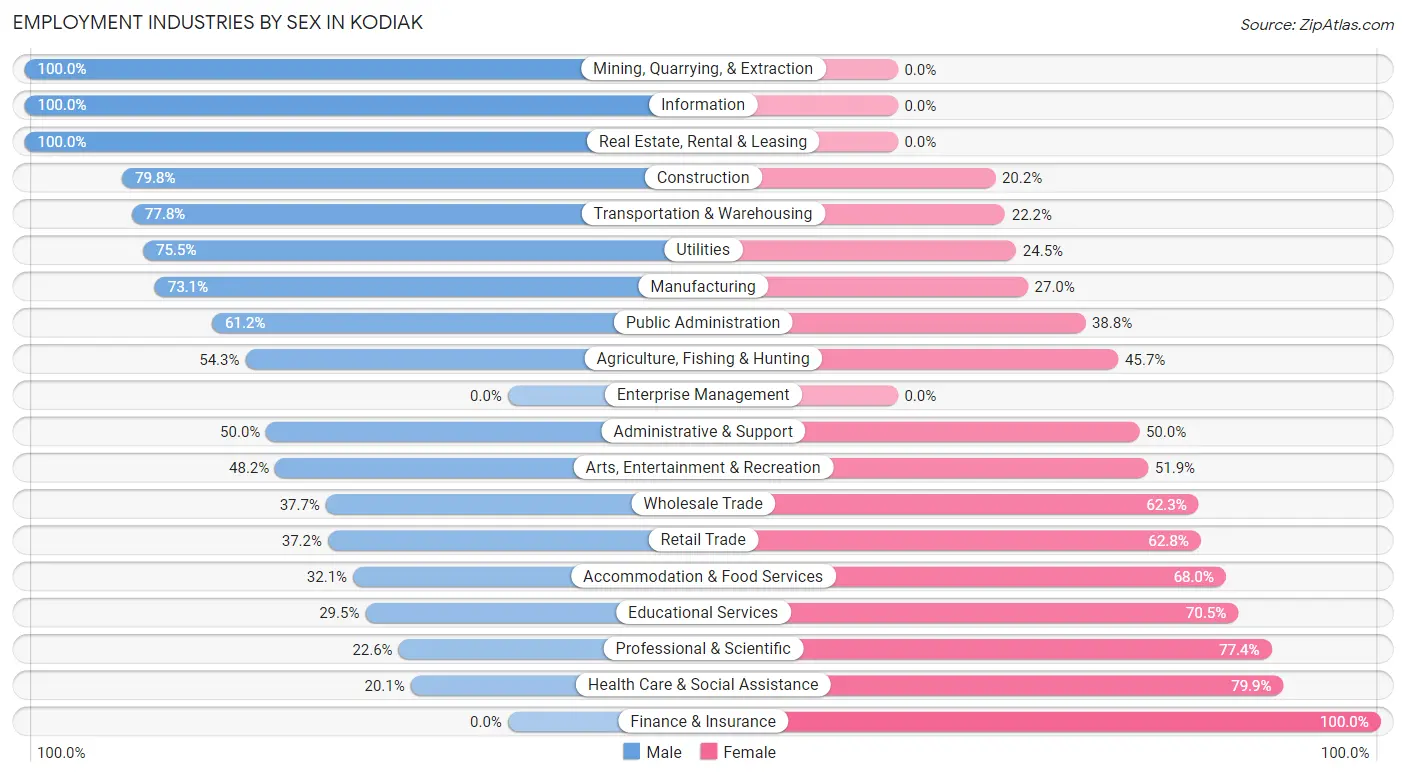
Employment Industries by Sex in Kodiak
The Kodiak industries that see more men than women are Mining, Quarrying, & Extraction (100.0%), Information (100.0%), and Real Estate, Rental & Leasing (100.0%), whereas the industries that tend to have a higher number of women are Finance & Insurance (100.0%), Health Care & Social Assistance (79.9%), and Professional & Scientific (77.4%).
| Industry | Male | Female |
| Agriculture, Fishing & Hunting | 63 (54.3%) | 53 (45.7%) |
| Mining, Quarrying, & Extraction | 7 (100.0%) | 0 (0.0%) |
| Construction | 83 (79.8%) | 21 (20.2%) |
| Manufacturing | 683 (73.1%) | 252 (27.0%) |
| Wholesale Trade | 26 (37.7%) | 43 (62.3%) |
| Retail Trade | 108 (37.2%) | 182 (62.8%) |
| Transportation & Warehousing | 182 (77.8%) | 52 (22.2%) |
| Utilities | 40 (75.5%) | 13 (24.5%) |
| Information | 9 (100.0%) | 0 (0.0%) |
| Finance & Insurance | 0 (0.0%) | 19 (100.0%) |
| Real Estate, Rental & Leasing | 44 (100.0%) | 0 (0.0%) |
| Professional & Scientific | 38 (22.6%) | 130 (77.4%) |
| Enterprise Management | 0 (0.0%) | 0 (0.0%) |
| Administrative & Support | 32 (50.0%) | 32 (50.0%) |
| Educational Services | 46 (29.5%) | 110 (70.5%) |
| Health Care & Social Assistance | 65 (20.1%) | 258 (79.9%) |
| Arts, Entertainment & Recreation | 13 (48.1%) | 14 (51.8%) |
| Accommodation & Food Services | 50 (32.1%) | 106 (67.9%) |
| Public Administration | 52 (61.2%) | 33 (38.8%) |
| Total | 1,561 (53.3%) | 1,365 (46.7%) |
Education in Kodiak
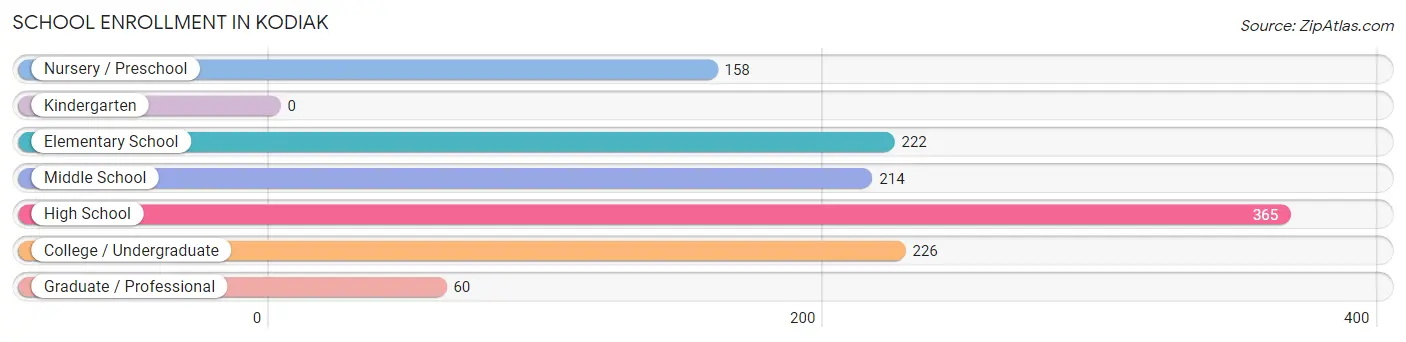
School Enrollment in Kodiak
The most common levels of schooling among the 1,245 students in Kodiak are high school (365 | 29.3%), college / undergraduate (226 | 18.1%), and elementary school (222 | 17.8%).
| School Level | # Students | % Students |
| Nursery / Preschool | 158 | 12.7% |
| Kindergarten | 0 | 0.0% |
| Elementary School | 222 | 17.8% |
| Middle School | 214 | 17.2% |
| High School | 365 | 29.3% |
| College / Undergraduate | 226 | 18.1% |
| Graduate / Professional | 60 | 4.8% |
| Total | 1,245 | 100.0% |
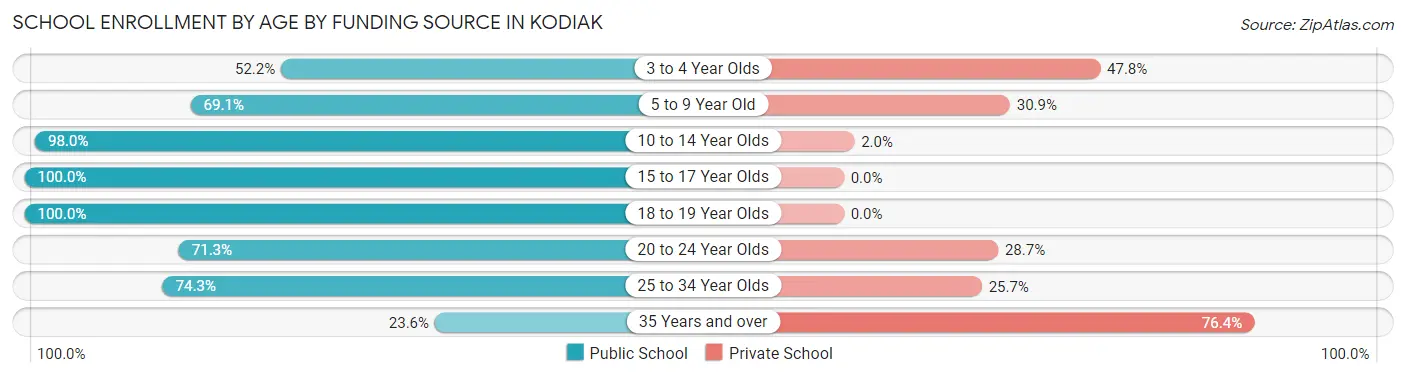
School Enrollment by Age by Funding Source in Kodiak
Out of a total of 1,245 students who are enrolled in schools in Kodiak, 260 (20.9%) attend a private institution, while the remaining 985 (79.1%) are enrolled in public schools. The age group of 35 years and over has the highest likelihood of being enrolled in private schools, with 94 (76.4% in the age bracket) enrolled. Conversely, the age group of 15 to 17 year olds has the lowest likelihood of being enrolled in a private school, with 230 (100.0% in the age bracket) attending a public institution.
| Age Bracket | Public School | Private School |
| 3 to 4 Year Olds | 35 (52.2%) | 32 (47.8%) |
| 5 to 9 Year Old | 212 (69.1%) | 95 (30.9%) |
| 10 to 14 Year Olds | 250 (98.0%) | 5 (2.0%) |
| 15 to 17 Year Olds | 230 (100.0%) | 0 (0.0%) |
| 18 to 19 Year Olds | 141 (100.0%) | 0 (0.0%) |
| 20 to 24 Year Olds | 62 (71.3%) | 25 (28.7%) |
| 25 to 34 Year Olds | 26 (74.3%) | 9 (25.7%) |
| 35 Years and over | 29 (23.6%) | 94 (76.4%) |
| Total | 985 (79.1%) | 260 (20.9%) |
Educational Attainment by Field of Study in Kodiak
Bio, nature & agricultural (226 | 22.0%), business (193 | 18.8%), arts & humanities (147 | 14.3%), education (125 | 12.2%), and science & technology (74 | 7.2%) are the most common fields of study among 1,027 individuals in Kodiak who have obtained a bachelor's degree or higher.

| Field of Study | # Graduates | % Graduates |
| Computers & Mathematics | 7 | 0.7% |
| Bio, Nature & Agricultural | 226 | 22.0% |
| Physical & Health Sciences | 18 | 1.8% |
| Psychology | 27 | 2.6% |
| Social Sciences | 65 | 6.3% |
| Engineering | 51 | 5.0% |
| Multidisciplinary Studies | 0 | 0.0% |
| Science & Technology | 74 | 7.2% |
| Business | 193 | 18.8% |
| Education | 125 | 12.2% |
| Literature & Languages | 32 | 3.1% |
| Liberal Arts & History | 19 | 1.8% |
| Visual & Performing Arts | 32 | 3.1% |
| Communications | 11 | 1.1% |
| Arts & Humanities | 147 | 14.3% |
| Total | 1,027 | 100.0% |
Transportation & Commute in Kodiak
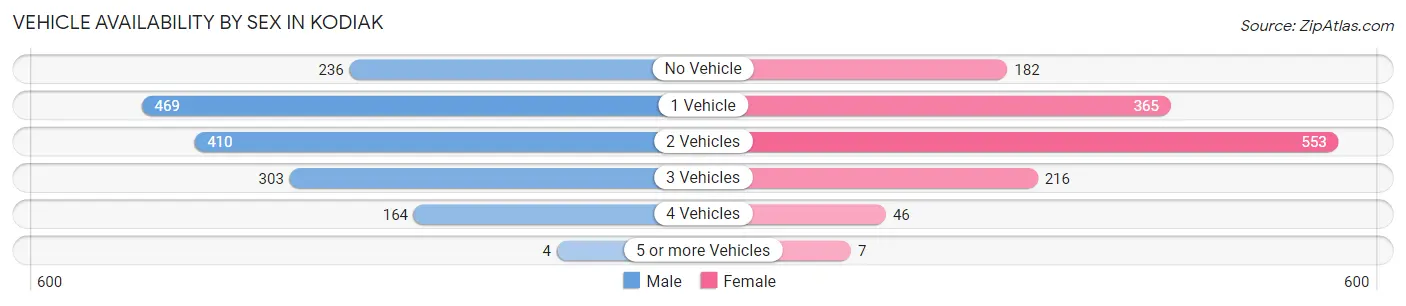
Vehicle Availability by Sex in Kodiak
The most prevalent vehicle ownership categories in Kodiak are males with 1 vehicle (469, accounting for 29.6%) and females with 1 vehicle (365, making up 34.3%).
| Vehicles Available | Male | Female |
| No Vehicle | 236 (14.9%) | 182 (13.3%) |
| 1 Vehicle | 469 (29.6%) | 365 (26.7%) |
| 2 Vehicles | 410 (25.9%) | 553 (40.4%) |
| 3 Vehicles | 303 (19.1%) | 216 (15.8%) |
| 4 Vehicles | 164 (10.3%) | 46 (3.4%) |
| 5 or more Vehicles | 4 (0.3%) | 7 (0.5%) |
| Total | 1,586 (100.0%) | 1,369 (100.0%) |
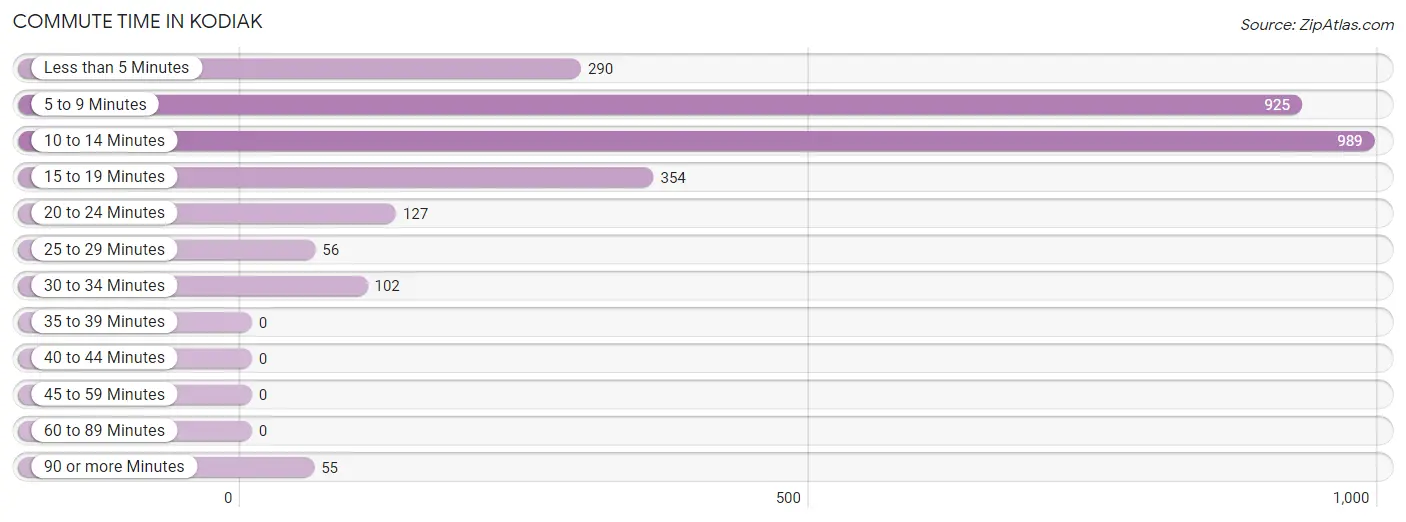
Commute Time in Kodiak
The most frequently occuring commute durations in Kodiak are 10 to 14 minutes (989 commuters, 34.1%), 5 to 9 minutes (925 commuters, 31.9%), and 15 to 19 minutes (354 commuters, 12.2%).
| Commute Time | # Commuters | % Commuters |
| Less than 5 Minutes | 290 | 10.0% |
| 5 to 9 Minutes | 925 | 31.9% |
| 10 to 14 Minutes | 989 | 34.1% |
| 15 to 19 Minutes | 354 | 12.2% |
| 20 to 24 Minutes | 127 | 4.4% |
| 25 to 29 Minutes | 56 | 1.9% |
| 30 to 34 Minutes | 102 | 3.5% |
| 35 to 39 Minutes | 0 | 0.0% |
| 40 to 44 Minutes | 0 | 0.0% |
| 45 to 59 Minutes | 0 | 0.0% |
| 60 to 89 Minutes | 0 | 0.0% |
| 90 or more Minutes | 55 | 1.9% |
Commute Time by Sex in Kodiak
The most common commute times in Kodiak are 10 to 14 minutes (654 commuters, 42.2%) for males and 5 to 9 minutes (577 commuters, 42.8%) for females.
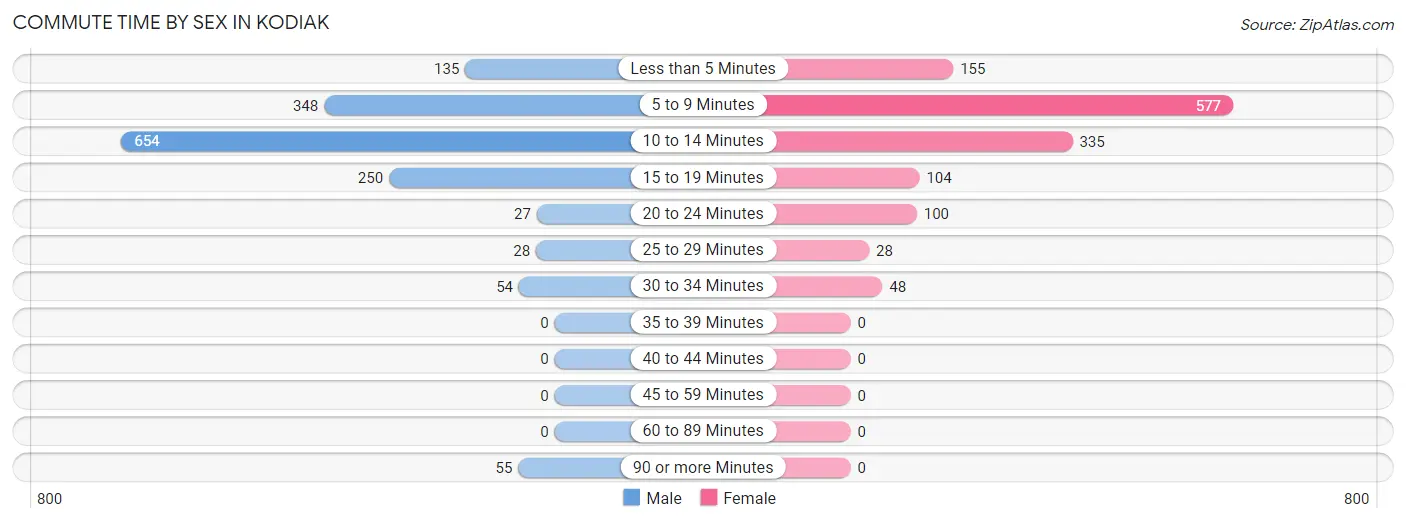
| Commute Time | Male | Female |
| Less than 5 Minutes | 135 (8.7%) | 155 (11.5%) |
| 5 to 9 Minutes | 348 (22.4%) | 577 (42.8%) |
| 10 to 14 Minutes | 654 (42.2%) | 335 (24.9%) |
| 15 to 19 Minutes | 250 (16.1%) | 104 (7.7%) |
| 20 to 24 Minutes | 27 (1.7%) | 100 (7.4%) |
| 25 to 29 Minutes | 28 (1.8%) | 28 (2.1%) |
| 30 to 34 Minutes | 54 (3.5%) | 48 (3.6%) |
| 35 to 39 Minutes | 0 (0.0%) | 0 (0.0%) |
| 40 to 44 Minutes | 0 (0.0%) | 0 (0.0%) |
| 45 to 59 Minutes | 0 (0.0%) | 0 (0.0%) |
| 60 to 89 Minutes | 0 (0.0%) | 0 (0.0%) |
| 90 or more Minutes | 55 (3.5%) | 0 (0.0%) |
Time of Departure to Work by Sex in Kodiak
The most frequent times of departure to work in Kodiak are 4:00 PM to 11:59 PM (332, 21.4%) for males and 7:30 AM to 7:59 AM (262, 19.5%) for females.
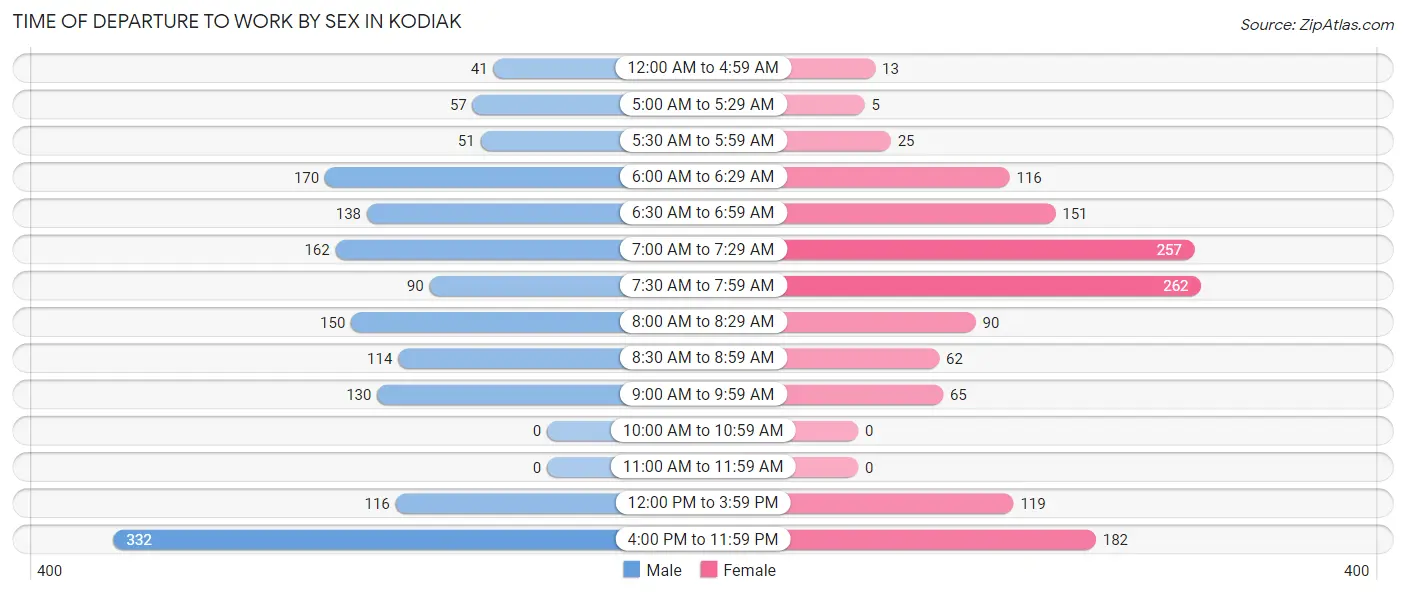
| Time of Departure | Male | Female |
| 12:00 AM to 4:59 AM | 41 (2.6%) | 13 (1.0%) |
| 5:00 AM to 5:29 AM | 57 (3.7%) | 5 (0.4%) |
| 5:30 AM to 5:59 AM | 51 (3.3%) | 25 (1.9%) |
| 6:00 AM to 6:29 AM | 170 (11.0%) | 116 (8.6%) |
| 6:30 AM to 6:59 AM | 138 (8.9%) | 151 (11.2%) |
| 7:00 AM to 7:29 AM | 162 (10.4%) | 257 (19.1%) |
| 7:30 AM to 7:59 AM | 90 (5.8%) | 262 (19.5%) |
| 8:00 AM to 8:29 AM | 150 (9.7%) | 90 (6.7%) |
| 8:30 AM to 8:59 AM | 114 (7.3%) | 62 (4.6%) |
| 9:00 AM to 9:59 AM | 130 (8.4%) | 65 (4.8%) |
| 10:00 AM to 10:59 AM | 0 (0.0%) | 0 (0.0%) |
| 11:00 AM to 11:59 AM | 0 (0.0%) | 0 (0.0%) |
| 12:00 PM to 3:59 PM | 116 (7.5%) | 119 (8.8%) |
| 4:00 PM to 11:59 PM | 332 (21.4%) | 182 (13.5%) |
| Total | 1,551 (100.0%) | 1,347 (100.0%) |
Housing Occupancy in Kodiak
Occupancy by Ownership in Kodiak
Of the total 1,768 dwellings in Kodiak, owner-occupied units account for 889 (50.3%), while renter-occupied units make up 879 (49.7%).
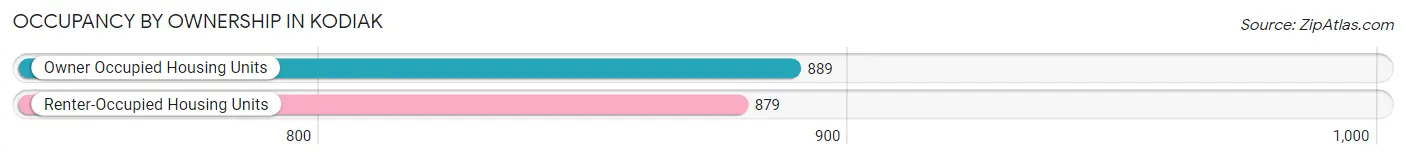
| Occupancy | # Housing Units | % Housing Units |
| Owner Occupied Housing Units | 889 | 50.3% |
| Renter-Occupied Housing Units | 879 | 49.7% |
| Total Occupied Housing Units | 1,768 | 100.0% |
Occupancy by Household Size in Kodiak
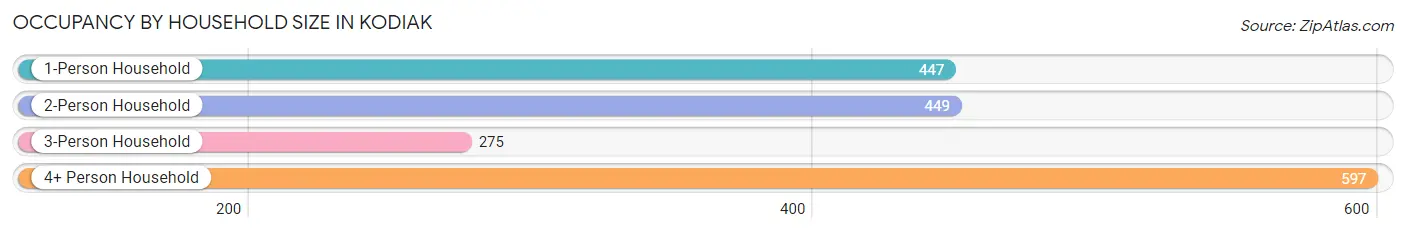
| Household Size | # Housing Units | % Housing Units |
| 1-Person Household | 447 | 25.3% |
| 2-Person Household | 449 | 25.4% |
| 3-Person Household | 275 | 15.5% |
| 4+ Person Household | 597 | 33.8% |
| Total Housing Units | 1,768 | 100.0% |
Occupancy by Ownership by Household Size in Kodiak
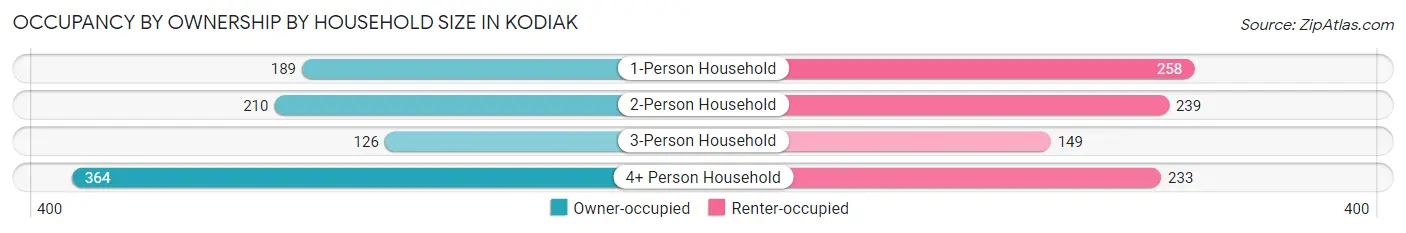
| Household Size | Owner-occupied | Renter-occupied |
| 1-Person Household | 189 (42.3%) | 258 (57.7%) |
| 2-Person Household | 210 (46.8%) | 239 (53.2%) |
| 3-Person Household | 126 (45.8%) | 149 (54.2%) |
| 4+ Person Household | 364 (61.0%) | 233 (39.0%) |
| Total Housing Units | 889 (50.3%) | 879 (49.7%) |
Occupancy by Educational Attainment in Kodiak
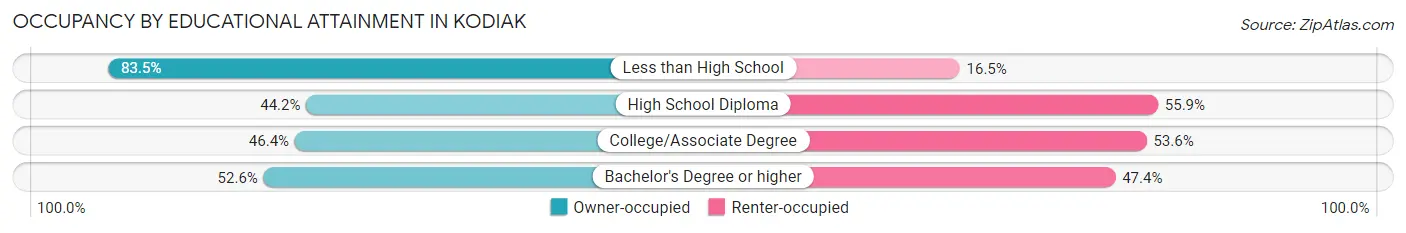
| Household Size | Owner-occupied | Renter-occupied |
| Less than High School | 111 (83.5%) | 22 (16.5%) |
| High School Diploma | 253 (44.2%) | 320 (55.8%) |
| College/Associate Degree | 252 (46.4%) | 291 (53.6%) |
| Bachelor's Degree or higher | 273 (52.6%) | 246 (47.4%) |
Occupancy by Age of Householder in Kodiak
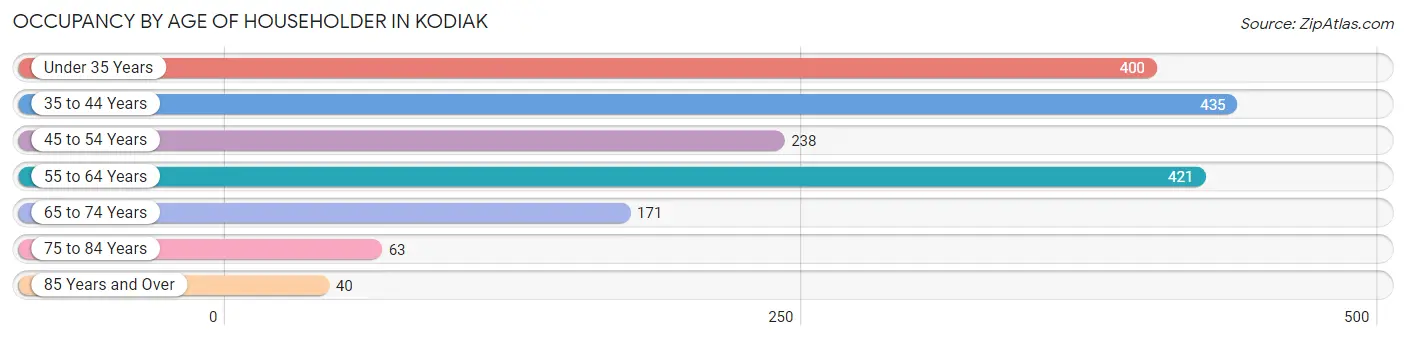
| Age Bracket | # Households | % Households |
| Under 35 Years | 400 | 22.6% |
| 35 to 44 Years | 435 | 24.6% |
| 45 to 54 Years | 238 | 13.5% |
| 55 to 64 Years | 421 | 23.8% |
| 65 to 74 Years | 171 | 9.7% |
| 75 to 84 Years | 63 | 3.6% |
| 85 Years and Over | 40 | 2.3% |
| Total | 1,768 | 100.0% |
Housing Finances in Kodiak
Median Income by Occupancy in Kodiak
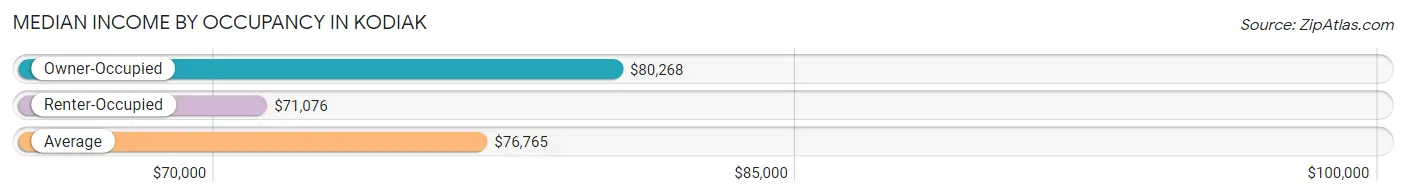
| Occupancy Type | # Households | Median Income |
| Owner-Occupied | 889 (50.3%) | $80,268 |
| Renter-Occupied | 879 (49.7%) | $71,076 |
| Average | 1,768 (100.0%) | $76,765 |
Occupancy by Householder Income Bracket in Kodiak
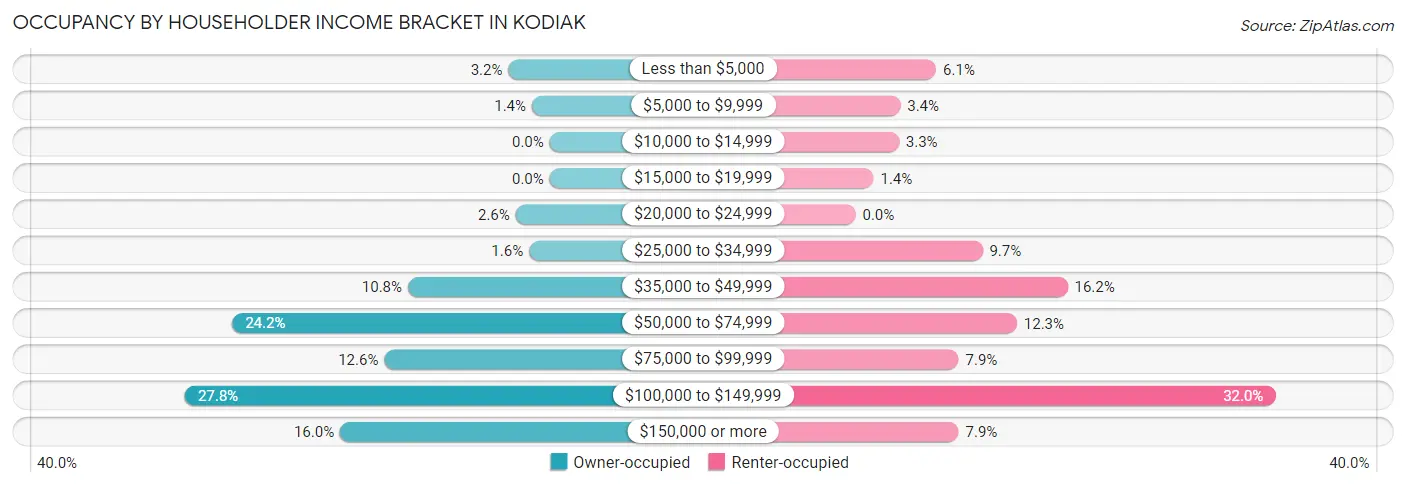
| Income Bracket | Owner-occupied | Renter-occupied |
| Less than $5,000 | 28 (3.2%) | 54 (6.1%) |
| $5,000 to $9,999 | 12 (1.3%) | 30 (3.4%) |
| $10,000 to $14,999 | 0 (0.0%) | 29 (3.3%) |
| $15,000 to $19,999 | 0 (0.0%) | 12 (1.4%) |
| $20,000 to $24,999 | 23 (2.6%) | 0 (0.0%) |
| $25,000 to $34,999 | 14 (1.6%) | 85 (9.7%) |
| $35,000 to $49,999 | 96 (10.8%) | 142 (16.2%) |
| $50,000 to $74,999 | 215 (24.2%) | 108 (12.3%) |
| $75,000 to $99,999 | 112 (12.6%) | 69 (7.9%) |
| $100,000 to $149,999 | 247 (27.8%) | 281 (32.0%) |
| $150,000 or more | 142 (16.0%) | 69 (7.9%) |
| Total | 889 (100.0%) | 879 (100.0%) |
Monthly Housing Cost Tiers in Kodiak
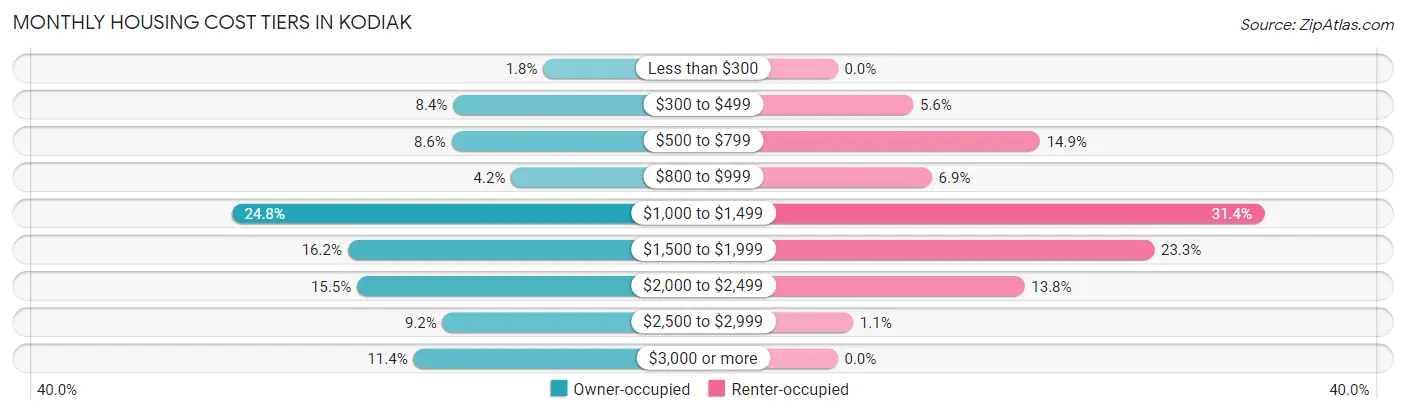
| Monthly Cost | Owner-occupied | Renter-occupied |
| Less than $300 | 16 (1.8%) | 0 (0.0%) |
| $300 to $499 | 75 (8.4%) | 49 (5.6%) |
| $500 to $799 | 76 (8.6%) | 131 (14.9%) |
| $800 to $999 | 37 (4.2%) | 61 (6.9%) |
| $1,000 to $1,499 | 220 (24.7%) | 276 (31.4%) |
| $1,500 to $1,999 | 144 (16.2%) | 205 (23.3%) |
| $2,000 to $2,499 | 138 (15.5%) | 121 (13.8%) |
| $2,500 to $2,999 | 82 (9.2%) | 10 (1.1%) |
| $3,000 or more | 101 (11.4%) | 0 (0.0%) |
| Total | 889 (100.0%) | 879 (100.0%) |
Physical Housing Characteristics in Kodiak
Housing Structures in Kodiak
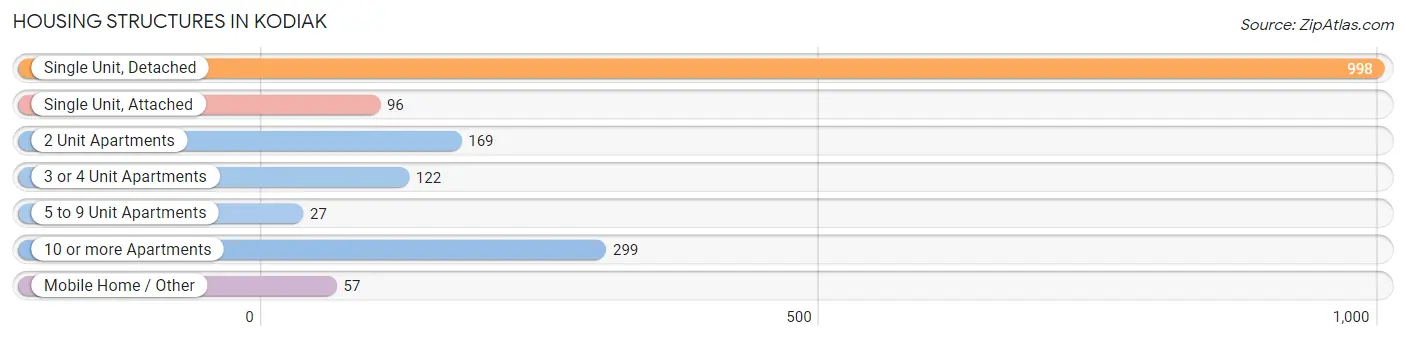
| Structure Type | # Housing Units | % Housing Units |
| Single Unit, Detached | 998 | 56.5% |
| Single Unit, Attached | 96 | 5.4% |
| 2 Unit Apartments | 169 | 9.6% |
| 3 or 4 Unit Apartments | 122 | 6.9% |
| 5 to 9 Unit Apartments | 27 | 1.5% |
| 10 or more Apartments | 299 | 16.9% |
| Mobile Home / Other | 57 | 3.2% |
| Total | 1,768 | 100.0% |
Housing Structures by Occupancy in Kodiak
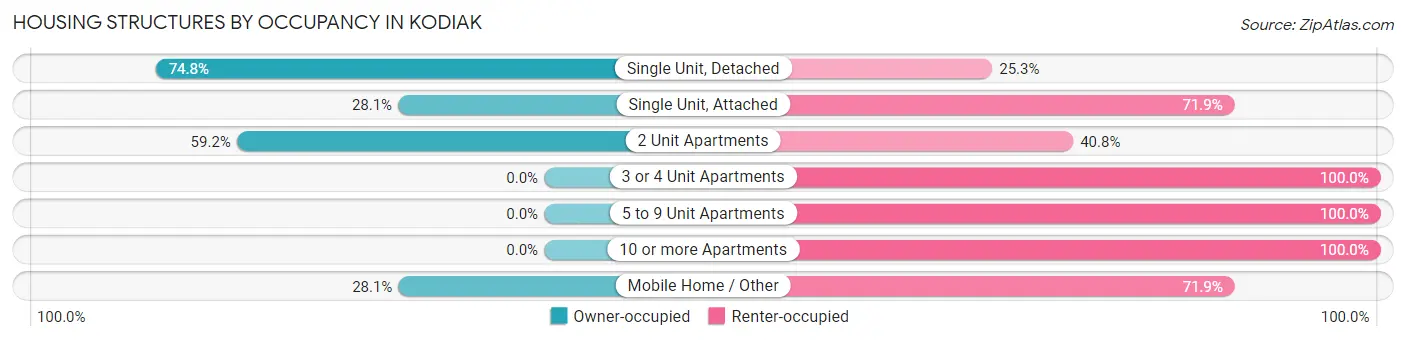
| Structure Type | Owner-occupied | Renter-occupied |
| Single Unit, Detached | 746 (74.8%) | 252 (25.3%) |
| Single Unit, Attached | 27 (28.1%) | 69 (71.9%) |
| 2 Unit Apartments | 100 (59.2%) | 69 (40.8%) |
| 3 or 4 Unit Apartments | 0 (0.0%) | 122 (100.0%) |
| 5 to 9 Unit Apartments | 0 (0.0%) | 27 (100.0%) |
| 10 or more Apartments | 0 (0.0%) | 299 (100.0%) |
| Mobile Home / Other | 16 (28.1%) | 41 (71.9%) |
| Total | 889 (50.3%) | 879 (49.7%) |
Housing Structures by Number of Rooms in Kodiak
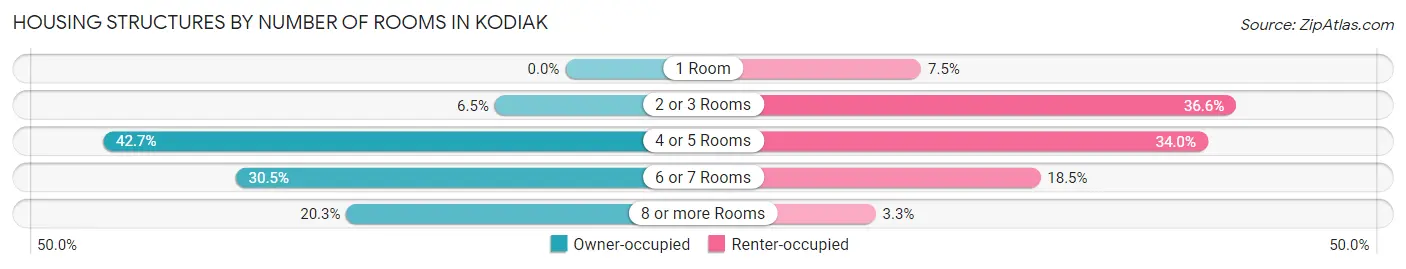
| Number of Rooms | Owner-occupied | Renter-occupied |
| 1 Room | 0 (0.0%) | 66 (7.5%) |
| 2 or 3 Rooms | 58 (6.5%) | 322 (36.6%) |
| 4 or 5 Rooms | 380 (42.7%) | 299 (34.0%) |
| 6 or 7 Rooms | 271 (30.5%) | 163 (18.5%) |
| 8 or more Rooms | 180 (20.3%) | 29 (3.3%) |
| Total | 889 (100.0%) | 879 (100.0%) |
Housing Structure by Heating Type in Kodiak
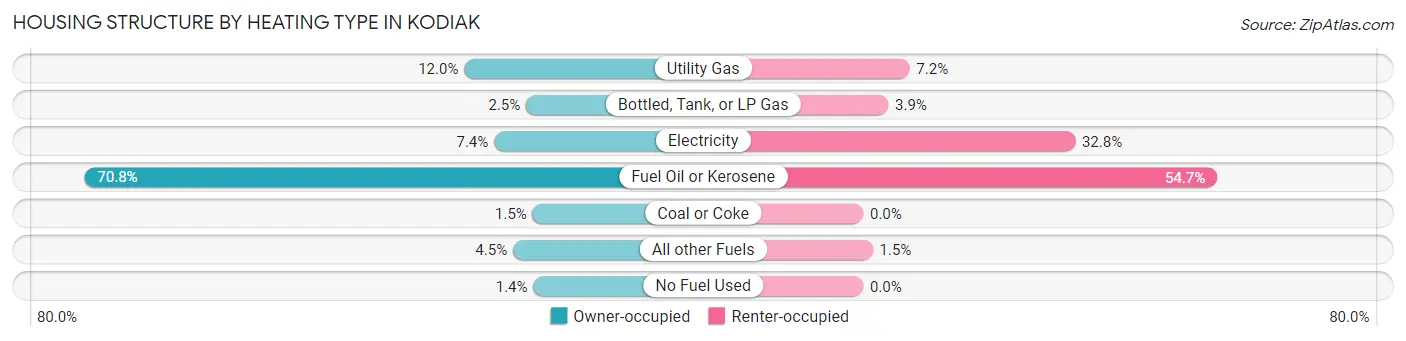
| Heating Type | Owner-occupied | Renter-occupied |
| Utility Gas | 107 (12.0%) | 63 (7.2%) |
| Bottled, Tank, or LP Gas | 22 (2.5%) | 34 (3.9%) |
| Electricity | 66 (7.4%) | 288 (32.8%) |
| Fuel Oil or Kerosene | 629 (70.8%) | 481 (54.7%) |
| Coal or Coke | 13 (1.5%) | 0 (0.0%) |
| All other Fuels | 40 (4.5%) | 13 (1.5%) |
| No Fuel Used | 12 (1.3%) | 0 (0.0%) |
| Total | 889 (100.0%) | 879 (100.0%) |
Household Vehicle Usage in Kodiak
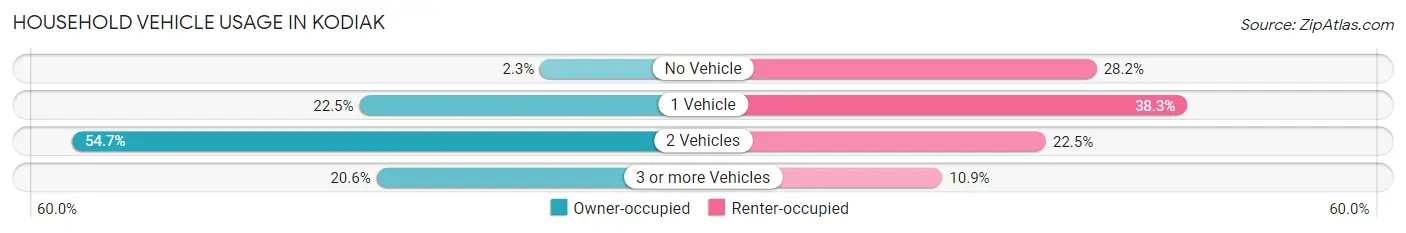
| Vehicles per Household | Owner-occupied | Renter-occupied |
| No Vehicle | 20 (2.2%) | 248 (28.2%) |
| 1 Vehicle | 200 (22.5%) | 337 (38.3%) |
| 2 Vehicles | 486 (54.7%) | 198 (22.5%) |
| 3 or more Vehicles | 183 (20.6%) | 96 (10.9%) |
| Total | 889 (100.0%) | 879 (100.0%) |
Real Estate & Mortgages in Kodiak
Real Estate and Mortgage Overview in Kodiak
| Characteristic | Without Mortgage | With Mortgage |
| Housing Units | 199 | 690 |
| Median Property Value | $276,000 | $284,900 |
| Median Household Income | $59,556 | $85 |
| Monthly Housing Costs | $524 | $101 |
| Real Estate Taxes | $2,605 | $8 |
Property Value by Mortgage Status in Kodiak
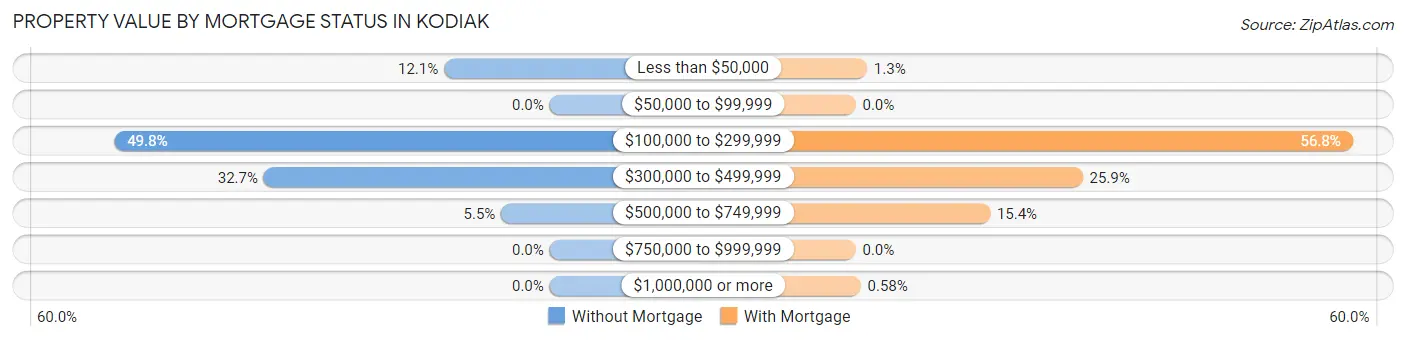
| Property Value | Without Mortgage | With Mortgage |
| Less than $50,000 | 24 (12.1%) | 9 (1.3%) |
| $50,000 to $99,999 | 0 (0.0%) | 0 (0.0%) |
| $100,000 to $299,999 | 99 (49.7%) | 392 (56.8%) |
| $300,000 to $499,999 | 65 (32.7%) | 179 (25.9%) |
| $500,000 to $749,999 | 11 (5.5%) | 106 (15.4%) |
| $750,000 to $999,999 | 0 (0.0%) | 0 (0.0%) |
| $1,000,000 or more | 0 (0.0%) | 4 (0.6%) |
| Total | 199 (100.0%) | 690 (100.0%) |
Household Income by Mortgage Status in Kodiak
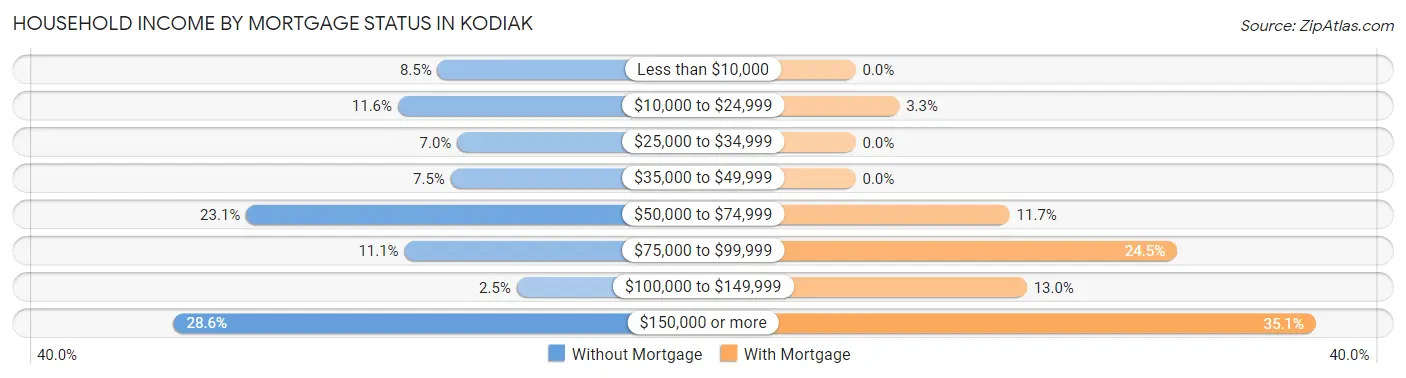
| Household Income | Without Mortgage | With Mortgage |
| Less than $10,000 | 17 (8.5%) | 0 (0.0%) |
| $10,000 to $24,999 | 23 (11.6%) | 23 (3.3%) |
| $25,000 to $34,999 | 14 (7.0%) | 0 (0.0%) |
| $35,000 to $49,999 | 15 (7.5%) | 0 (0.0%) |
| $50,000 to $74,999 | 46 (23.1%) | 81 (11.7%) |
| $75,000 to $99,999 | 22 (11.1%) | 169 (24.5%) |
| $100,000 to $149,999 | 5 (2.5%) | 90 (13.0%) |
| $150,000 or more | 57 (28.6%) | 242 (35.1%) |
| Total | 199 (100.0%) | 690 (100.0%) |
Property Value to Household Income Ratio in Kodiak
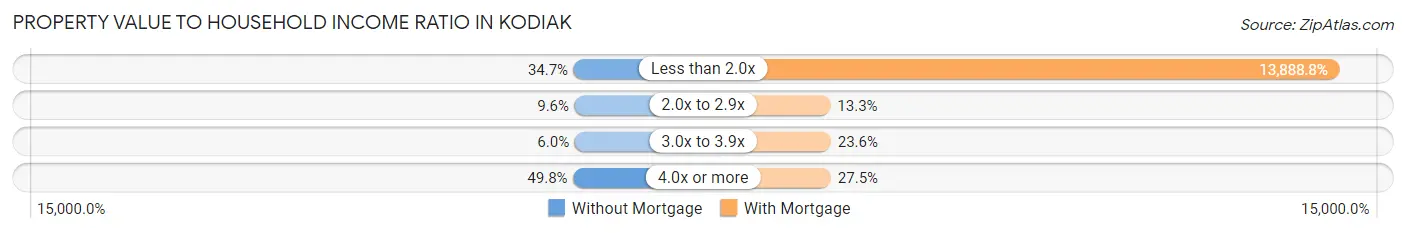
| Value-to-Income Ratio | Without Mortgage | With Mortgage |
| Less than 2.0x | 69 (34.7%) | 95,833 (13,888.8%) |
| 2.0x to 2.9x | 19 (9.6%) | 92 (13.3%) |
| 3.0x to 3.9x | 12 (6.0%) | 163 (23.6%) |
| 4.0x or more | 99 (49.7%) | 190 (27.5%) |
| Total | 199 (100.0%) | 690 (100.0%) |
Real Estate Taxes by Mortgage Status in Kodiak
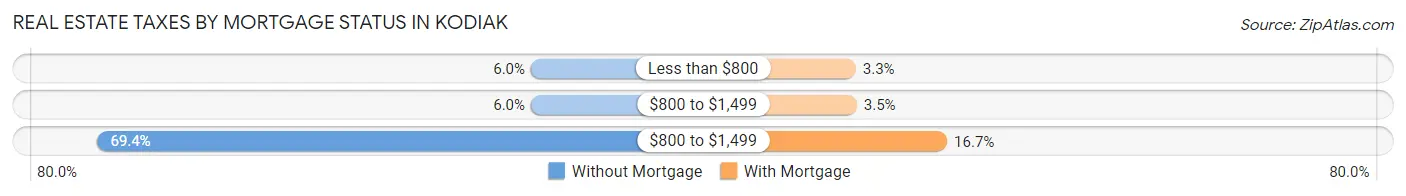
| Property Taxes | Without Mortgage | With Mortgage |
| Less than $800 | 12 (6.0%) | 23 (3.3%) |
| $800 to $1,499 | 12 (6.0%) | 24 (3.5%) |
| $800 to $1,499 | 138 (69.4%) | 115 (16.7%) |
| Total | 199 (100.0%) | 690 (100.0%) |
Health & Disability in Kodiak
Health Insurance Coverage by Age in Kodiak
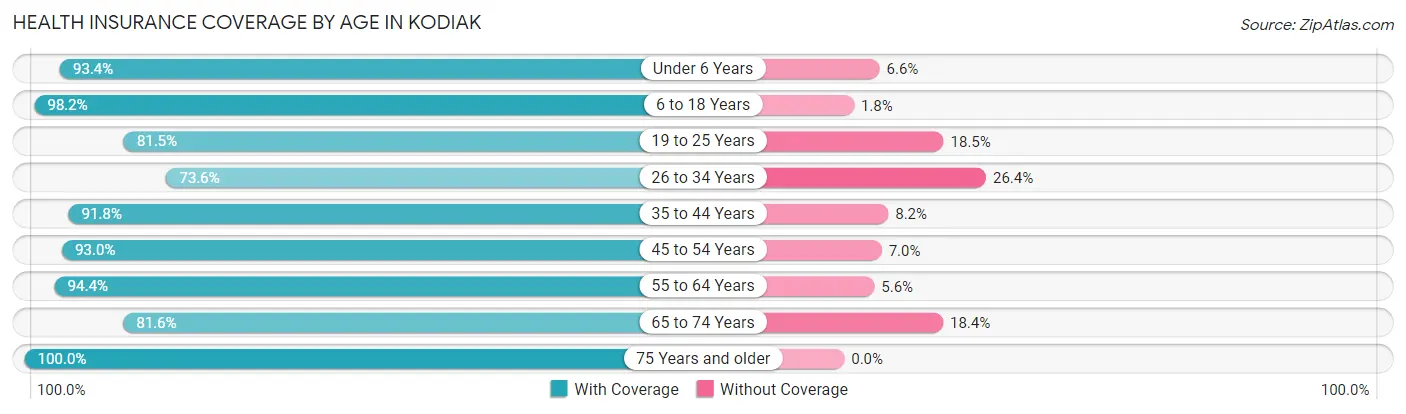
| Age Bracket | With Coverage | Without Coverage |
| Under 6 Years | 341 (93.4%) | 24 (6.6%) |
| 6 to 18 Years | 758 (98.2%) | 14 (1.8%) |
| 19 to 25 Years | 528 (81.5%) | 120 (18.5%) |
| 26 to 34 Years | 306 (73.6%) | 110 (26.4%) |
| 35 to 44 Years | 683 (91.8%) | 61 (8.2%) |
| 45 to 54 Years | 653 (93.0%) | 49 (7.0%) |
| 55 to 64 Years | 825 (94.4%) | 49 (5.6%) |
| 65 to 74 Years | 461 (81.6%) | 104 (18.4%) |
| 75 Years and older | 308 (100.0%) | 0 (0.0%) |
| Total | 4,863 (90.2%) | 531 (9.8%) |
Health Insurance Coverage by Citizenship Status in Kodiak
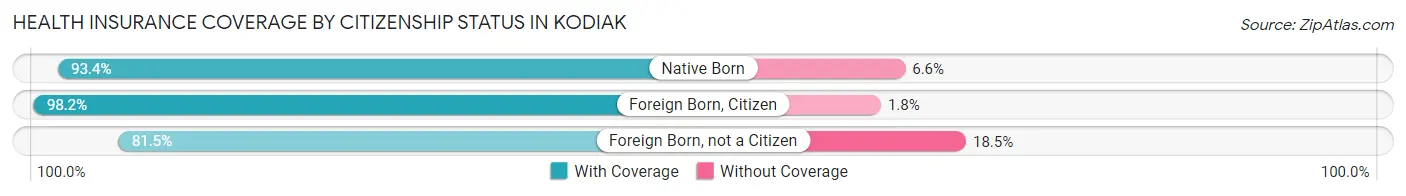
| Citizenship Status | With Coverage | Without Coverage |
| Native Born | 341 (93.4%) | 24 (6.6%) |
| Foreign Born, Citizen | 758 (98.2%) | 14 (1.8%) |
| Foreign Born, not a Citizen | 528 (81.5%) | 120 (18.5%) |
Health Insurance Coverage by Household Income in Kodiak
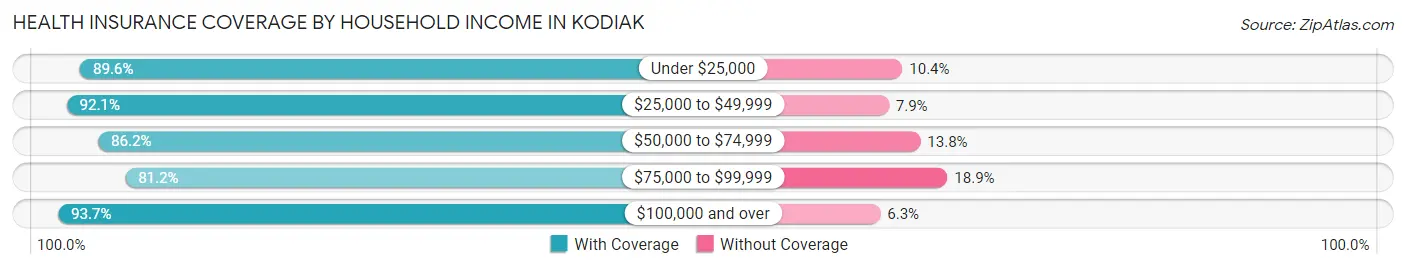
| Household Income | With Coverage | Without Coverage |
| Under $25,000 | 198 (89.6%) | 23 (10.4%) |
| $25,000 to $49,999 | 655 (92.1%) | 56 (7.9%) |
| $50,000 to $74,999 | 988 (86.2%) | 158 (13.8%) |
| $75,000 to $99,999 | 409 (81.1%) | 95 (18.9%) |
| $100,000 and over | 2,535 (93.7%) | 170 (6.3%) |
Public vs Private Health Insurance Coverage by Age in Kodiak
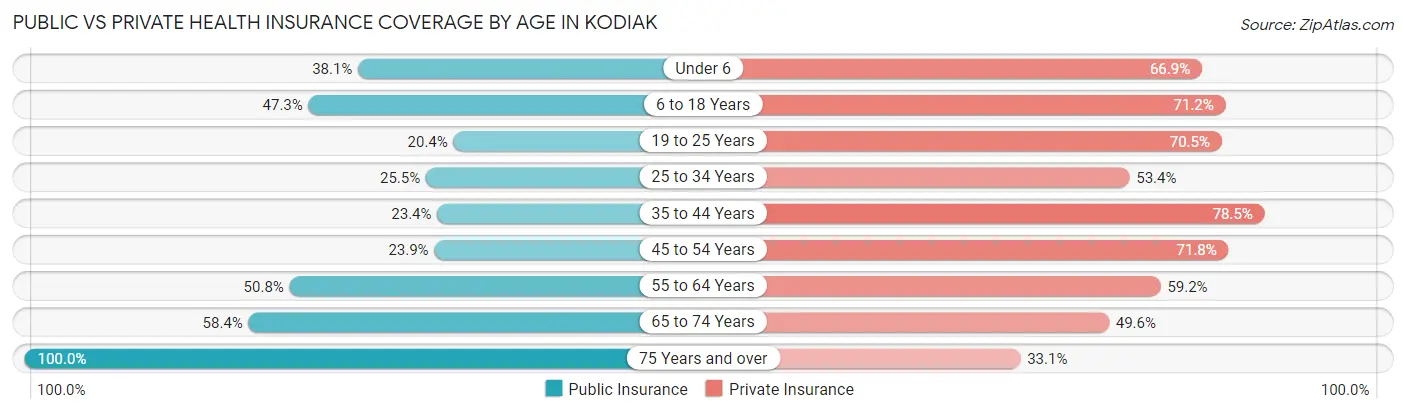
| Age Bracket | Public Insurance | Private Insurance |
| Under 6 | 139 (38.1%) | 244 (66.8%) |
| 6 to 18 Years | 365 (47.3%) | 550 (71.2%) |
| 19 to 25 Years | 132 (20.4%) | 457 (70.5%) |
| 25 to 34 Years | 106 (25.5%) | 222 (53.4%) |
| 35 to 44 Years | 174 (23.4%) | 584 (78.5%) |
| 45 to 54 Years | 168 (23.9%) | 504 (71.8%) |
| 55 to 64 Years | 444 (50.8%) | 517 (59.2%) |
| 65 to 74 Years | 330 (58.4%) | 280 (49.6%) |
| 75 Years and over | 308 (100.0%) | 102 (33.1%) |
| Total | 2,166 (40.2%) | 3,460 (64.1%) |
Disability Status by Sex by Age in Kodiak
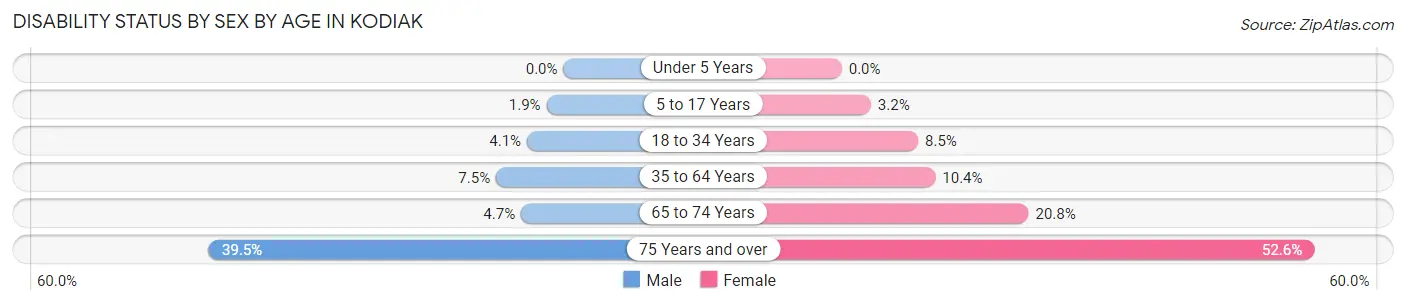
| Age Bracket | Male | Female |
| Under 5 Years | 0 (0.0%) | 0 (0.0%) |
| 5 to 17 Years | 9 (1.9%) | 11 (3.2%) |
| 18 to 34 Years | 24 (4.1%) | 46 (8.5%) |
| 35 to 64 Years | 92 (7.5%) | 114 (10.4%) |
| 65 to 74 Years | 16 (4.7%) | 47 (20.8%) |
| 75 Years and over | 30 (39.5%) | 122 (52.6%) |
Disability Class by Sex by Age in Kodiak
Disability Class: Hearing Difficulty
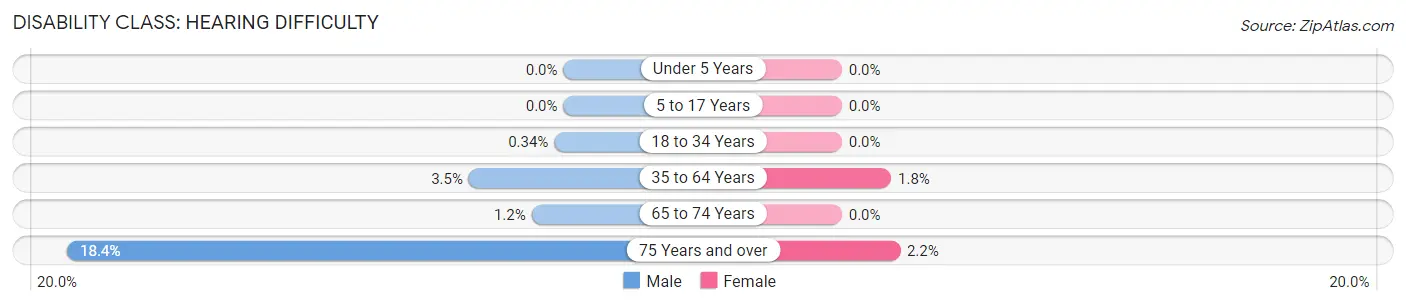
| Age Bracket | Male | Female |
| Under 5 Years | 0 (0.0%) | 0 (0.0%) |
| 5 to 17 Years | 0 (0.0%) | 0 (0.0%) |
| 18 to 34 Years | 2 (0.3%) | 0 (0.0%) |
| 35 to 64 Years | 43 (3.5%) | 20 (1.8%) |
| 65 to 74 Years | 4 (1.2%) | 0 (0.0%) |
| 75 Years and over | 14 (18.4%) | 5 (2.2%) |
Disability Class: Vision Difficulty
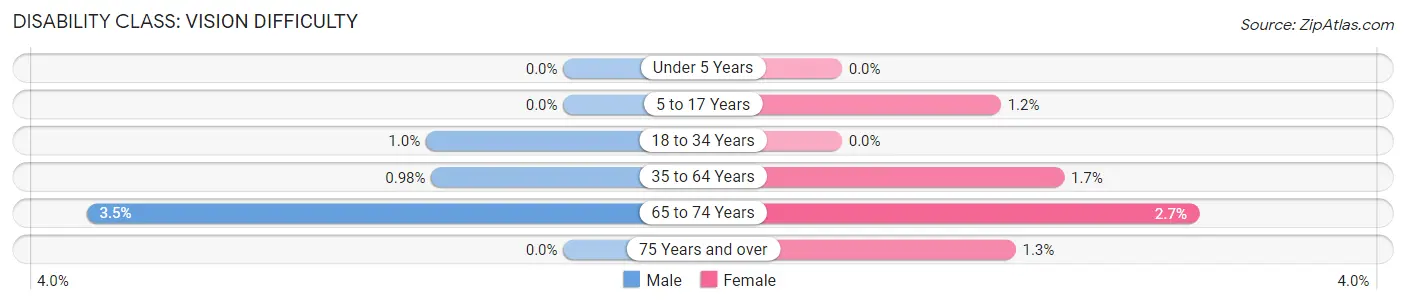
| Age Bracket | Male | Female |
| Under 5 Years | 0 (0.0%) | 0 (0.0%) |
| 5 to 17 Years | 0 (0.0%) | 4 (1.2%) |
| 18 to 34 Years | 6 (1.0%) | 0 (0.0%) |
| 35 to 64 Years | 12 (1.0%) | 18 (1.7%) |
| 65 to 74 Years | 12 (3.5%) | 6 (2.6%) |
| 75 Years and over | 0 (0.0%) | 3 (1.3%) |
Disability Class: Cognitive Difficulty
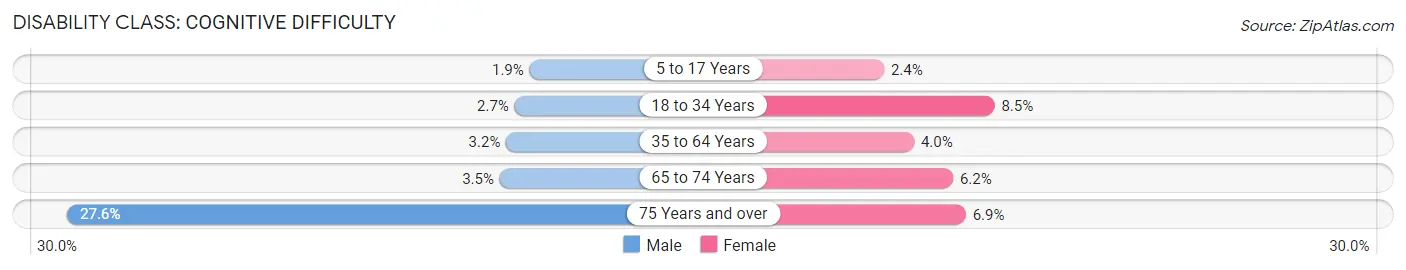
| Age Bracket | Male | Female |
| 5 to 17 Years | 9 (1.9%) | 8 (2.4%) |
| 18 to 34 Years | 16 (2.7%) | 46 (8.5%) |
| 35 to 64 Years | 39 (3.2%) | 44 (4.0%) |
| 65 to 74 Years | 12 (3.5%) | 14 (6.2%) |
| 75 Years and over | 21 (27.6%) | 16 (6.9%) |
Disability Class: Ambulatory Difficulty
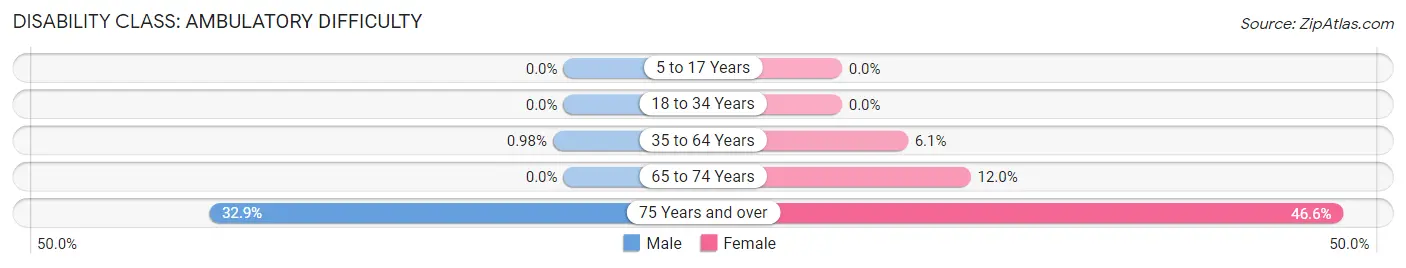
| Age Bracket | Male | Female |
| 5 to 17 Years | 0 (0.0%) | 0 (0.0%) |
| 18 to 34 Years | 0 (0.0%) | 0 (0.0%) |
| 35 to 64 Years | 12 (1.0%) | 67 (6.1%) |
| 65 to 74 Years | 0 (0.0%) | 27 (11.9%) |
| 75 Years and over | 25 (32.9%) | 108 (46.6%) |
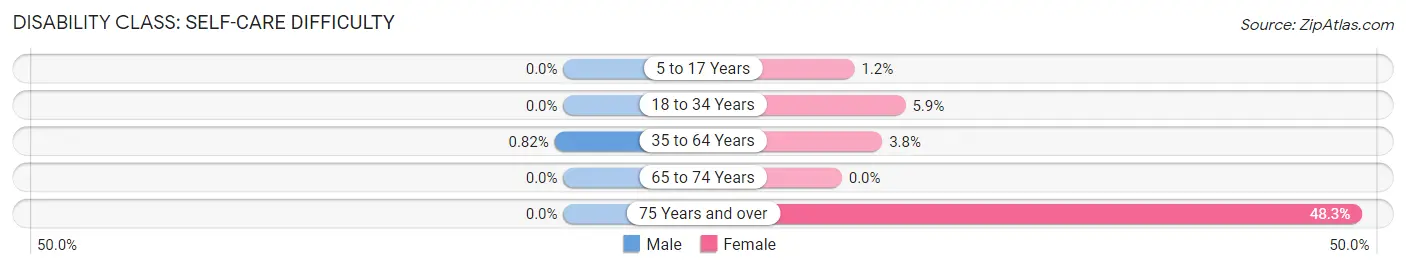
Disability Class: Self-Care Difficulty
| Age Bracket | Male | Female |
| 5 to 17 Years | 0 (0.0%) | 4 (1.2%) |
| 18 to 34 Years | 0 (0.0%) | 32 (5.9%) |
| 35 to 64 Years | 10 (0.8%) | 41 (3.7%) |
| 65 to 74 Years | 0 (0.0%) | 0 (0.0%) |
| 75 Years and over | 0 (0.0%) | 112 (48.3%) |
Technology Access in Kodiak
Computing Device Access in Kodiak
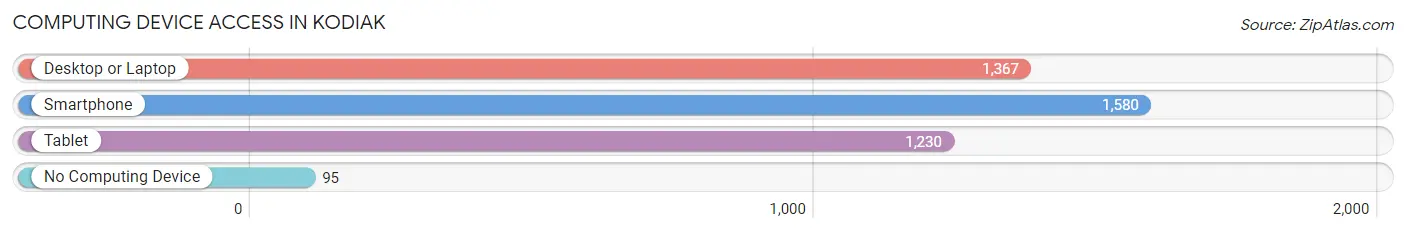
| Device Type | # Households | % Households |
| Desktop or Laptop | 1,367 | 77.3% |
| Smartphone | 1,580 | 89.4% |
| Tablet | 1,230 | 69.6% |
| No Computing Device | 95 | 5.4% |
| Total | 1,768 | 100.0% |
Internet Access in Kodiak
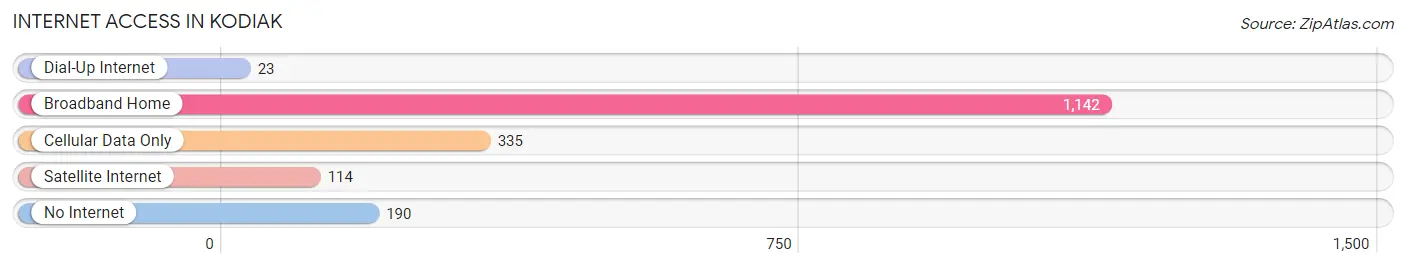
| Internet Type | # Households | % Households |
| Dial-Up Internet | 23 | 1.3% |
| Broadband Home | 1,142 | 64.6% |
| Cellular Data Only | 335 | 19.0% |
| Satellite Internet | 114 | 6.5% |
| No Internet | 190 | 10.7% |
| Total | 1,768 | 100.0% |
Kodiak Summary
Kodiak, Alaska is a city located on the eastern side of Kodiak Island in the Gulf of Alaska. It is the second largest city in the state of Alaska and the largest city on the island. Kodiak is known for its fishing industry, which is the largest in the state. The city is also home to a large military presence, with the U.S. Coast Guard and the Alaska National Guard both having bases in the area.
History
Kodiak has a long and rich history, dating back to the early 1700s when it was first inhabited by the Alutiiq people. The Alutiiq were a hunter-gatherer society that lived off the land and sea. They were known for their skill in fishing and hunting, and their culture was deeply rooted in the land and sea.
In 1784, the Russian-American Company established a trading post in the area, which was the first permanent European settlement in Alaska. The settlement was named Pavlovsk and was located on the island's northern shore. The settlement was used as a base for the fur trade and for the exploration of the region.
In 1867, the United States purchased Alaska from Russia, and the area around Kodiak became part of the Alaska Territory. In 1941, the U.S. Navy established a base on the island, which was used during World War II. After the war, the base was turned over to the U.S. Coast Guard, which still operates it today.
Geography
Kodiak is located on the eastern side of Kodiak Island in the Gulf of Alaska. The island is the second largest in the state, with an area of 3,588 square miles. The island is mountainous, with the highest peak being Mount Chiginagak at 4,716 feet. The island is also home to numerous glaciers, including the Kodiak Glacier, which is the largest in the state.
The city of Kodiak is located on the island's eastern shore, near the mouth of the Buskin River. The city is surrounded by mountains and is home to several bays and inlets. The city is also located near the Kodiak National Wildlife Refuge, which is home to a variety of wildlife, including brown bears, bald eagles, and sea otters.
Economy
Kodiak's economy is largely based on fishing and tourism. The fishing industry is the largest in the state, with the majority of the catch being salmon, halibut, and cod. The city is also home to several seafood processing plants, which process and package the catch for sale.
Tourism is also an important part of the economy, with visitors coming to the area to take advantage of the natural beauty and outdoor activities. The city is home to several parks and trails, as well as a variety of wildlife viewing opportunities.
Demographics
As of the 2010 census, the population of Kodiak was 6,130. The population is largely made up of Native Americans, with the majority being Alutiiq. The city also has a large military presence, with the U.S. Coast Guard and the Alaska National Guard both having bases in the area.
The median household income in Kodiak is $63,945, which is higher than the state average. The median home value is $219,400, which is also higher than the state average. The city has a high rate of homeownership, with over 70% of residents owning their own homes.
Kodiak is a diverse and vibrant city with a rich history and culture. The city is home to a thriving fishing industry, as well as a variety of outdoor activities and attractions. The city is also home to a large military presence, with the U.S. Coast Guard and the Alaska National Guard both having bases in the area. The city has a diverse population and a strong economy, making it an attractive place to live and work.
Common Questions
What is Per Capita Income in Kodiak?
Per Capita income in Kodiak is $36,227.
What is the Median Family Income in Kodiak?
Median Family Income in Kodiak is $95,739.
What is the Median Household income in Kodiak?
Median Household Income in Kodiak is $76,765.
What is Income or Wage Gap in Kodiak?
Income or Wage Gap in Kodiak is 23.4%.
Women in Kodiak earn 76.6 cents for every dollar earned by a man.
What is Family Income Deficit in Kodiak?
Family Income Deficit in Kodiak is $7,007.
Families that are below poverty line in Kodiak earn $7,007 less on average than the poverty threshold level.
What is Inequality or Gini Index in Kodiak?
Inequality or Gini Index in Kodiak is 0.44.
What is the Total Population of Kodiak?
Total Population of Kodiak is 5,584.
What is the Total Male Population of Kodiak?
Total Male Population of Kodiak is 2,976.
What is the Total Female Population of Kodiak?
Total Female Population of Kodiak is 2,608.
What is the Ratio of Males per 100 Females in Kodiak?
There are 114.11 Males per 100 Females in Kodiak.
What is the Ratio of Females per 100 Males in Kodiak?
There are 87.63 Females per 100 Males in Kodiak.
What is the Median Population Age in Kodiak?
Median Population Age in Kodiak is 41.1 Years.
What is the Average Family Size in Kodiak
Average Family Size in Kodiak is 3.9 People.
What is the Average Household Size in Kodiak
Average Household Size in Kodiak is 3.1 People.
How Large is the Labor Force in Kodiak?
There are 3,221 People in the Labor Forcein in Kodiak.
What is the Percentage of People in the Labor Force in Kodiak?
69.4% of People are in the Labor Force in Kodiak.
What is the Unemployment Rate in Kodiak?
Unemployment Rate in Kodiak is 4.8%.