Bethel, AK
Bethel Map
Bethel Overview
6,312
TOTAL POPULATION
3,434
MALE POPULATION
2,878
FEMALE POPULATION
119.32
MALES / 100 FEMALES
83.81
FEMALES / 100 MALES
30.8
MEDIAN AGE
3.8
AVG FAMILY SIZE
3.0
AVG HOUSEHOLD SIZE
$37,790
PER CAPITA INCOME
$110,897
AVG FAMILY INCOME
$100,852
AVG HOUSEHOLD INCOME
28.3%
WAGE / INCOME GAP [ % ]
71.7¢/ $1
WAGE / INCOME GAP [ $ ]
0.39
INEQUALITY / GINI INDEX
3,086
LABOR FORCE [ PEOPLE ]
67.5%
PERCENT IN LABOR FORCE
8.9%
UNEMPLOYMENT RATE
Bethel Zip Codes
Bethel Area Codes
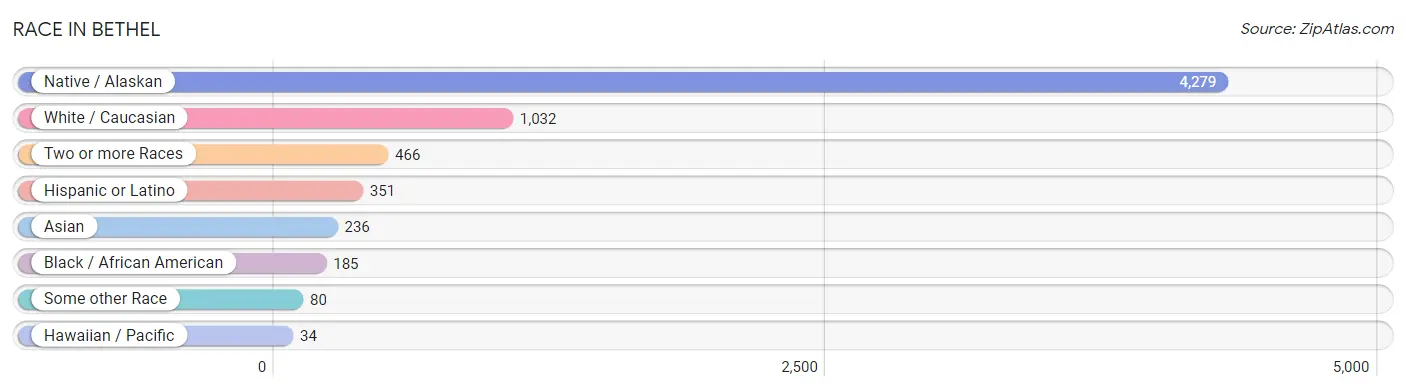
Race in Bethel
The most populous races in Bethel are Native / Alaskan (4,279 | 67.8%), White / Caucasian (1,032 | 16.4%), and Two or more Races (466 | 7.4%).
| Race | # Population | % Population |
| Asian | 236 | 3.7% |
| Black / African American | 185 | 2.9% |
| Hawaiian / Pacific | 34 | 0.5% |
| Hispanic or Latino | 351 | 5.6% |
| Native / Alaskan | 4,279 | 67.8% |
| White / Caucasian | 1,032 | 16.4% |
| Two or more Races | 466 | 7.4% |
| Some other Race | 80 | 1.3% |
| Total | 6,312 | 100.0% |
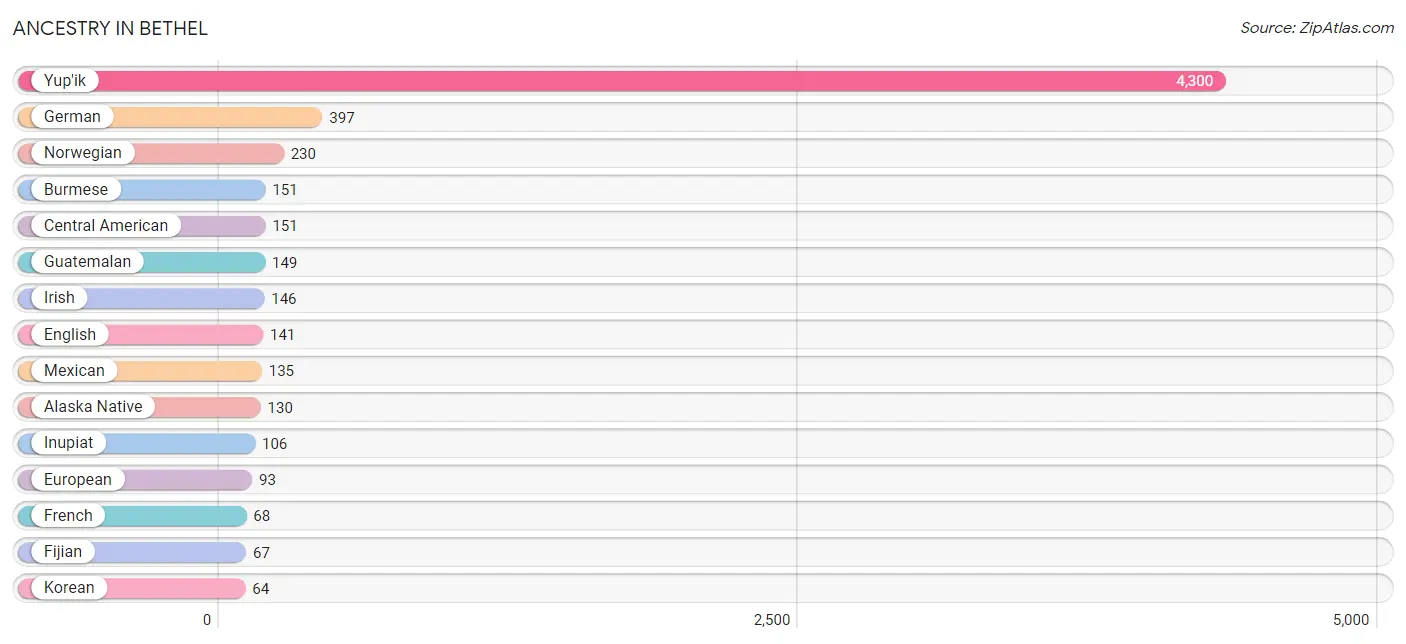
Ancestry in Bethel
The most populous ancestries reported in Bethel are Yup'ik (4,300 | 68.1%), German (397 | 6.3%), Norwegian (230 | 3.6%), Burmese (151 | 2.4%), and Central American (151 | 2.4%), together accounting for 82.8% of all Bethel residents.
| Ancestry | # Population | % Population |
| Alaska Native | 130 | 2.1% |
| Alaskan Athabascan | 42 | 0.7% |
| Albanian | 26 | 0.4% |
| Aleut | 2 | 0.0% |
| American | 46 | 0.7% |
| Armenian | 15 | 0.2% |
| Austrian | 4 | 0.1% |
| Bahamian | 9 | 0.1% |
| Bangladeshi | 4 | 0.1% |
| Belgian | 7 | 0.1% |
| British | 11 | 0.2% |
| Burmese | 151 | 2.4% |
| Central American | 151 | 2.4% |
| Cherokee | 40 | 0.6% |
| Czech | 9 | 0.1% |
| Danish | 20 | 0.3% |
| Dominican | 1 | 0.0% |
| Dutch | 27 | 0.4% |
| Eastern European | 2 | 0.0% |
| English | 141 | 2.2% |
| European | 93 | 1.5% |
| Fijian | 67 | 1.1% |
| Finnish | 36 | 0.6% |
| French | 68 | 1.1% |
| German | 397 | 6.3% |
| Guatemalan | 149 | 2.4% |
| Haitian | 40 | 0.6% |
| Indian (Asian) | 1 | 0.0% |
| Inupiat | 106 | 1.7% |
| Irish | 146 | 2.3% |
| Israeli | 6 | 0.1% |
| Italian | 30 | 0.5% |
| Jamaican | 22 | 0.4% |
| Korean | 64 | 1.0% |
| Mexican | 135 | 2.1% |
| Nicaraguan | 2 | 0.0% |
| Nigerian | 24 | 0.4% |
| Norwegian | 230 | 3.6% |
| Peruvian | 46 | 0.7% |
| Polish | 47 | 0.7% |
| Russian | 15 | 0.2% |
| Samoan | 34 | 0.5% |
| Scotch-Irish | 11 | 0.2% |
| Scottish | 11 | 0.2% |
| South American | 46 | 0.7% |
| Spanish | 18 | 0.3% |
| Subsaharan African | 50 | 0.8% |
| Swedish | 32 | 0.5% |
| Thai | 17 | 0.3% |
| Tlingit-Haida | 5 | 0.1% |
| Tongan | 14 | 0.2% |
| Yugoslavian | 11 | 0.2% |
| Yup'ik | 4,300 | 68.1% | View All 53 Rows |
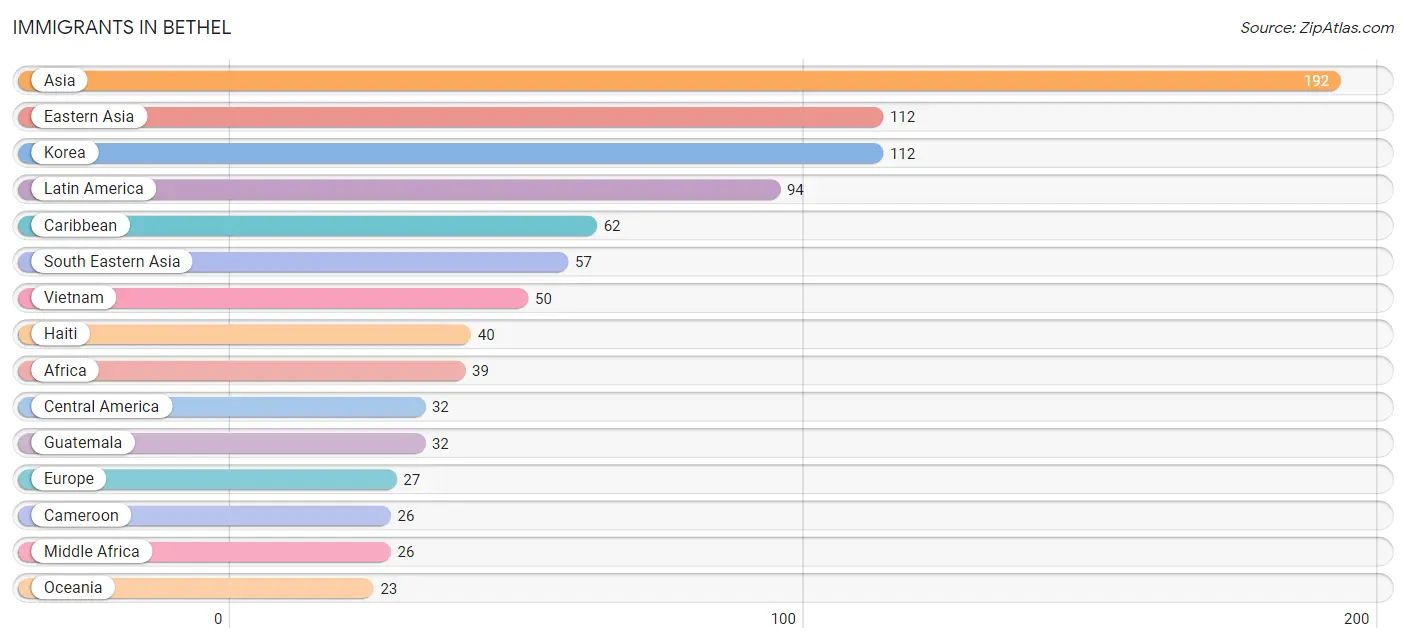
Immigrants in Bethel
The most numerous immigrant groups reported in Bethel came from Asia (192 | 3.0%), Eastern Asia (112 | 1.8%), Korea (112 | 1.8%), Latin America (94 | 1.5%), and Caribbean (62 | 1.0%), together accounting for 9.0% of all Bethel residents.
| Immigration Origin | # Population | % Population |
| Africa | 39 | 0.6% |
| Asia | 192 | 3.0% |
| Cameroon | 26 | 0.4% |
| Canada | 11 | 0.2% |
| Caribbean | 62 | 1.0% |
| Central America | 32 | 0.5% |
| Eastern Asia | 112 | 1.8% |
| Eastern Europe | 22 | 0.4% |
| Europe | 27 | 0.4% |
| Germany | 5 | 0.1% |
| Guatemala | 32 | 0.5% |
| Haiti | 40 | 0.6% |
| India | 17 | 0.3% |
| Israel | 6 | 0.1% |
| Jamaica | 22 | 0.4% |
| Korea | 112 | 1.8% |
| Latin America | 94 | 1.5% |
| Middle Africa | 26 | 0.4% |
| Nigeria | 13 | 0.2% |
| North Macedonia | 7 | 0.1% |
| Oceania | 23 | 0.4% |
| Philippines | 7 | 0.1% |
| Poland | 15 | 0.2% |
| South Central Asia | 17 | 0.3% |
| South Eastern Asia | 57 | 0.9% |
| Vietnam | 50 | 0.8% |
| Western Africa | 13 | 0.2% |
| Western Asia | 6 | 0.1% |
| Western Europe | 5 | 0.1% | View All 29 Rows |
Sex and Age in Bethel
Sex and Age in Bethel
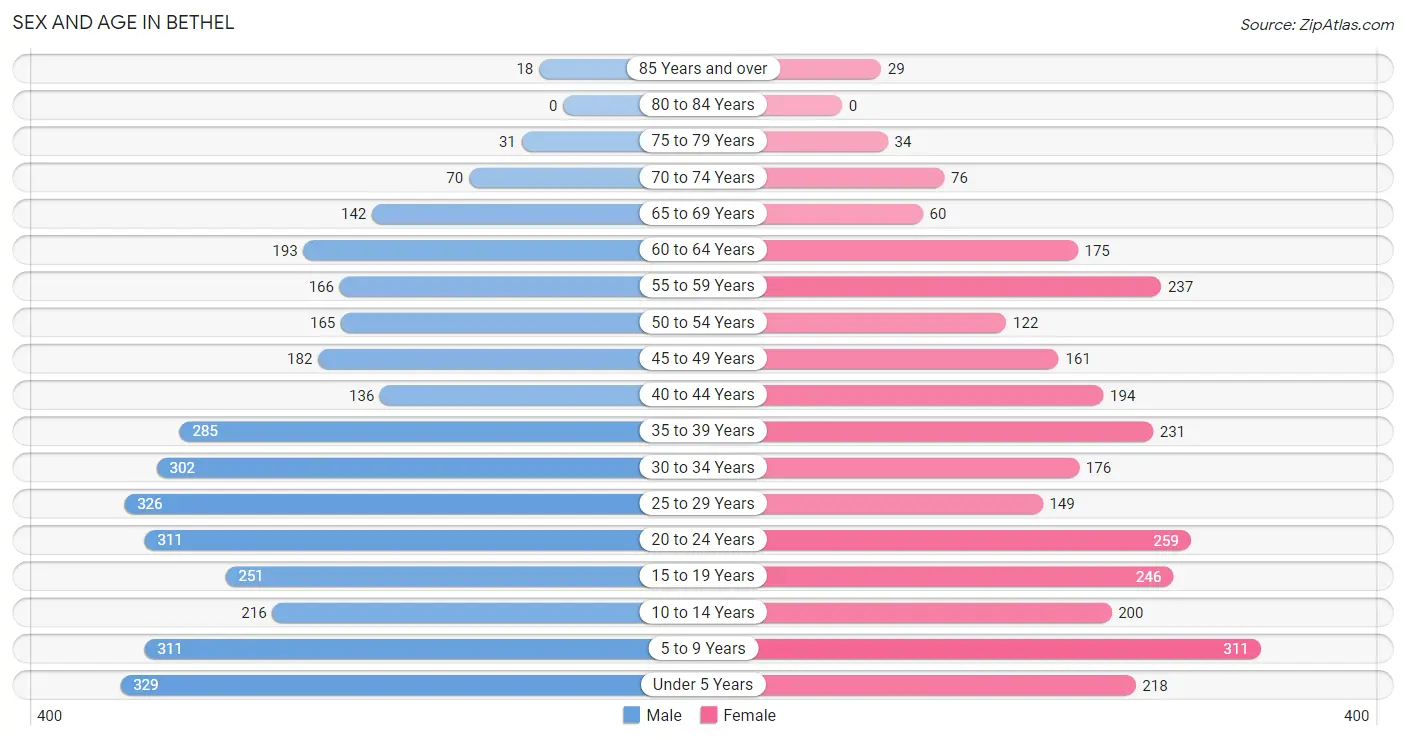
The most populous age groups in Bethel are Under 5 Years (329 | 9.6%) for men and 5 to 9 Years (311 | 10.8%) for women.
| Age Bracket | Male | Female |
| Under 5 Years | 329 (9.6%) | 218 (7.6%) |
| 5 to 9 Years | 311 (9.1%) | 311 (10.8%) |
| 10 to 14 Years | 216 (6.3%) | 200 (7.0%) |
| 15 to 19 Years | 251 (7.3%) | 246 (8.6%) |
| 20 to 24 Years | 311 (9.1%) | 259 (9.0%) |
| 25 to 29 Years | 326 (9.5%) | 149 (5.2%) |
| 30 to 34 Years | 302 (8.8%) | 176 (6.1%) |
| 35 to 39 Years | 285 (8.3%) | 231 (8.0%) |
| 40 to 44 Years | 136 (4.0%) | 194 (6.7%) |
| 45 to 49 Years | 182 (5.3%) | 161 (5.6%) |
| 50 to 54 Years | 165 (4.8%) | 122 (4.2%) |
| 55 to 59 Years | 166 (4.8%) | 237 (8.2%) |
| 60 to 64 Years | 193 (5.6%) | 175 (6.1%) |
| 65 to 69 Years | 142 (4.1%) | 60 (2.1%) |
| 70 to 74 Years | 70 (2.0%) | 76 (2.6%) |
| 75 to 79 Years | 31 (0.9%) | 34 (1.2%) |
| 80 to 84 Years | 0 (0.0%) | 0 (0.0%) |
| 85 Years and over | 18 (0.5%) | 29 (1.0%) |
| Total | 3,434 (100.0%) | 2,878 (100.0%) |
Families and Households in Bethel
Median Family Size in Bethel
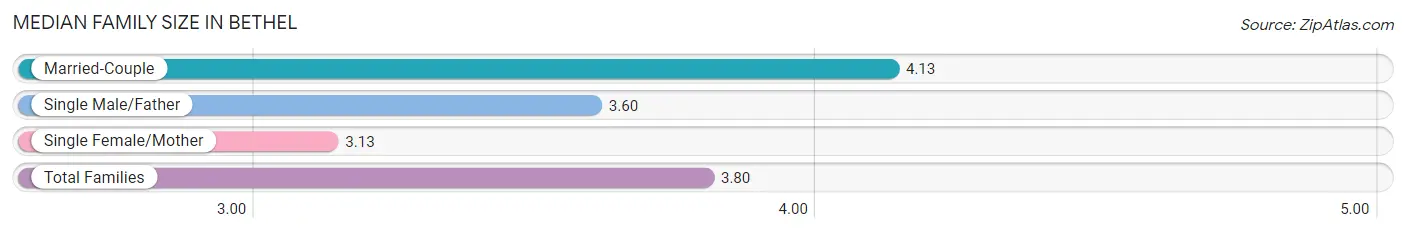
The median family size in Bethel is 3.80 persons per family, with married-couple families (798 | 62.9%) accounting for the largest median family size of 4.13 persons per family. On the other hand, single female/mother families (346 | 27.3%) represent the smallest median family size with 3.13 persons per family.
| Family Type | # Families | Family Size |
| Married-Couple | 798 (62.9%) | 4.13 |
| Single Male/Father | 124 (9.8%) | 3.60 |
| Single Female/Mother | 346 (27.3%) | 3.13 |
| Total Families | 1,268 (100.0%) | 3.80 |
Median Household Size in Bethel
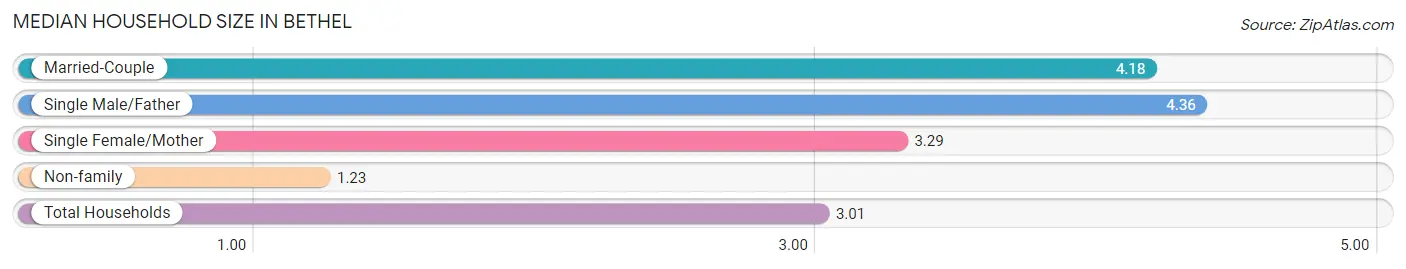
The median household size in Bethel is 3.01 persons per household, with single male/father households (124 | 6.4%) accounting for the largest median household size of 4.36 persons per household. non-family households (669 | 34.5%) represent the smallest median household size with 1.23 persons per household.
| Household Type | # Households | Household Size |
| Married-Couple | 798 (41.2%) | 4.18 |
| Single Male/Father | 124 (6.4%) | 4.36 |
| Single Female/Mother | 346 (17.9%) | 3.29 |
| Non-family | 669 (34.5%) | 1.23 |
| Total Households | 1,937 (100.0%) | 3.01 |
Household Size by Marriage Status in Bethel
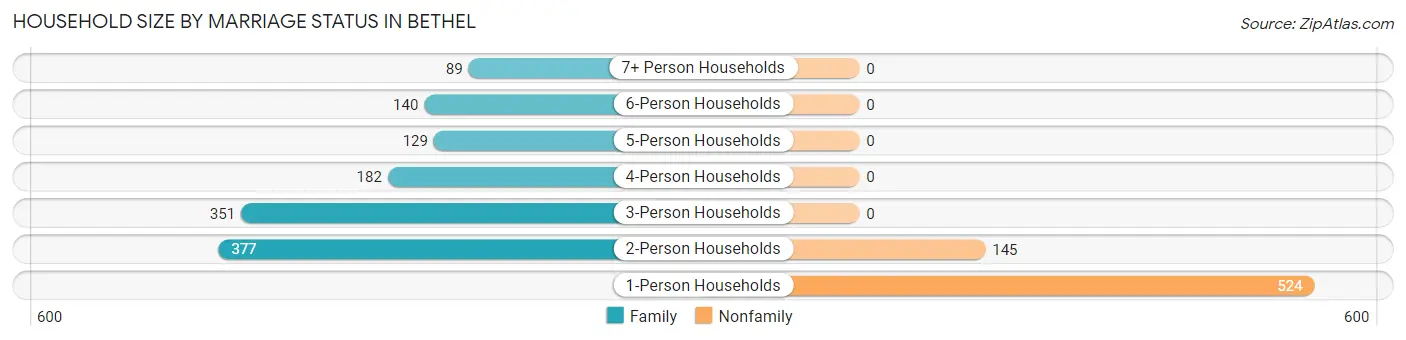
Out of a total of 1,937 households in Bethel, 1,268 (65.5%) are family households, while 669 (34.5%) are nonfamily households. The most numerous type of family households are 2-person households, comprising 377, and the most common type of nonfamily households are 1-person households, comprising 524.
| Household Size | Family Households | Nonfamily Households |
| 1-Person Households | - | 524 (27.1%) |
| 2-Person Households | 377 (19.5%) | 145 (7.5%) |
| 3-Person Households | 351 (18.1%) | 0 (0.0%) |
| 4-Person Households | 182 (9.4%) | 0 (0.0%) |
| 5-Person Households | 129 (6.7%) | 0 (0.0%) |
| 6-Person Households | 140 (7.2%) | 0 (0.0%) |
| 7+ Person Households | 89 (4.6%) | 0 (0.0%) |
| Total | 1,268 (65.5%) | 669 (34.5%) |
Female Fertility in Bethel
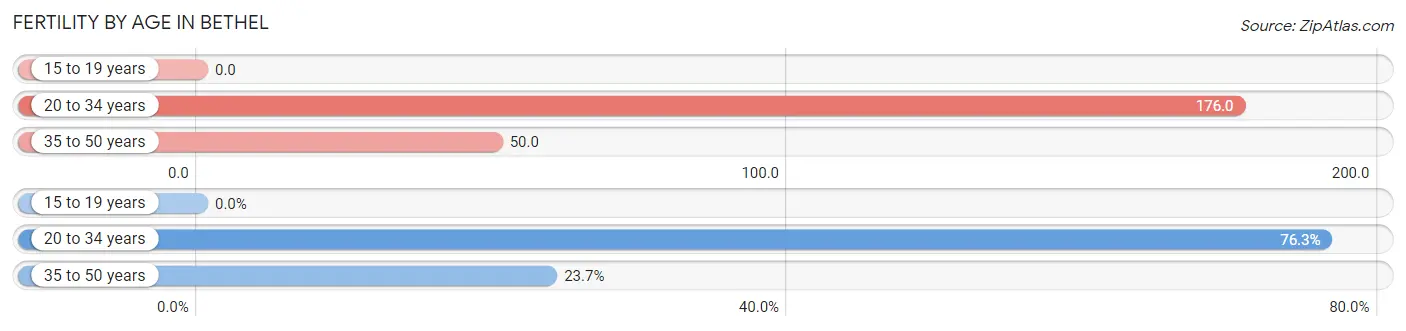
Fertility by Age in Bethel
Average fertility rate in Bethel is 92.0 births per 1,000 women. Women in the age bracket of 20 to 34 years have the highest fertility rate with 176.0 births per 1,000 women. Women in the age bracket of 20 to 34 years acount for 76.3% of all women with births.
| Age Bracket | Women with Births | Births / 1,000 Women |
| 15 to 19 years | 0 (0.0%) | 0.0 |
| 20 to 34 years | 103 (76.3%) | 176.0 |
| 35 to 50 years | 32 (23.7%) | 50.0 |
| Total | 135 (100.0%) | 92.0 |
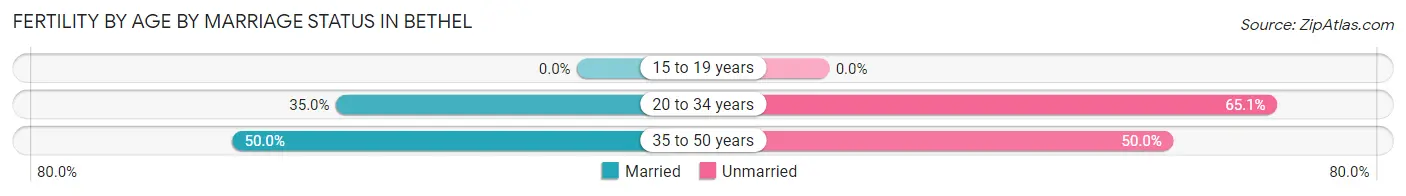
Fertility by Age by Marriage Status in Bethel
38.5% of women with births (135) in Bethel are married. The highest percentage of unmarried women with births falls into 20 to 34 years age bracket with 65.0% of them unmarried at the time of birth, while the lowest percentage of unmarried women with births belong to 35 to 50 years age bracket with 50.0% of them unmarried.
| Age Bracket | Married | Unmarried |
| 15 to 19 years | 0 (0.0%) | 0 (0.0%) |
| 20 to 34 years | 36 (34.9%) | 67 (65.0%) |
| 35 to 50 years | 16 (50.0%) | 16 (50.0%) |
| Total | 52 (38.5%) | 83 (61.5%) |
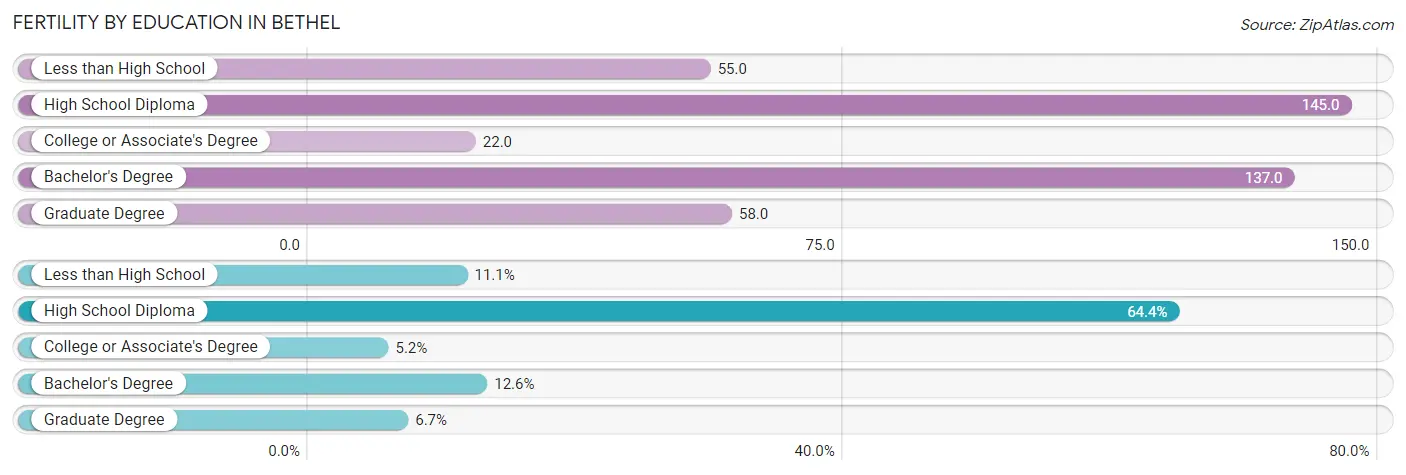
Fertility by Education in Bethel
Average fertility rate in Bethel is 92.0 births per 1,000 women. Women with the education attainment of high school diploma have the highest fertility rate of 145.0 births per 1,000 women, while women with the education attainment of college or associate's degree have the lowest fertility at 22.0 births per 1,000 women. Women with the education attainment of high school diploma represent 64.4% of all women with births.
| Educational Attainment | Women with Births | Births / 1,000 Women |
| Less than High School | 15 (11.1%) | 55.0 |
| High School Diploma | 87 (64.4%) | 145.0 |
| College or Associate's Degree | 7 (5.2%) | 22.0 |
| Bachelor's Degree | 17 (12.6%) | 137.0 |
| Graduate Degree | 9 (6.7%) | 58.0 |
| Total | 135 (100.0%) | 92.0 |
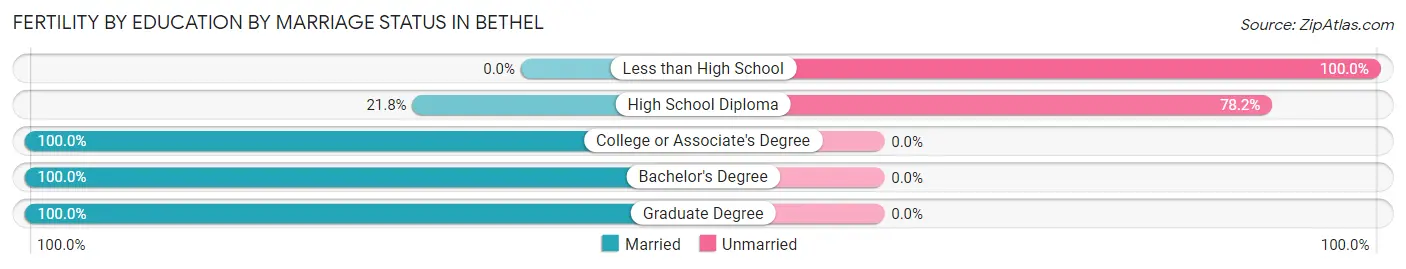
Fertility by Education by Marriage Status in Bethel
61.5% of women with births in Bethel are unmarried. Women with the educational attainment of college or associate's degree are most likely to be married with 100.0% of them married at childbirth, while women with the educational attainment of less than high school are least likely to be married with 100.0% of them unmarried at childbirth.
| Educational Attainment | Married | Unmarried |
| Less than High School | 0 (0.0%) | 15 (100.0%) |
| High School Diploma | 19 (21.8%) | 68 (78.2%) |
| College or Associate's Degree | 7 (100.0%) | 0 (0.0%) |
| Bachelor's Degree | 17 (100.0%) | 0 (0.0%) |
| Graduate Degree | 9 (100.0%) | 0 (0.0%) |
| Total | 52 (38.5%) | 83 (61.5%) |
Income in Bethel
Income Overview in Bethel
Per Capita Income in Bethel is $37,790, while median incomes of families and households are $110,897 and $100,852 respectively.
| Characteristic | Number | Measure |
| Per Capita Income | 6,312 | $37,790 |
| Median Family Income | 1,268 | $110,897 |
| Mean Family Income | 1,268 | $127,876 |
| Median Household Income | 1,937 | $100,852 |
| Mean Household Income | 1,937 | $118,182 |
| Income Deficit | 1,268 | $0 |
| Wage / Income Gap (%) | 6,312 | 28.29% |
| Wage / Income Gap ($) | 6,312 | 71.71¢ per $1 |
| Gini / Inequality Index | 6,312 | 0.39 |
Earnings by Sex in Bethel
Average Earnings in Bethel are $46,907, $53,750 for men and $38,542 for women, a difference of 28.3%.
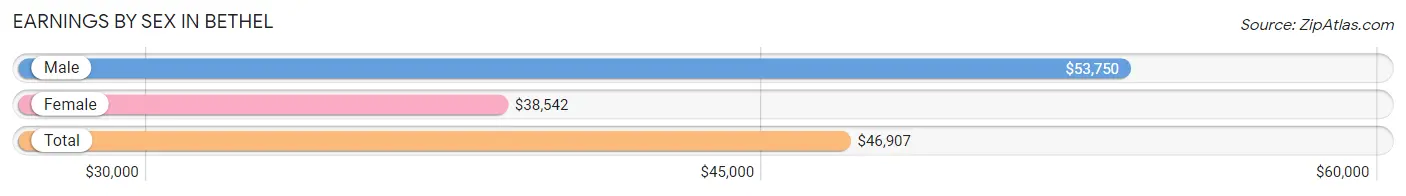
| Sex | Number | Average Earnings |
| Male | 1,930 (56.9%) | $53,750 |
| Female | 1,463 (43.1%) | $38,542 |
| Total | 3,393 (100.0%) | $46,907 |
Earnings by Sex by Income Bracket in Bethel
The most common earnings brackets in Bethel are $100,000+ for men (453 | 23.5%) and $100,000+ for women (231 | 15.8%).
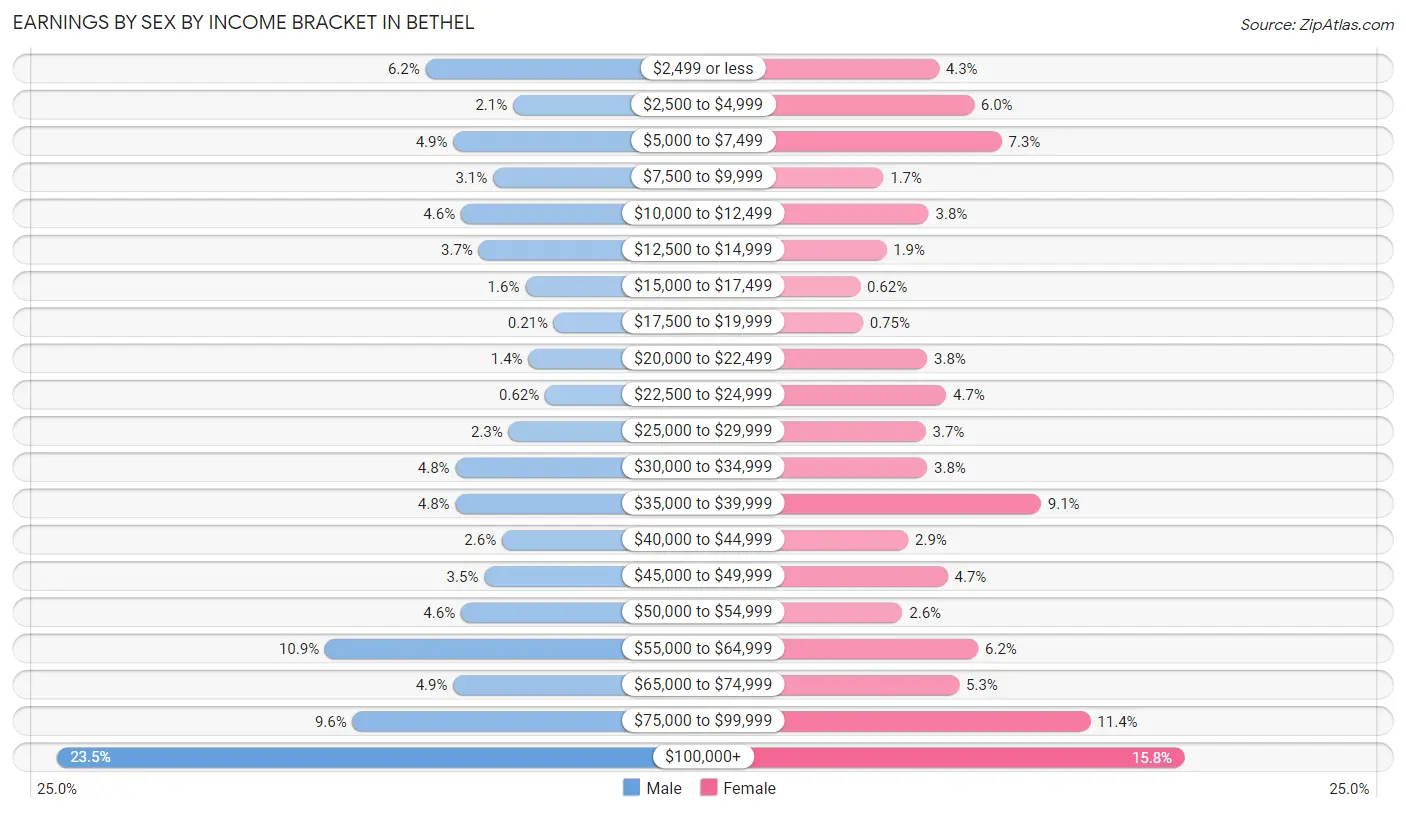
| Income | Male | Female |
| $2,499 or less | 120 (6.2%) | 63 (4.3%) |
| $2,500 to $4,999 | 41 (2.1%) | 87 (5.9%) |
| $5,000 to $7,499 | 95 (4.9%) | 106 (7.2%) |
| $7,500 to $9,999 | 59 (3.1%) | 25 (1.7%) |
| $10,000 to $12,499 | 88 (4.6%) | 56 (3.8%) |
| $12,500 to $14,999 | 72 (3.7%) | 27 (1.8%) |
| $15,000 to $17,499 | 30 (1.5%) | 9 (0.6%) |
| $17,500 to $19,999 | 4 (0.2%) | 11 (0.7%) |
| $20,000 to $22,499 | 27 (1.4%) | 55 (3.8%) |
| $22,500 to $24,999 | 12 (0.6%) | 68 (4.6%) |
| $25,000 to $29,999 | 45 (2.3%) | 54 (3.7%) |
| $30,000 to $34,999 | 93 (4.8%) | 55 (3.8%) |
| $35,000 to $39,999 | 93 (4.8%) | 133 (9.1%) |
| $40,000 to $44,999 | 51 (2.6%) | 42 (2.9%) |
| $45,000 to $49,999 | 67 (3.5%) | 69 (4.7%) |
| $50,000 to $54,999 | 88 (4.6%) | 38 (2.6%) |
| $55,000 to $64,999 | 211 (10.9%) | 90 (6.1%) |
| $65,000 to $74,999 | 95 (4.9%) | 77 (5.3%) |
| $75,000 to $99,999 | 186 (9.6%) | 167 (11.4%) |
| $100,000+ | 453 (23.5%) | 231 (15.8%) |
| Total | 1,930 (100.0%) | 1,463 (100.0%) |
Earnings by Sex by Educational Attainment in Bethel
Average earnings in Bethel are $61,511 for men and $52,614 for women, a difference of 14.5%. Men with an educational attainment of graduate degree enjoy the highest average annual earnings of $107,159, while those with high school diploma education earn the least with $55,313. Women with an educational attainment of graduate degree earn the most with the average annual earnings of $96,429, while those with high school diploma education have the smallest earnings of $37,667.
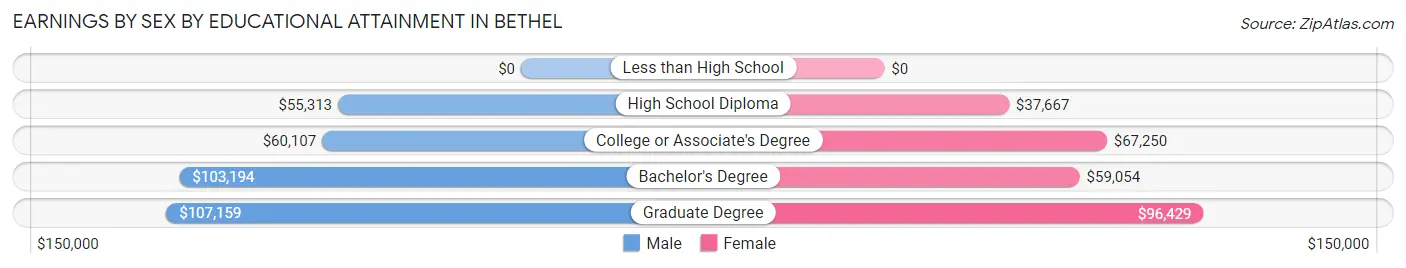
| Educational Attainment | Male Income | Female Income |
| Less than High School | - | - |
| High School Diploma | $55,313 | $37,667 |
| College or Associate's Degree | $60,107 | $67,250 |
| Bachelor's Degree | $103,194 | $59,054 |
| Graduate Degree | $107,159 | $96,429 |
| Total | $61,511 | $52,614 |
Family Income in Bethel
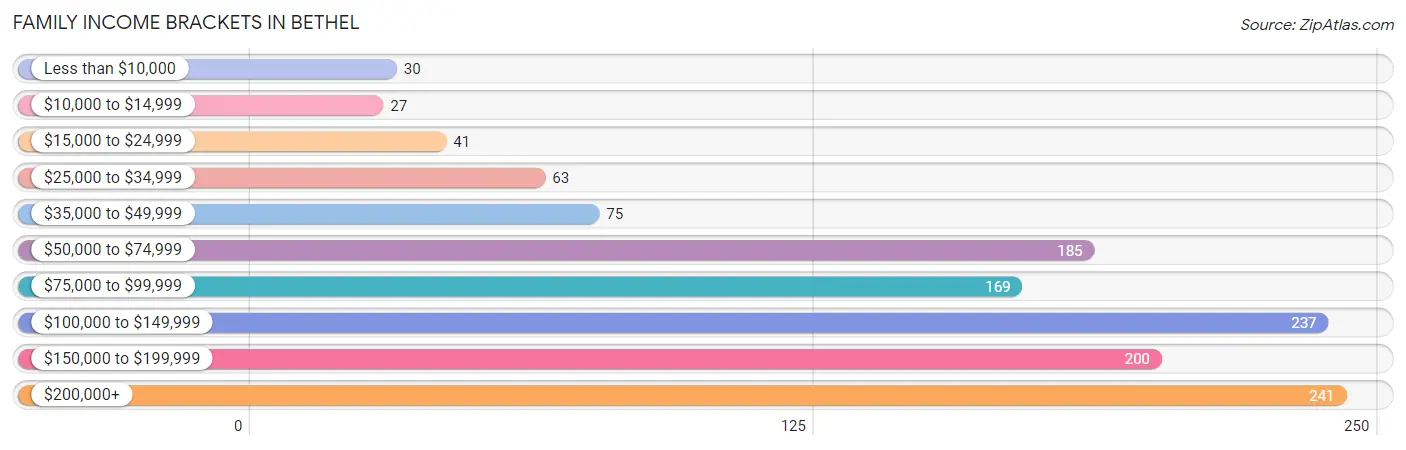
Family Income Brackets in Bethel
According to the Bethel family income data, there are 241 families falling into the $200,000+ income range, which is the most common income bracket and makes up 19.0% of all families. Conversely, the $10,000 to $14,999 income bracket is the least frequent group with only 27 families (2.1%) belonging to this category.
| Income Bracket | # Families | % Families |
| Less than $10,000 | 30 | 2.4% |
| $10,000 to $14,999 | 27 | 2.1% |
| $15,000 to $24,999 | 41 | 3.2% |
| $25,000 to $34,999 | 63 | 5.0% |
| $35,000 to $49,999 | 75 | 5.9% |
| $50,000 to $74,999 | 185 | 14.6% |
| $75,000 to $99,999 | 169 | 13.3% |
| $100,000 to $149,999 | 237 | 18.7% |
| $150,000 to $199,999 | 200 | 15.8% |
| $200,000+ | 241 | 19.0% |
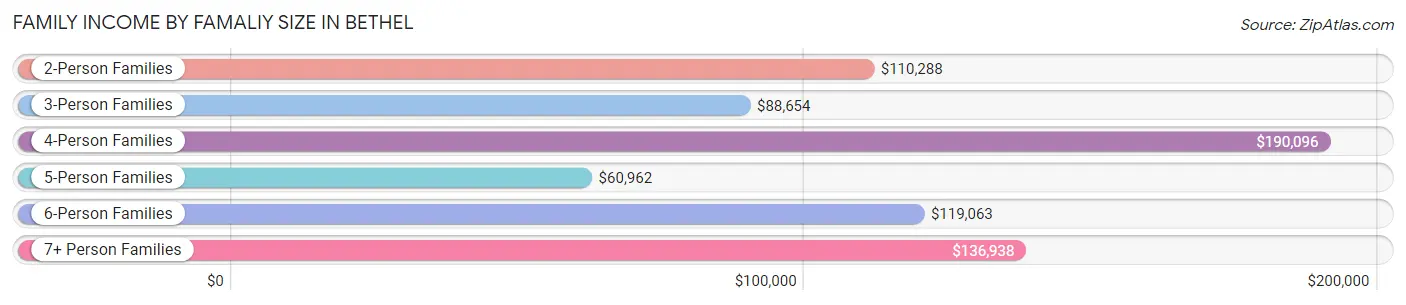
Family Income by Famaliy Size in Bethel
4-person families (171 | 13.5%) account for the highest median family income in Bethel with $190,096 per family, while 2-person families (459 | 36.2%) have the highest median income of $55,144 per family member.
| Income Bracket | # Families | Median Income |
| 2-Person Families | 459 (36.2%) | $110,288 |
| 3-Person Families | 280 (22.1%) | $88,654 |
| 4-Person Families | 171 (13.5%) | $190,096 |
| 5-Person Families | 174 (13.7%) | $60,962 |
| 6-Person Families | 123 (9.7%) | $119,063 |
| 7+ Person Families | 61 (4.8%) | $136,938 |
| Total | 1,268 (100.0%) | $110,897 |
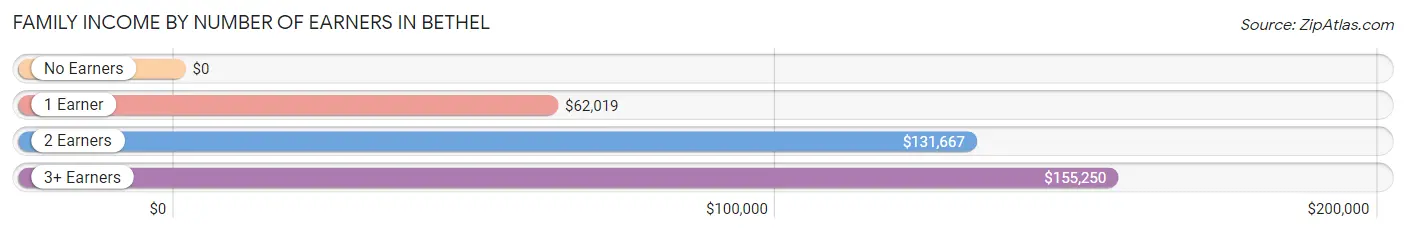
Family Income by Number of Earners in Bethel
| Number of Earners | # Families | Median Income |
| No Earners | 106 (8.4%) | $0 |
| 1 Earner | 255 (20.1%) | $62,019 |
| 2 Earners | 754 (59.5%) | $131,667 |
| 3+ Earners | 153 (12.1%) | $155,250 |
| Total | 1,268 (100.0%) | $110,897 |
Household Income in Bethel
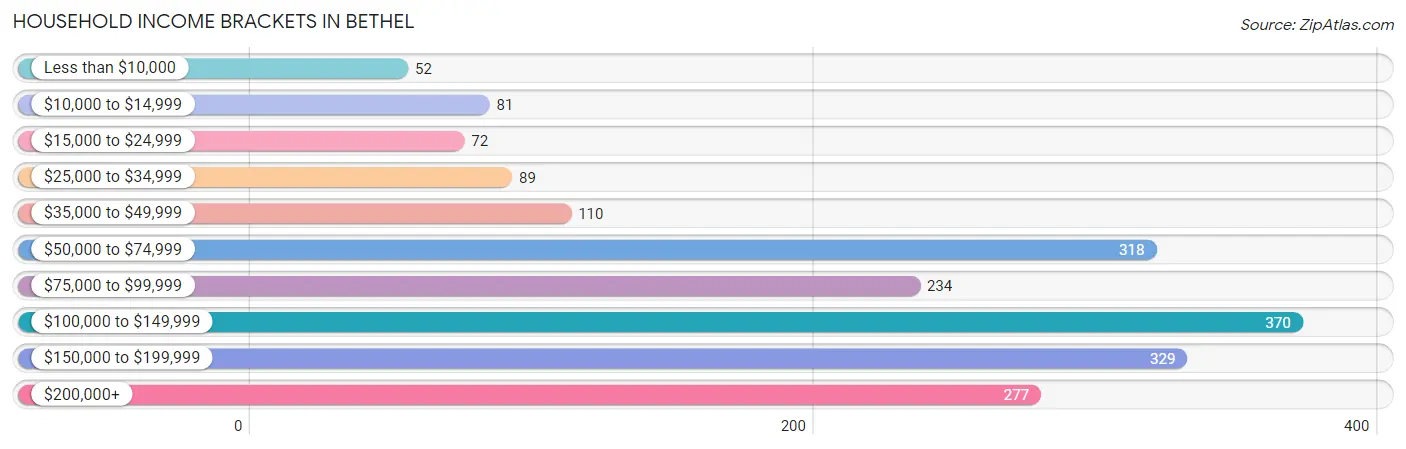
Household Income Brackets in Bethel
With 370 households falling in the category, the $100,000 to $149,999 income range is the most frequent in Bethel, accounting for 19.1% of all households. In contrast, only 52 households (2.7%) fall into the less than $10,000 income bracket, making it the least populous group.
| Income Bracket | # Households | % Households |
| Less than $10,000 | 52 | 2.7% |
| $10,000 to $14,999 | 81 | 4.2% |
| $15,000 to $24,999 | 72 | 3.7% |
| $25,000 to $34,999 | 89 | 4.6% |
| $35,000 to $49,999 | 110 | 5.7% |
| $50,000 to $74,999 | 318 | 16.4% |
| $75,000 to $99,999 | 234 | 12.1% |
| $100,000 to $149,999 | 370 | 19.1% |
| $150,000 to $199,999 | 329 | 17.0% |
| $200,000+ | 277 | 14.3% |
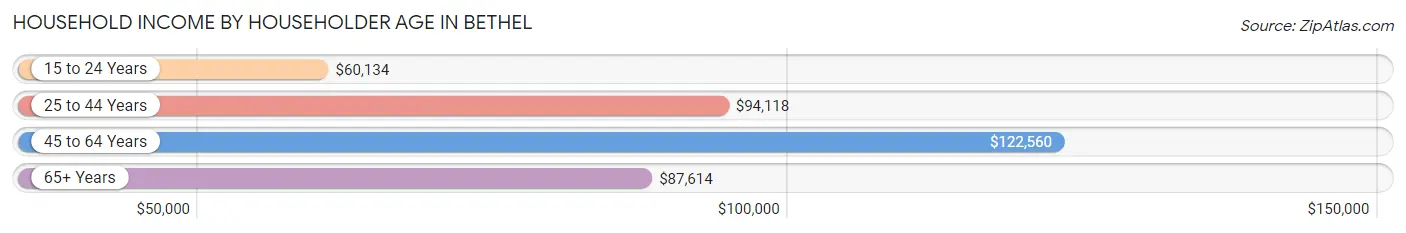
Household Income by Householder Age in Bethel
The median household income in Bethel is $100,852, with the highest median household income of $122,560 found in the 45 to 64 years age bracket for the primary householder. A total of 749 households (38.7%) fall into this category. Meanwhile, the 15 to 24 years age bracket for the primary householder has the lowest median household income of $60,134, with 133 households (6.9%) in this group.
| Income Bracket | # Households | Median Income |
| 15 to 24 Years | 133 (6.9%) | $60,134 |
| 25 to 44 Years | 766 (39.6%) | $94,118 |
| 45 to 64 Years | 749 (38.7%) | $122,560 |
| 65+ Years | 289 (14.9%) | $87,614 |
| Total | 1,937 (100.0%) | $100,852 |
Poverty in Bethel
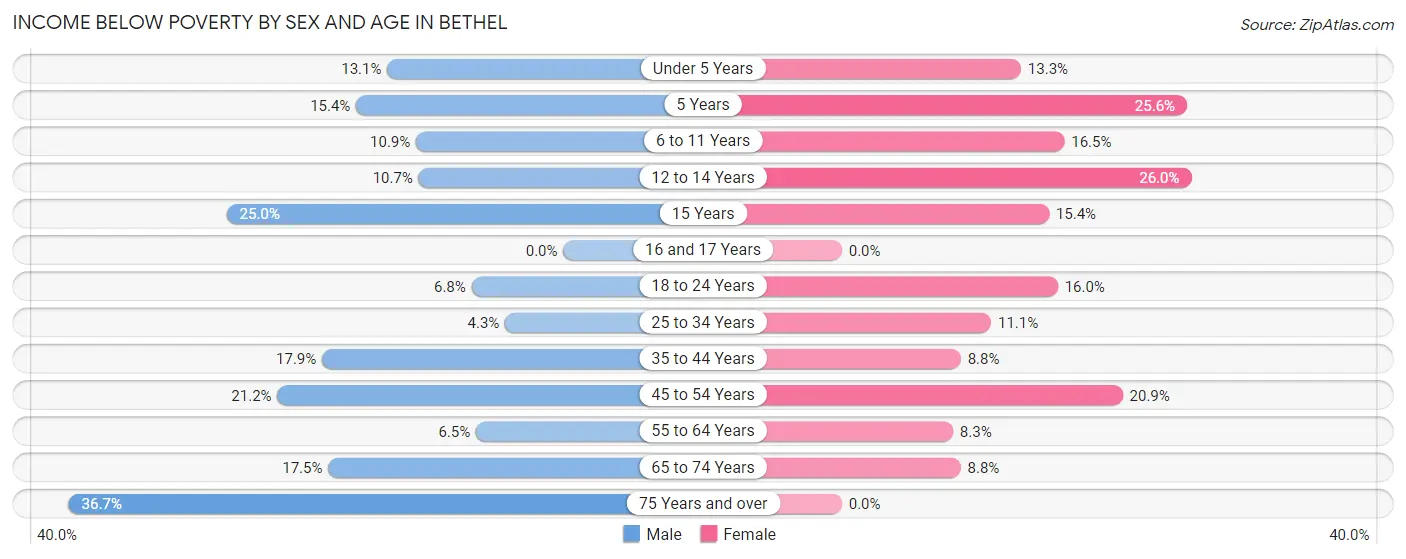
Income Below Poverty by Sex and Age in Bethel
With 11.9% poverty level for males and 13.4% for females among the residents of Bethel, 75 year old and over males and 12 to 14 year old females are the most vulnerable to poverty, with 18 males (36.7%) and 34 females (26.0%) in their respective age groups living below the poverty level.
| Age Bracket | Male | Female |
| Under 5 Years | 43 (13.1%) | 29 (13.3%) |
| 5 Years | 12 (15.4%) | 31 (25.6%) |
| 6 to 11 Years | 33 (10.9%) | 38 (16.5%) |
| 12 to 14 Years | 13 (10.7%) | 34 (26.0%) |
| 15 Years | 15 (25.0%) | 14 (15.4%) |
| 16 and 17 Years | 0 (0.0%) | 0 (0.0%) |
| 18 to 24 Years | 25 (6.8%) | 55 (16.0%) |
| 25 to 34 Years | 23 (4.3%) | 36 (11.1%) |
| 35 to 44 Years | 67 (17.9%) | 37 (8.8%) |
| 45 to 54 Years | 69 (21.2%) | 59 (20.8%) |
| 55 to 64 Years | 21 (6.5%) | 34 (8.3%) |
| 65 to 74 Years | 37 (17.4%) | 12 (8.8%) |
| 75 Years and over | 18 (36.7%) | 0 (0.0%) |
| Total | 376 (11.9%) | 379 (13.4%) |
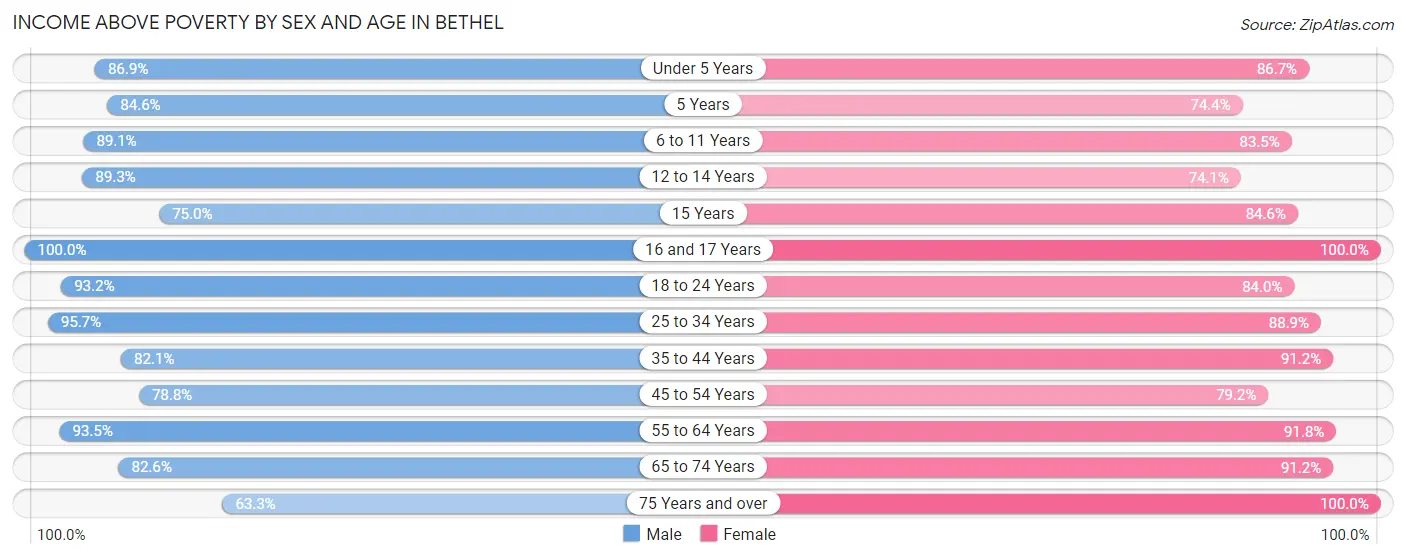
Income Above Poverty by Sex and Age in Bethel
According to the poverty statistics in Bethel, males aged 16 and 17 years and females aged 16 and 17 years are the age groups that are most secure financially, with 100.0% of males and 100.0% of females in these age groups living above the poverty line.
| Age Bracket | Male | Female |
| Under 5 Years | 286 (86.9%) | 189 (86.7%) |
| 5 Years | 66 (84.6%) | 90 (74.4%) |
| 6 to 11 Years | 269 (89.1%) | 192 (83.5%) |
| 12 to 14 Years | 108 (89.3%) | 97 (74.1%) |
| 15 Years | 45 (75.0%) | 77 (84.6%) |
| 16 and 17 Years | 73 (100.0%) | 59 (100.0%) |
| 18 to 24 Years | 342 (93.2%) | 288 (84.0%) |
| 25 to 34 Years | 510 (95.7%) | 289 (88.9%) |
| 35 to 44 Years | 307 (82.1%) | 382 (91.2%) |
| 45 to 54 Years | 256 (78.8%) | 224 (79.1%) |
| 55 to 64 Years | 303 (93.5%) | 378 (91.7%) |
| 65 to 74 Years | 175 (82.6%) | 124 (91.2%) |
| 75 Years and over | 31 (63.3%) | 63 (100.0%) |
| Total | 2,771 (88.0%) | 2,452 (86.6%) |
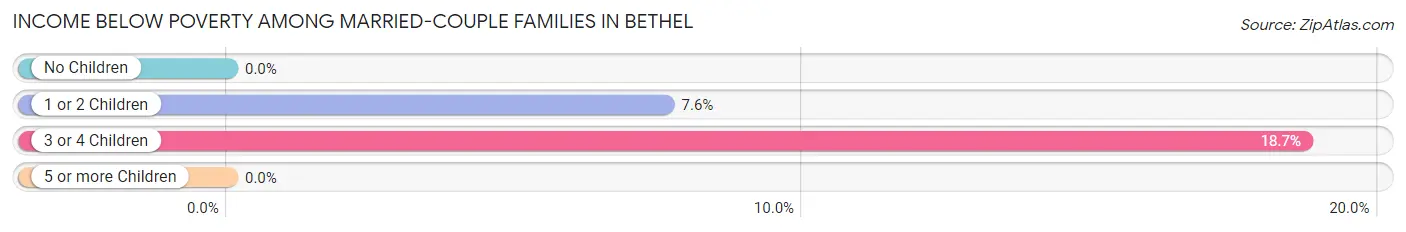
Income Below Poverty Among Married-Couple Families in Bethel
The poverty statistics for married-couple families in Bethel show that 6.1% or 49 of the total 798 families live below the poverty line. Families with 3 or 4 children have the highest poverty rate of 18.7%, comprising of 29 families. On the other hand, families with no children have the lowest poverty rate of 0.0%, which includes 0 families.
| Children | Above Poverty | Below Poverty |
| No Children | 354 (100.0%) | 0 (0.0%) |
| 1 or 2 Children | 243 (92.4%) | 20 (7.6%) |
| 3 or 4 Children | 126 (81.3%) | 29 (18.7%) |
| 5 or more Children | 26 (100.0%) | 0 (0.0%) |
| Total | 749 (93.9%) | 49 (6.1%) |
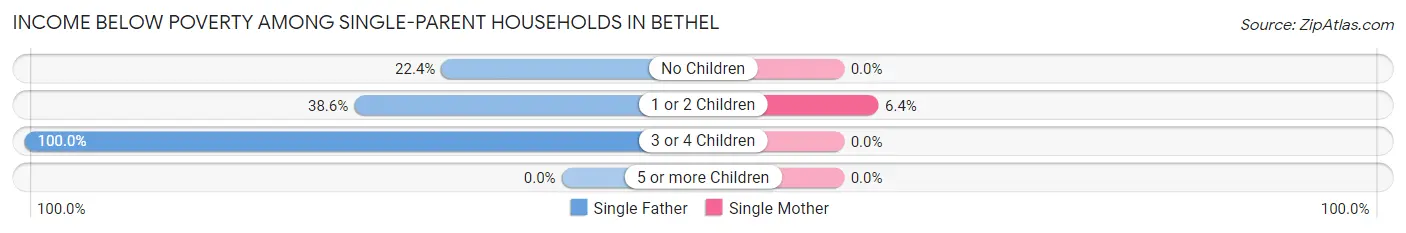
Income Below Poverty Among Single-Parent Households in Bethel
According to the poverty data in Bethel, 41.9% or 52 single-father households and 2.9% or 10 single-mother households are living below the poverty line. Among single-father households, those with 3 or 4 children have the highest poverty rate, with 22 households (100.0%) experiencing poverty. Likewise, among single-mother households, those with 1 or 2 children have the highest poverty rate, with 10 households (6.4%) falling below the poverty line.
| Children | Single Father | Single Mother |
| No Children | 13 (22.4%) | 0 (0.0%) |
| 1 or 2 Children | 17 (38.6%) | 10 (6.4%) |
| 3 or 4 Children | 22 (100.0%) | 0 (0.0%) |
| 5 or more Children | 0 (0.0%) | 0 (0.0%) |
| Total | 52 (41.9%) | 10 (2.9%) |
Income Below Poverty Among Married-Couple vs Single-Parent Households in Bethel
The poverty data for Bethel shows that 49 of the married-couple family households (6.1%) and 62 of the single-parent households (13.2%) are living below the poverty level. Within the married-couple family households, those with 3 or 4 children have the highest poverty rate, with 29 households (18.7%) falling below the poverty line. Among the single-parent households, those with 3 or 4 children have the highest poverty rate, with 22 household (61.1%) living below poverty.
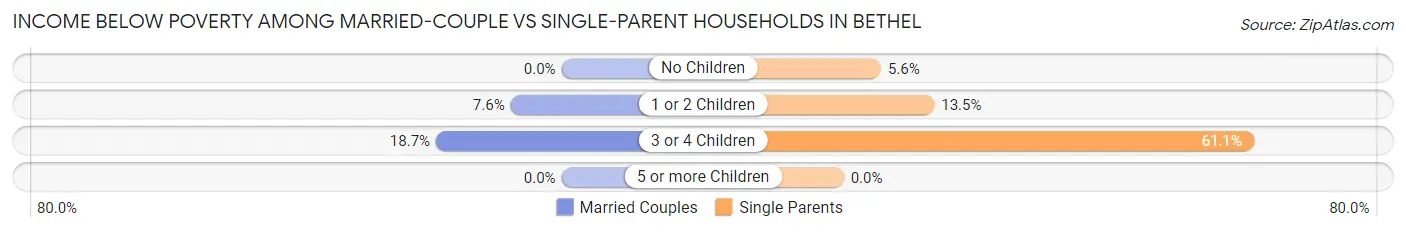
| Children | Married-Couple Families | Single-Parent Households |
| No Children | 0 (0.0%) | 13 (5.6%) |
| 1 or 2 Children | 20 (7.6%) | 27 (13.5%) |
| 3 or 4 Children | 29 (18.7%) | 22 (61.1%) |
| 5 or more Children | 0 (0.0%) | 0 (0.0%) |
| Total | 49 (6.1%) | 62 (13.2%) |
Employment Characteristics in Bethel
Employment by Class of Employer in Bethel
Among the 2,741 employed individuals in Bethel, private company employees (950 | 34.7%), not-for-profit organizations (851 | 31.0%), and state government employees (407 | 14.8%) make up the most common classes of employment.
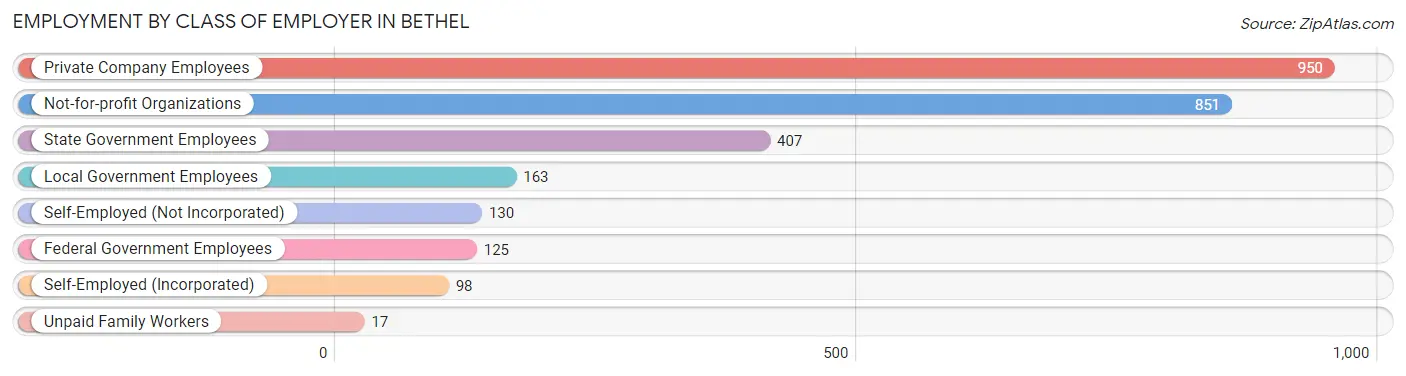
| Employer Class | # Employees | % Employees |
| Private Company Employees | 950 | 34.7% |
| Self-Employed (Incorporated) | 98 | 3.6% |
| Self-Employed (Not Incorporated) | 130 | 4.7% |
| Not-for-profit Organizations | 851 | 31.0% |
| Local Government Employees | 163 | 5.9% |
| State Government Employees | 407 | 14.8% |
| Federal Government Employees | 125 | 4.6% |
| Unpaid Family Workers | 17 | 0.6% |
| Total | 2,741 | 100.0% |
Employment Status by Age in Bethel
According to the labor force statistics for Bethel, out of the total population over 16 years of age (4,572), 67.5% or 3,086 individuals are in the labor force, with 8.9% or 275 of them unemployed. The age group with the highest labor force participation rate is 45 to 54 years, with 87.3% or 550 individuals in the labor force. Within the labor force, the 16 to 19 years age range has the highest percentage of unemployed individuals, with 46.0% or 63 of them being unemployed.
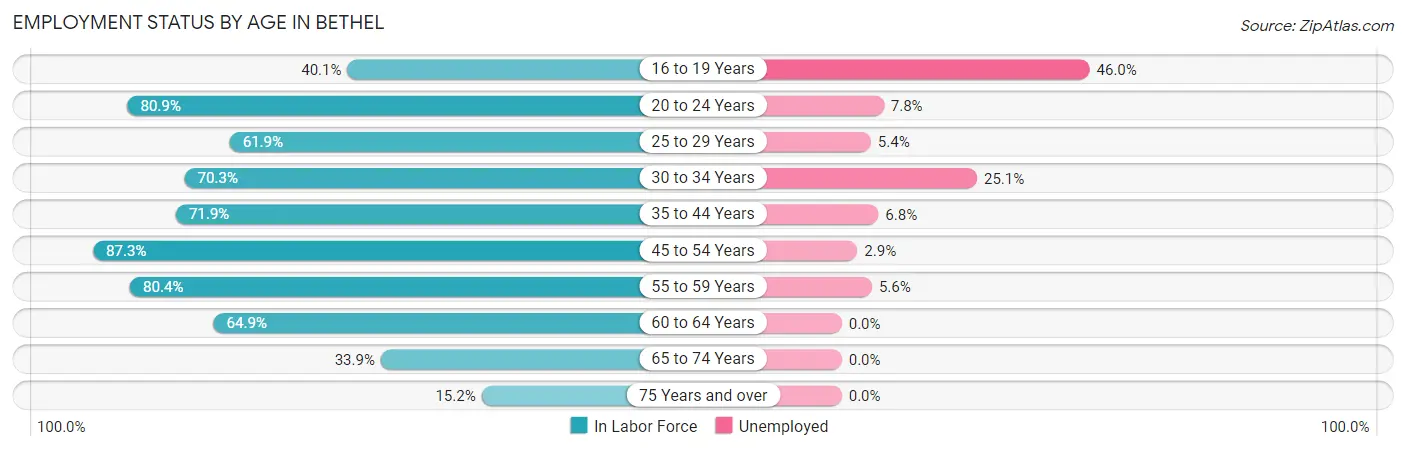
| Age Bracket | In Labor Force | Unemployed |
| 16 to 19 Years | 137 (40.1%) | 63 (46.0%) |
| 20 to 24 Years | 461 (80.9%) | 36 (7.8%) |
| 25 to 29 Years | 294 (61.9%) | 16 (5.4%) |
| 30 to 34 Years | 336 (70.3%) | 84 (25.1%) |
| 35 to 44 Years | 608 (71.9%) | 41 (6.8%) |
| 45 to 54 Years | 550 (87.3%) | 16 (2.9%) |
| 55 to 59 Years | 324 (80.4%) | 18 (5.6%) |
| 60 to 64 Years | 239 (64.9%) | 0 (0.0%) |
| 65 to 74 Years | 118 (33.9%) | 0 (0.0%) |
| 75 Years and over | 17 (15.2%) | 0 (0.0%) |
| Total | 3,086 (67.5%) | 275 (8.9%) |
Employment Status by Educational Attainment in Bethel
According to labor force statistics for Bethel, 73.5% of individuals (2,352) out of the total population between 25 and 64 years of age (3,200) are in the labor force, with 7.4% or 174 of them being unemployed. The group with the highest labor force participation rate are those with the educational attainment of bachelor's degree or higher, with 94.3% or 580 individuals in the labor force. Within the labor force, individuals with less than high school education have the highest percentage of unemployment, with 10.0% or 11 of them being unemployed.
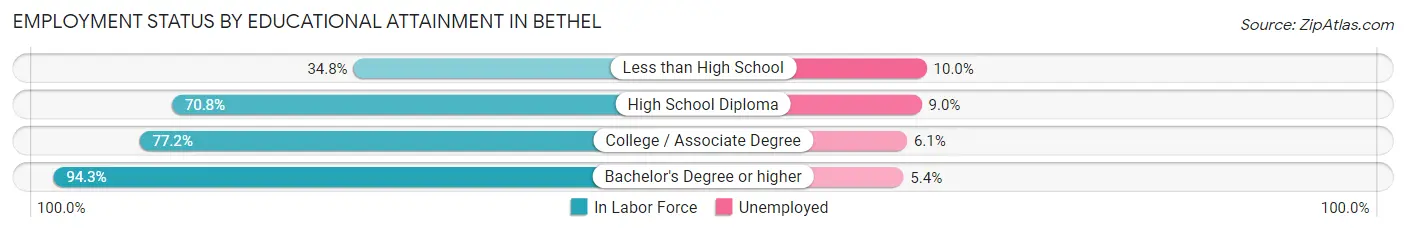
| Educational Attainment | In Labor Force | Unemployed |
| Less than High School | 110 (34.8%) | 32 (10.0%) |
| High School Diploma | 1,007 (70.8%) | 128 (9.0%) |
| College / Associate Degree | 653 (77.2%) | 52 (6.1%) |
| Bachelor's Degree or higher | 580 (94.3%) | 33 (5.4%) |
| Total | 2,352 (73.5%) | 237 (7.4%) |
Employment Occupations by Sex in Bethel
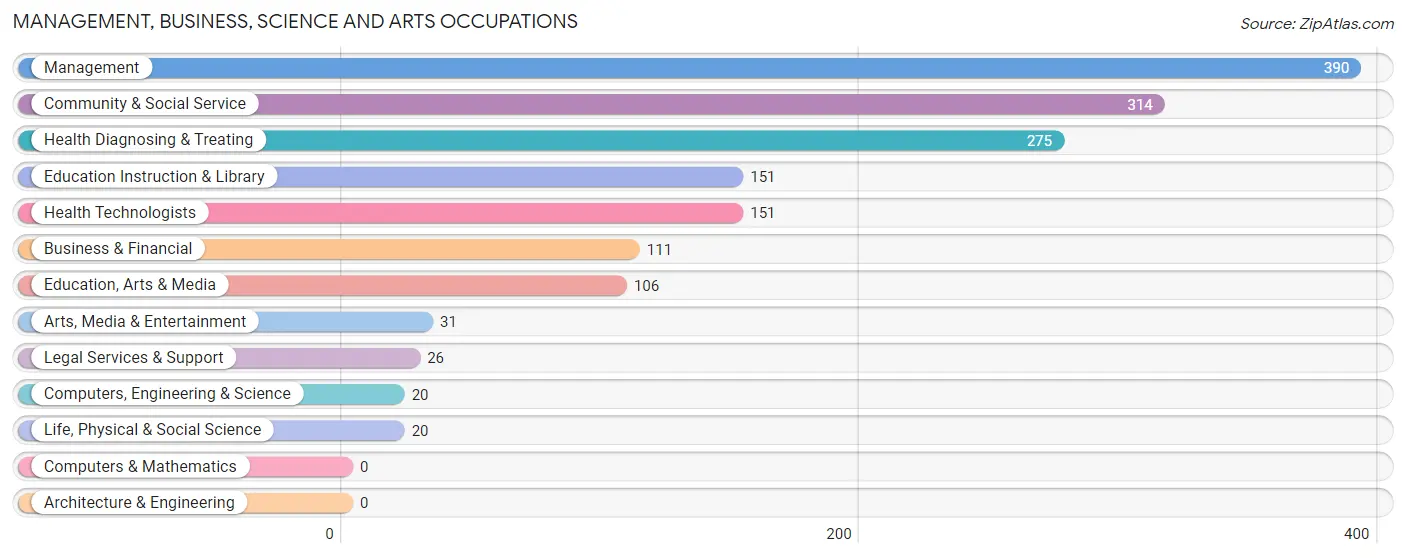
Management, Business, Science and Arts Occupations
The most common Management, Business, Science and Arts occupations in Bethel are Management (390 | 14.0%), Community & Social Service (314 | 11.3%), Health Diagnosing & Treating (275 | 9.9%), Education Instruction & Library (151 | 5.4%), and Health Technologists (151 | 5.4%).
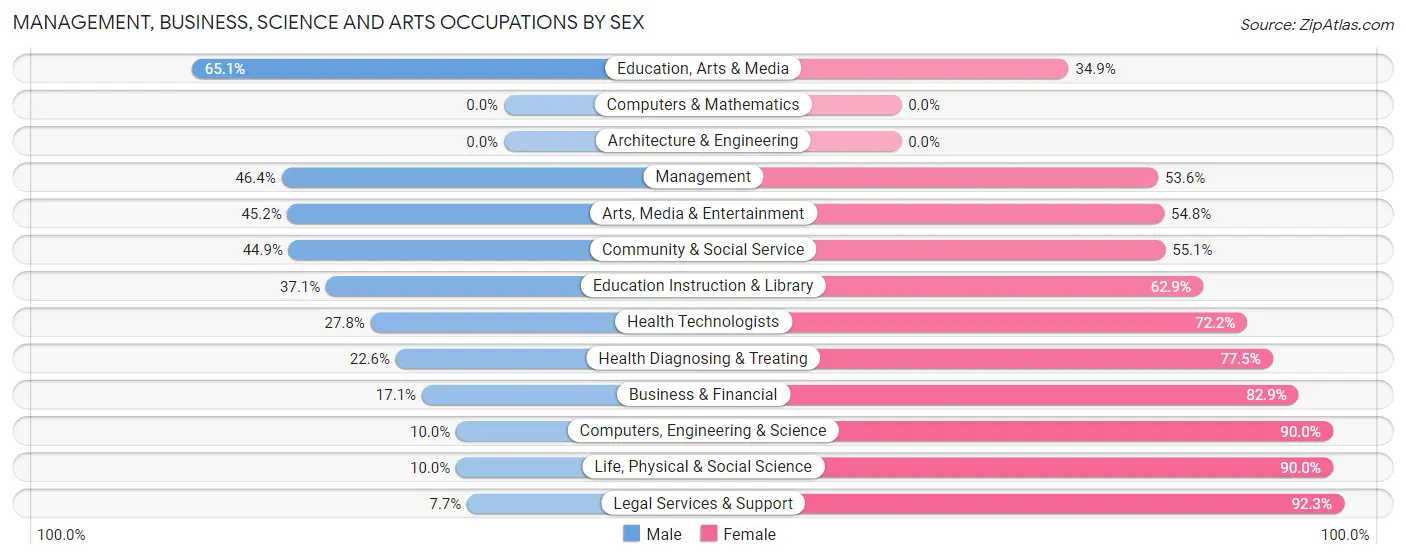
Management, Business, Science and Arts Occupations by Sex
Within the Management, Business, Science and Arts occupations in Bethel, the most male-oriented occupations are Education, Arts & Media (65.1%), Management (46.4%), and Arts, Media & Entertainment (45.2%), while the most female-oriented occupations are Legal Services & Support (92.3%), Computers, Engineering & Science (90.0%), and Life, Physical & Social Science (90.0%).
| Occupation | Male | Female |
| Management | 181 (46.4%) | 209 (53.6%) |
| Business & Financial | 19 (17.1%) | 92 (82.9%) |
| Computers, Engineering & Science | 2 (10.0%) | 18 (90.0%) |
| Computers & Mathematics | 0 (0.0%) | 0 (0.0%) |
| Architecture & Engineering | 0 (0.0%) | 0 (0.0%) |
| Life, Physical & Social Science | 2 (10.0%) | 18 (90.0%) |
| Community & Social Service | 141 (44.9%) | 173 (55.1%) |
| Education, Arts & Media | 69 (65.1%) | 37 (34.9%) |
| Legal Services & Support | 2 (7.7%) | 24 (92.3%) |
| Education Instruction & Library | 56 (37.1%) | 95 (62.9%) |
| Arts, Media & Entertainment | 14 (45.2%) | 17 (54.8%) |
| Health Diagnosing & Treating | 62 (22.6%) | 213 (77.4%) |
| Health Technologists | 42 (27.8%) | 109 (72.2%) |
| Total (Category) | 405 (36.5%) | 705 (63.5%) |
| Total (Overall) | 1,514 (54.3%) | 1,276 (45.7%) |
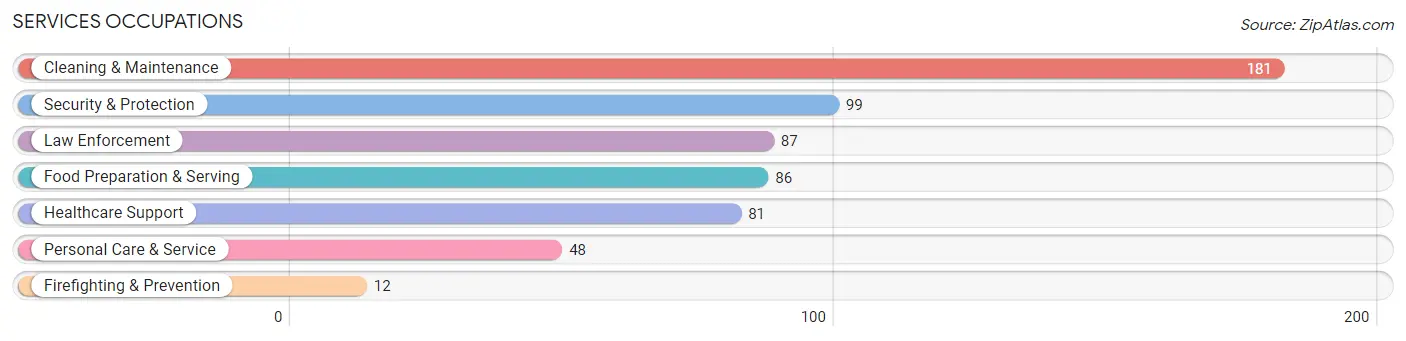
Services Occupations
The most common Services occupations in Bethel are Cleaning & Maintenance (181 | 6.5%), Security & Protection (99 | 3.5%), Law Enforcement (87 | 3.1%), Food Preparation & Serving (86 | 3.1%), and Healthcare Support (81 | 2.9%).
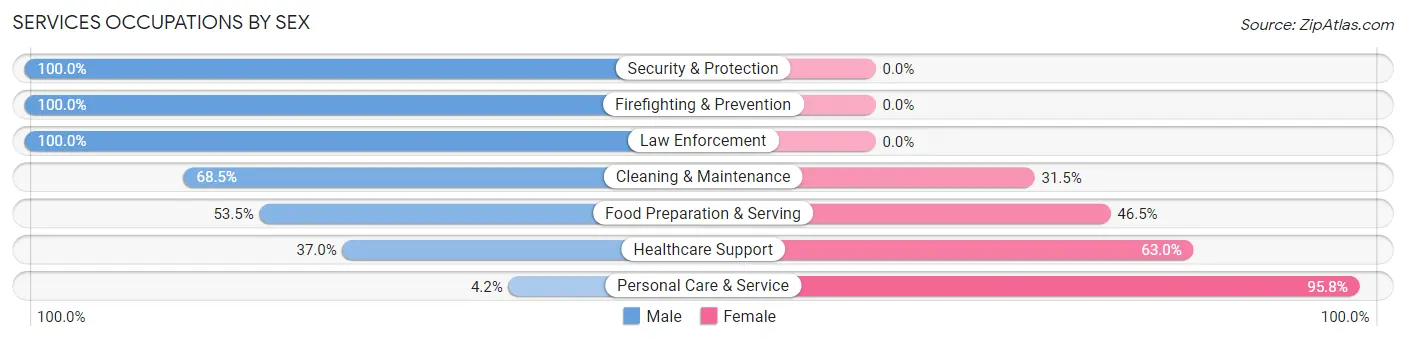
Services Occupations by Sex
Within the Services occupations in Bethel, the most male-oriented occupations are Security & Protection (100.0%), Firefighting & Prevention (100.0%), and Law Enforcement (100.0%), while the most female-oriented occupations are Personal Care & Service (95.8%), Healthcare Support (63.0%), and Food Preparation & Serving (46.5%).
| Occupation | Male | Female |
| Healthcare Support | 30 (37.0%) | 51 (63.0%) |
| Security & Protection | 99 (100.0%) | 0 (0.0%) |
| Firefighting & Prevention | 12 (100.0%) | 0 (0.0%) |
| Law Enforcement | 87 (100.0%) | 0 (0.0%) |
| Food Preparation & Serving | 46 (53.5%) | 40 (46.5%) |
| Cleaning & Maintenance | 124 (68.5%) | 57 (31.5%) |
| Personal Care & Service | 2 (4.2%) | 46 (95.8%) |
| Total (Category) | 301 (60.8%) | 194 (39.2%) |
| Total (Overall) | 1,514 (54.3%) | 1,276 (45.7%) |
Sales and Office Occupations
The most common Sales and Office occupations in Bethel are Office & Administration (514 | 18.4%), and Sales & Related (132 | 4.7%).
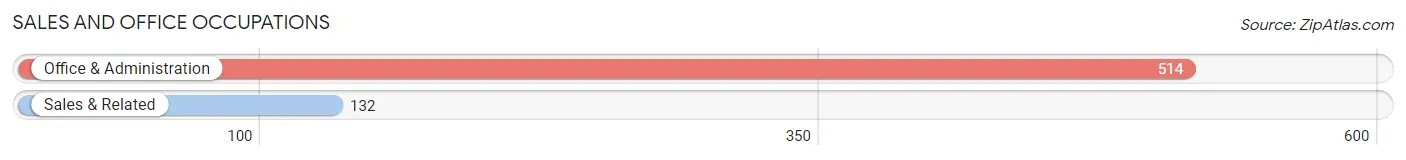
Sales and Office Occupations by Sex
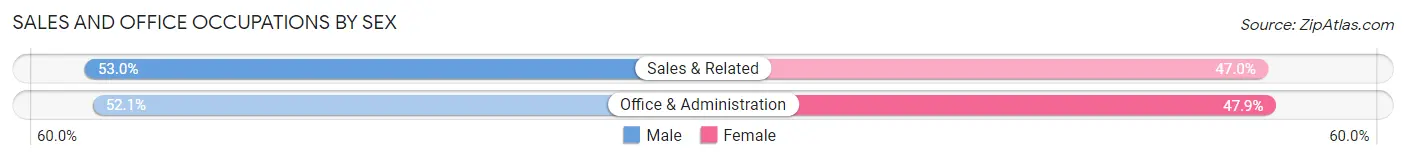
| Occupation | Male | Female |
| Sales & Related | 70 (53.0%) | 62 (47.0%) |
| Office & Administration | 268 (52.1%) | 246 (47.9%) |
| Total (Category) | 338 (52.3%) | 308 (47.7%) |
| Total (Overall) | 1,514 (54.3%) | 1,276 (45.7%) |
Natural Resources, Construction and Maintenance Occupations
The most common Natural Resources, Construction and Maintenance occupations in Bethel are Installation, Maintenance & Repair (94 | 3.4%), Construction & Extraction (66 | 2.4%), and Farming, Fishing & Forestry (14 | 0.5%).
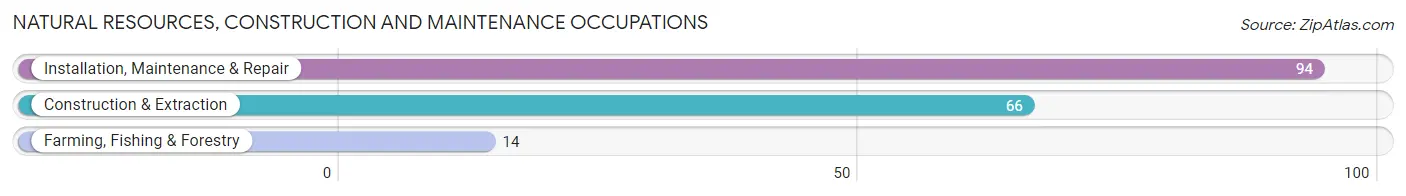
Natural Resources, Construction and Maintenance Occupations by Sex
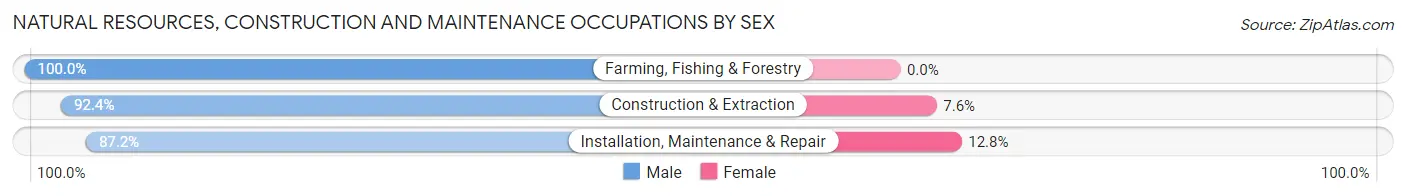
| Occupation | Male | Female |
| Farming, Fishing & Forestry | 14 (100.0%) | 0 (0.0%) |
| Construction & Extraction | 61 (92.4%) | 5 (7.6%) |
| Installation, Maintenance & Repair | 82 (87.2%) | 12 (12.8%) |
| Total (Category) | 157 (90.2%) | 17 (9.8%) |
| Total (Overall) | 1,514 (54.3%) | 1,276 (45.7%) |
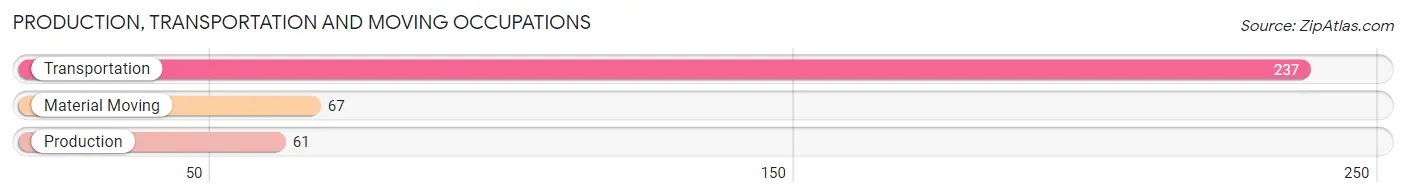
Production, Transportation and Moving Occupations
The most common Production, Transportation and Moving occupations in Bethel are Transportation (237 | 8.5%), Material Moving (67 | 2.4%), and Production (61 | 2.2%).
Production, Transportation and Moving Occupations by Sex
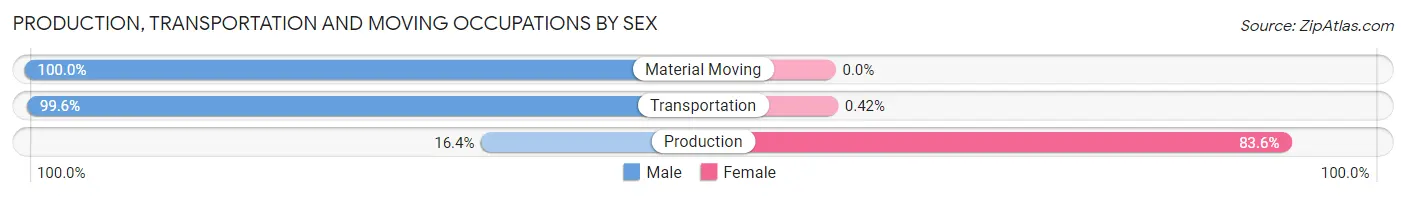
| Occupation | Male | Female |
| Production | 10 (16.4%) | 51 (83.6%) |
| Transportation | 236 (99.6%) | 1 (0.4%) |
| Material Moving | 67 (100.0%) | 0 (0.0%) |
| Total (Category) | 313 (85.8%) | 52 (14.2%) |
| Total (Overall) | 1,514 (54.3%) | 1,276 (45.7%) |
Employment Industries by Sex in Bethel
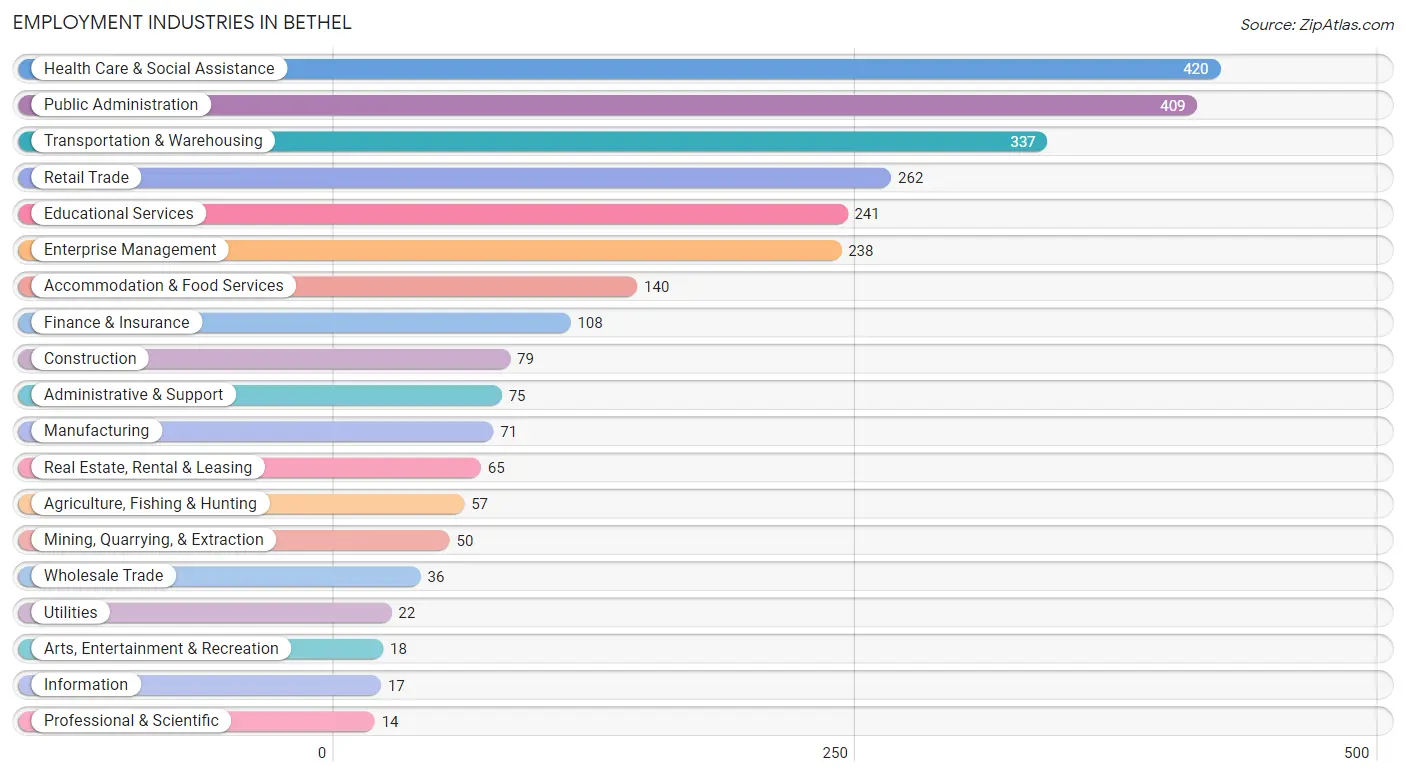
Employment Industries in Bethel
The major employment industries in Bethel include Health Care & Social Assistance (420 | 15.0%), Public Administration (409 | 14.7%), Transportation & Warehousing (337 | 12.1%), Retail Trade (262 | 9.4%), and Educational Services (241 | 8.6%).
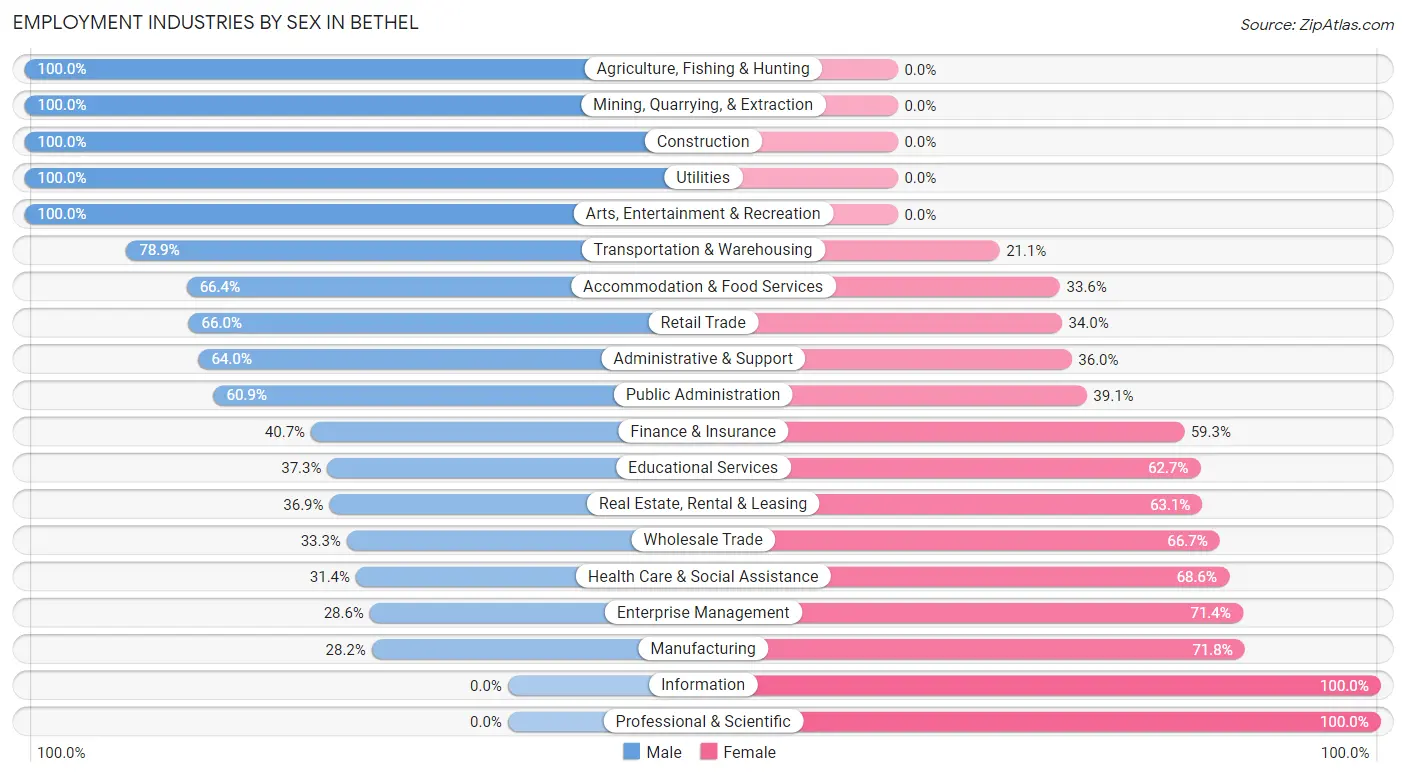
Employment Industries by Sex in Bethel
The Bethel industries that see more men than women are Agriculture, Fishing & Hunting (100.0%), Mining, Quarrying, & Extraction (100.0%), and Construction (100.0%), whereas the industries that tend to have a higher number of women are Information (100.0%), Professional & Scientific (100.0%), and Manufacturing (71.8%).
| Industry | Male | Female |
| Agriculture, Fishing & Hunting | 57 (100.0%) | 0 (0.0%) |
| Mining, Quarrying, & Extraction | 50 (100.0%) | 0 (0.0%) |
| Construction | 79 (100.0%) | 0 (0.0%) |
| Manufacturing | 20 (28.2%) | 51 (71.8%) |
| Wholesale Trade | 12 (33.3%) | 24 (66.7%) |
| Retail Trade | 173 (66.0%) | 89 (34.0%) |
| Transportation & Warehousing | 266 (78.9%) | 71 (21.1%) |
| Utilities | 22 (100.0%) | 0 (0.0%) |
| Information | 0 (0.0%) | 17 (100.0%) |
| Finance & Insurance | 44 (40.7%) | 64 (59.3%) |
| Real Estate, Rental & Leasing | 24 (36.9%) | 41 (63.1%) |
| Professional & Scientific | 0 (0.0%) | 14 (100.0%) |
| Enterprise Management | 68 (28.6%) | 170 (71.4%) |
| Administrative & Support | 48 (64.0%) | 27 (36.0%) |
| Educational Services | 90 (37.3%) | 151 (62.7%) |
| Health Care & Social Assistance | 132 (31.4%) | 288 (68.6%) |
| Arts, Entertainment & Recreation | 18 (100.0%) | 0 (0.0%) |
| Accommodation & Food Services | 93 (66.4%) | 47 (33.6%) |
| Public Administration | 249 (60.9%) | 160 (39.1%) |
| Total | 1,514 (54.3%) | 1,276 (45.7%) |
Education in Bethel
School Enrollment in Bethel
The most common levels of schooling among the 1,617 students in Bethel are high school (420 | 26.0%), elementary school (365 | 22.6%), and middle school (333 | 20.6%).
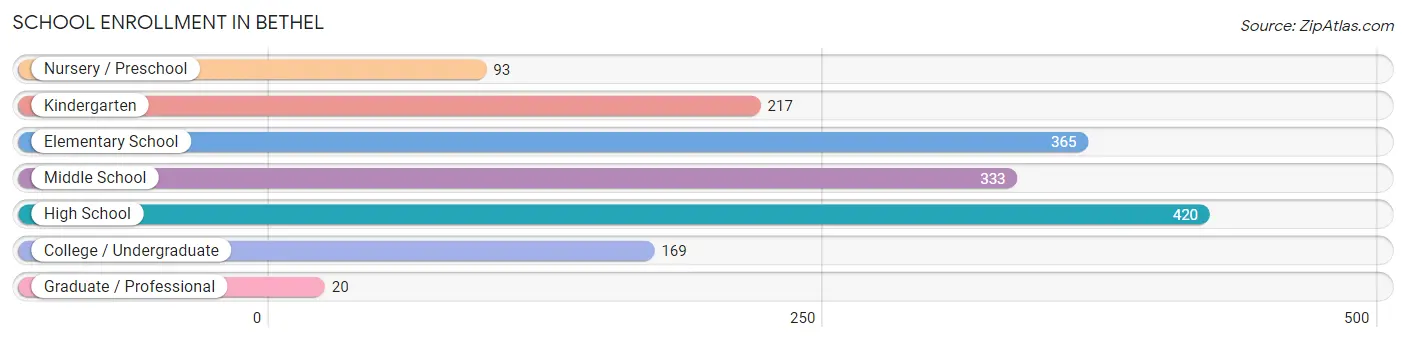
| School Level | # Students | % Students |
| Nursery / Preschool | 93 | 5.8% |
| Kindergarten | 217 | 13.4% |
| Elementary School | 365 | 22.6% |
| Middle School | 333 | 20.6% |
| High School | 420 | 26.0% |
| College / Undergraduate | 169 | 10.4% |
| Graduate / Professional | 20 | 1.2% |
| Total | 1,617 | 100.0% |
School Enrollment by Age by Funding Source in Bethel
Out of a total of 1,617 students who are enrolled in schools in Bethel, 31 (1.9%) attend a private institution, while the remaining 1,586 (98.1%) are enrolled in public schools. The age group of 35 years and over has the highest likelihood of being enrolled in private schools, with 11 (24.4% in the age bracket) enrolled. Conversely, the age group of 3 to 4 year olds has the lowest likelihood of being enrolled in a private school, with 63 (100.0% in the age bracket) attending a public institution.
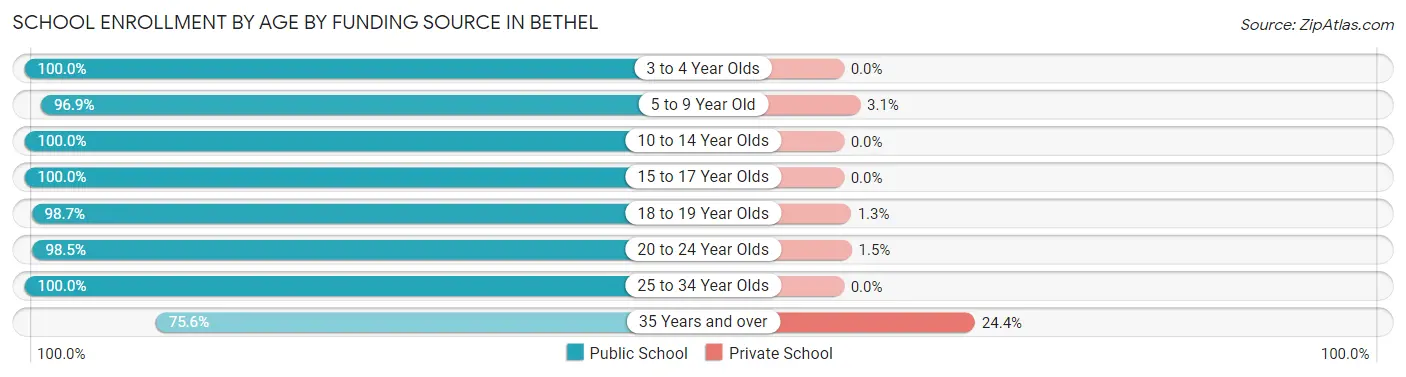
| Age Bracket | Public School | Private School |
| 3 to 4 Year Olds | 63 (100.0%) | 0 (0.0%) |
| 5 to 9 Year Old | 570 (96.9%) | 18 (3.1%) |
| 10 to 14 Year Olds | 404 (100.0%) | 0 (0.0%) |
| 15 to 17 Year Olds | 299 (100.0%) | 0 (0.0%) |
| 18 to 19 Year Olds | 75 (98.7%) | 1 (1.3%) |
| 20 to 24 Year Olds | 67 (98.5%) | 1 (1.5%) |
| 25 to 34 Year Olds | 74 (100.0%) | 0 (0.0%) |
| 35 Years and over | 34 (75.6%) | 11 (24.4%) |
| Total | 1,586 (98.1%) | 31 (1.9%) |
Educational Attainment by Field of Study in Bethel
Science & technology (199 | 27.2%), education (119 | 16.3%), business (116 | 15.9%), bio, nature & agricultural (88 | 12.0%), and arts & humanities (82 | 11.2%) are the most common fields of study among 731 individuals in Bethel who have obtained a bachelor's degree or higher.
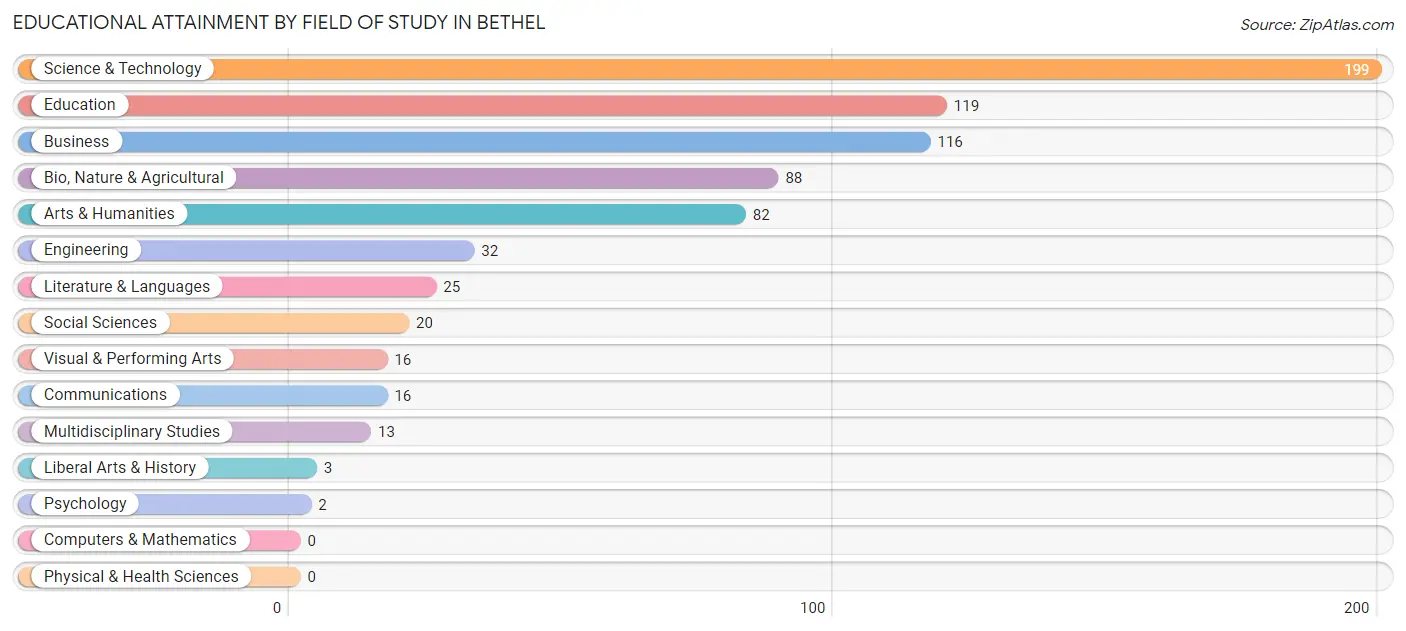
| Field of Study | # Graduates | % Graduates |
| Computers & Mathematics | 0 | 0.0% |
| Bio, Nature & Agricultural | 88 | 12.0% |
| Physical & Health Sciences | 0 | 0.0% |
| Psychology | 2 | 0.3% |
| Social Sciences | 20 | 2.7% |
| Engineering | 32 | 4.4% |
| Multidisciplinary Studies | 13 | 1.8% |
| Science & Technology | 199 | 27.2% |
| Business | 116 | 15.9% |
| Education | 119 | 16.3% |
| Literature & Languages | 25 | 3.4% |
| Liberal Arts & History | 3 | 0.4% |
| Visual & Performing Arts | 16 | 2.2% |
| Communications | 16 | 2.2% |
| Arts & Humanities | 82 | 11.2% |
| Total | 731 | 100.0% |
Transportation & Commute in Bethel
Vehicle Availability by Sex in Bethel
The most prevalent vehicle ownership categories in Bethel are males with 1 vehicle (496, accounting for 34.9%) and females with 1 vehicle (411, making up 42.5%).
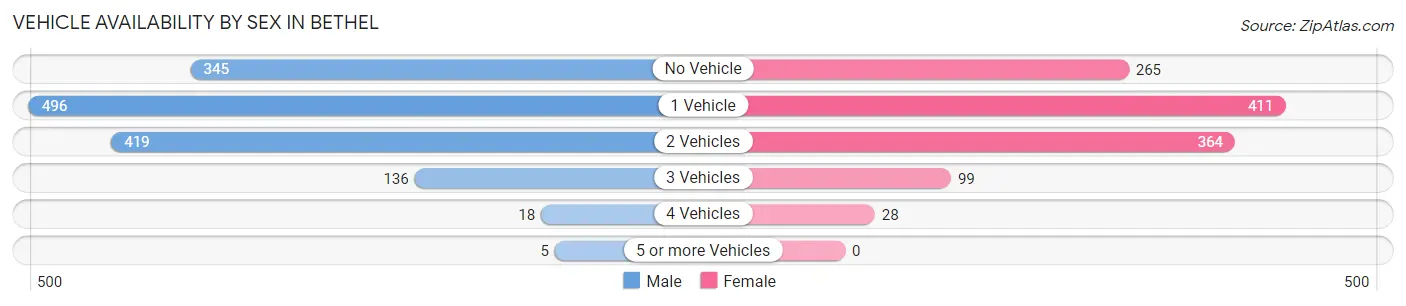
| Vehicles Available | Male | Female |
| No Vehicle | 345 (24.3%) | 265 (22.7%) |
| 1 Vehicle | 496 (34.9%) | 411 (35.2%) |
| 2 Vehicles | 419 (29.5%) | 364 (31.2%) |
| 3 Vehicles | 136 (9.6%) | 99 (8.5%) |
| 4 Vehicles | 18 (1.3%) | 28 (2.4%) |
| 5 or more Vehicles | 5 (0.4%) | 0 (0.0%) |
| Total | 1,419 (100.0%) | 1,167 (100.0%) |
Commute Time in Bethel
The most frequently occuring commute durations in Bethel are 5 to 9 minutes (845 commuters, 34.4%), 10 to 14 minutes (635 commuters, 25.8%), and less than 5 minutes (538 commuters, 21.9%).
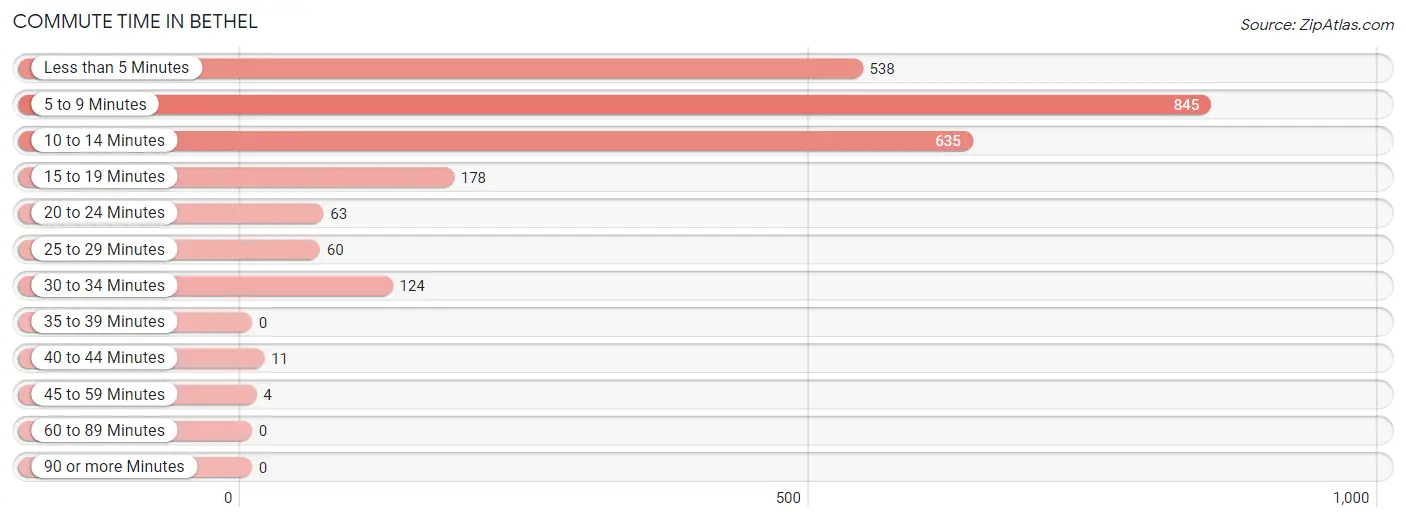
| Commute Time | # Commuters | % Commuters |
| Less than 5 Minutes | 538 | 21.9% |
| 5 to 9 Minutes | 845 | 34.4% |
| 10 to 14 Minutes | 635 | 25.8% |
| 15 to 19 Minutes | 178 | 7.2% |
| 20 to 24 Minutes | 63 | 2.6% |
| 25 to 29 Minutes | 60 | 2.4% |
| 30 to 34 Minutes | 124 | 5.0% |
| 35 to 39 Minutes | 0 | 0.0% |
| 40 to 44 Minutes | 11 | 0.4% |
| 45 to 59 Minutes | 4 | 0.2% |
| 60 to 89 Minutes | 0 | 0.0% |
| 90 or more Minutes | 0 | 0.0% |
Commute Time by Sex in Bethel
The most common commute times in Bethel are 5 to 9 minutes (391 commuters, 28.9%) for males and 5 to 9 minutes (454 commuters, 41.0%) for females.
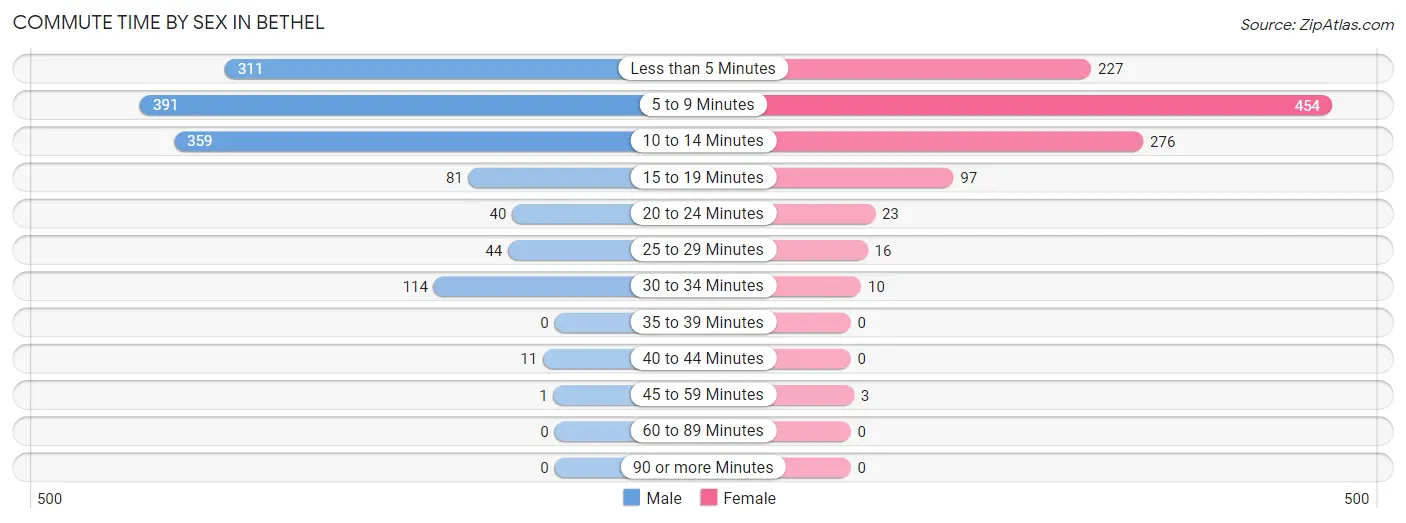
| Commute Time | Male | Female |
| Less than 5 Minutes | 311 (23.0%) | 227 (20.5%) |
| 5 to 9 Minutes | 391 (28.9%) | 454 (41.0%) |
| 10 to 14 Minutes | 359 (26.6%) | 276 (24.9%) |
| 15 to 19 Minutes | 81 (6.0%) | 97 (8.8%) |
| 20 to 24 Minutes | 40 (3.0%) | 23 (2.1%) |
| 25 to 29 Minutes | 44 (3.3%) | 16 (1.5%) |
| 30 to 34 Minutes | 114 (8.4%) | 10 (0.9%) |
| 35 to 39 Minutes | 0 (0.0%) | 0 (0.0%) |
| 40 to 44 Minutes | 11 (0.8%) | 0 (0.0%) |
| 45 to 59 Minutes | 1 (0.1%) | 3 (0.3%) |
| 60 to 89 Minutes | 0 (0.0%) | 0 (0.0%) |
| 90 or more Minutes | 0 (0.0%) | 0 (0.0%) |
Time of Departure to Work by Sex in Bethel
The most frequent times of departure to work in Bethel are 7:30 AM to 7:59 AM (484, 35.8%) for males and 7:30 AM to 7:59 AM (355, 32.1%) for females.
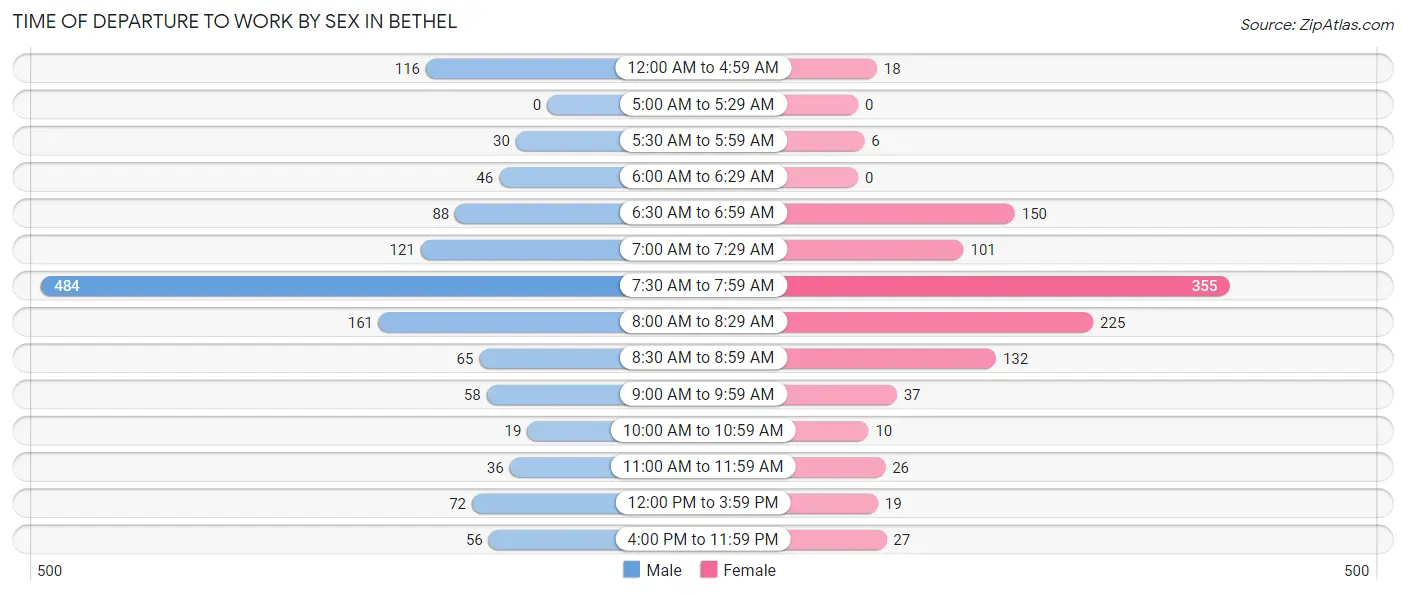
| Time of Departure | Male | Female |
| 12:00 AM to 4:59 AM | 116 (8.6%) | 18 (1.6%) |
| 5:00 AM to 5:29 AM | 0 (0.0%) | 0 (0.0%) |
| 5:30 AM to 5:59 AM | 30 (2.2%) | 6 (0.5%) |
| 6:00 AM to 6:29 AM | 46 (3.4%) | 0 (0.0%) |
| 6:30 AM to 6:59 AM | 88 (6.5%) | 150 (13.6%) |
| 7:00 AM to 7:29 AM | 121 (8.9%) | 101 (9.1%) |
| 7:30 AM to 7:59 AM | 484 (35.8%) | 355 (32.1%) |
| 8:00 AM to 8:29 AM | 161 (11.9%) | 225 (20.3%) |
| 8:30 AM to 8:59 AM | 65 (4.8%) | 132 (11.9%) |
| 9:00 AM to 9:59 AM | 58 (4.3%) | 37 (3.4%) |
| 10:00 AM to 10:59 AM | 19 (1.4%) | 10 (0.9%) |
| 11:00 AM to 11:59 AM | 36 (2.7%) | 26 (2.4%) |
| 12:00 PM to 3:59 PM | 72 (5.3%) | 19 (1.7%) |
| 4:00 PM to 11:59 PM | 56 (4.1%) | 27 (2.4%) |
| Total | 1,352 (100.0%) | 1,106 (100.0%) |
Housing Occupancy in Bethel
Occupancy by Ownership in Bethel
Of the total 1,937 dwellings in Bethel, owner-occupied units account for 799 (41.2%), while renter-occupied units make up 1,138 (58.8%).
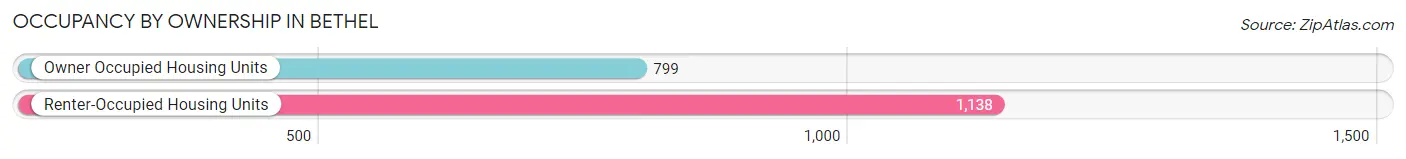
| Occupancy | # Housing Units | % Housing Units |
| Owner Occupied Housing Units | 799 | 41.2% |
| Renter-Occupied Housing Units | 1,138 | 58.8% |
| Total Occupied Housing Units | 1,937 | 100.0% |
Occupancy by Household Size in Bethel
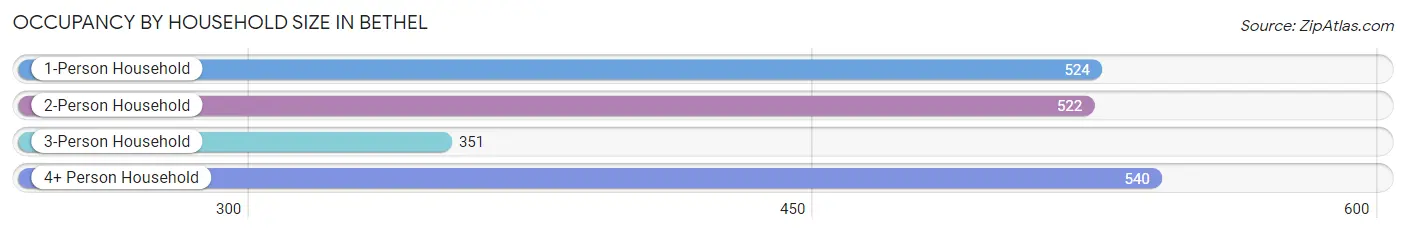
| Household Size | # Housing Units | % Housing Units |
| 1-Person Household | 524 | 27.1% |
| 2-Person Household | 522 | 27.0% |
| 3-Person Household | 351 | 18.1% |
| 4+ Person Household | 540 | 27.9% |
| Total Housing Units | 1,937 | 100.0% |
Occupancy by Ownership by Household Size in Bethel
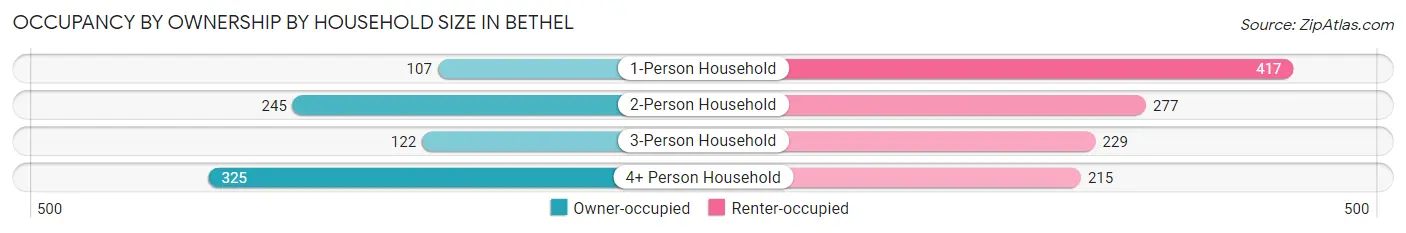
| Household Size | Owner-occupied | Renter-occupied |
| 1-Person Household | 107 (20.4%) | 417 (79.6%) |
| 2-Person Household | 245 (46.9%) | 277 (53.1%) |
| 3-Person Household | 122 (34.8%) | 229 (65.2%) |
| 4+ Person Household | 325 (60.2%) | 215 (39.8%) |
| Total Housing Units | 799 (41.2%) | 1,138 (58.8%) |
Occupancy by Educational Attainment in Bethel
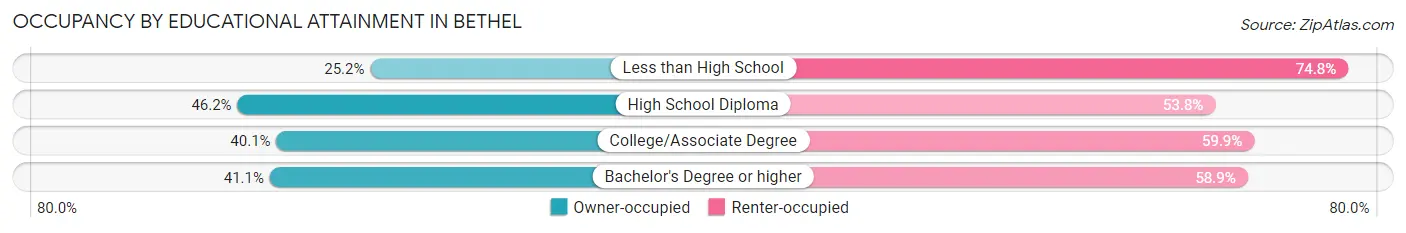
| Household Size | Owner-occupied | Renter-occupied |
| Less than High School | 37 (25.2%) | 110 (74.8%) |
| High School Diploma | 295 (46.2%) | 343 (53.8%) |
| College/Associate Degree | 252 (40.1%) | 377 (59.9%) |
| Bachelor's Degree or higher | 215 (41.1%) | 308 (58.9%) |
Occupancy by Age of Householder in Bethel
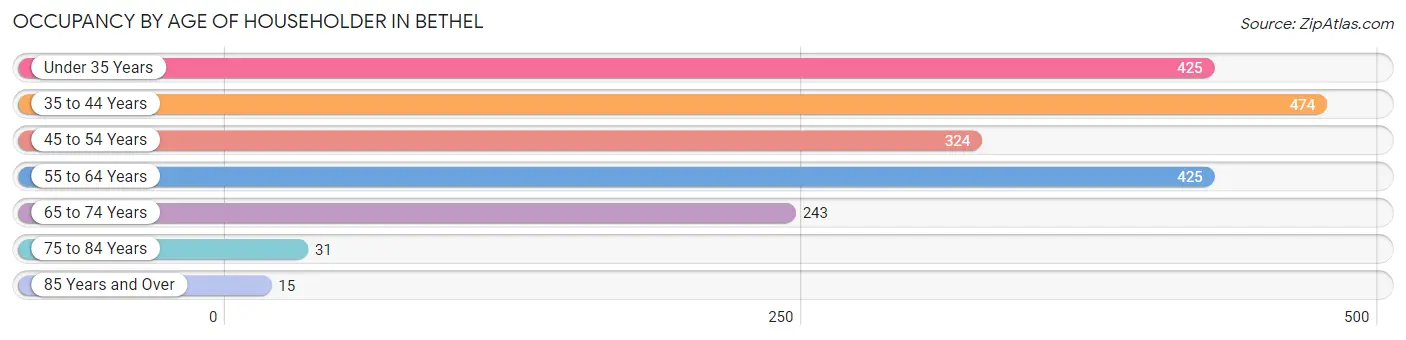
| Age Bracket | # Households | % Households |
| Under 35 Years | 425 | 21.9% |
| 35 to 44 Years | 474 | 24.5% |
| 45 to 54 Years | 324 | 16.7% |
| 55 to 64 Years | 425 | 21.9% |
| 65 to 74 Years | 243 | 12.6% |
| 75 to 84 Years | 31 | 1.6% |
| 85 Years and Over | 15 | 0.8% |
| Total | 1,937 | 100.0% |
Housing Finances in Bethel
Median Income by Occupancy in Bethel
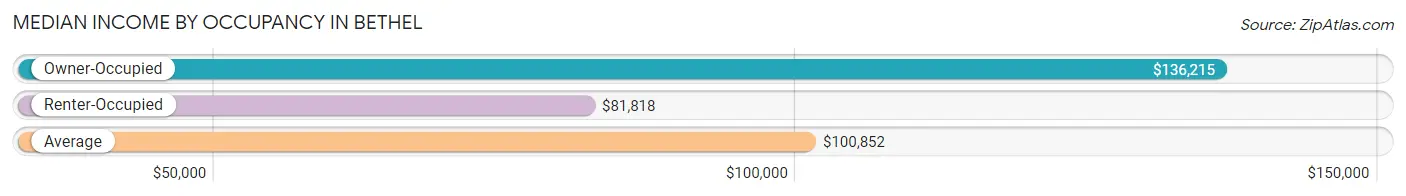
| Occupancy Type | # Households | Median Income |
| Owner-Occupied | 799 (41.2%) | $136,215 |
| Renter-Occupied | 1,138 (58.8%) | $81,818 |
| Average | 1,937 (100.0%) | $100,852 |
Occupancy by Householder Income Bracket in Bethel
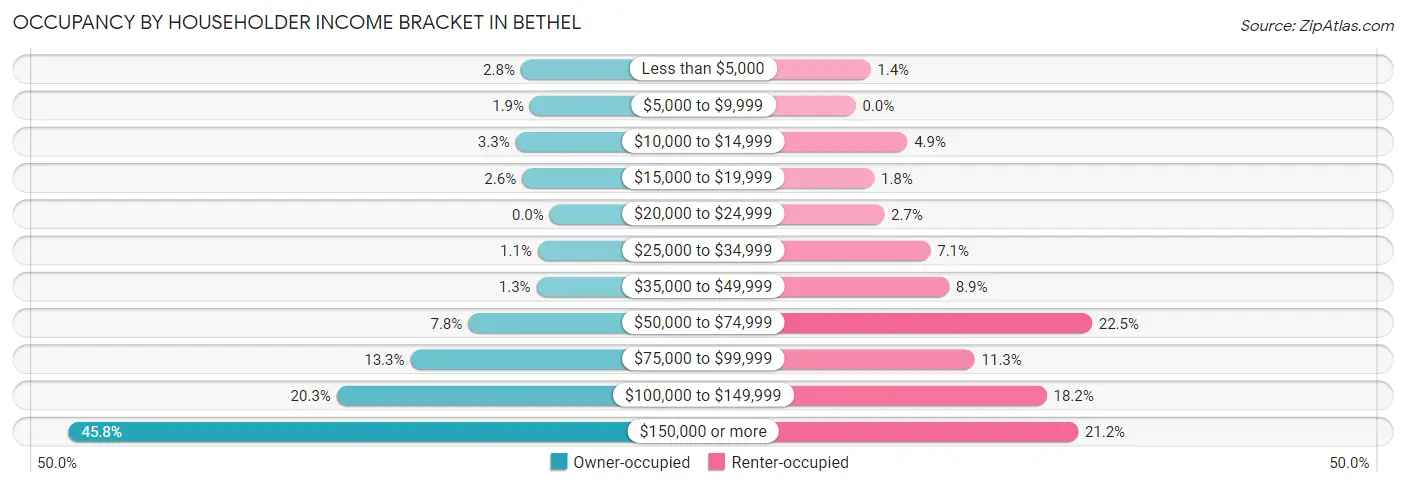
| Income Bracket | Owner-occupied | Renter-occupied |
| Less than $5,000 | 22 (2.8%) | 16 (1.4%) |
| $5,000 to $9,999 | 15 (1.9%) | 0 (0.0%) |
| $10,000 to $14,999 | 26 (3.3%) | 56 (4.9%) |
| $15,000 to $19,999 | 21 (2.6%) | 20 (1.8%) |
| $20,000 to $24,999 | 0 (0.0%) | 31 (2.7%) |
| $25,000 to $34,999 | 9 (1.1%) | 81 (7.1%) |
| $35,000 to $49,999 | 10 (1.3%) | 101 (8.9%) |
| $50,000 to $74,999 | 62 (7.8%) | 256 (22.5%) |
| $75,000 to $99,999 | 106 (13.3%) | 129 (11.3%) |
| $100,000 to $149,999 | 162 (20.3%) | 207 (18.2%) |
| $150,000 or more | 366 (45.8%) | 241 (21.2%) |
| Total | 799 (100.0%) | 1,138 (100.0%) |
Monthly Housing Cost Tiers in Bethel
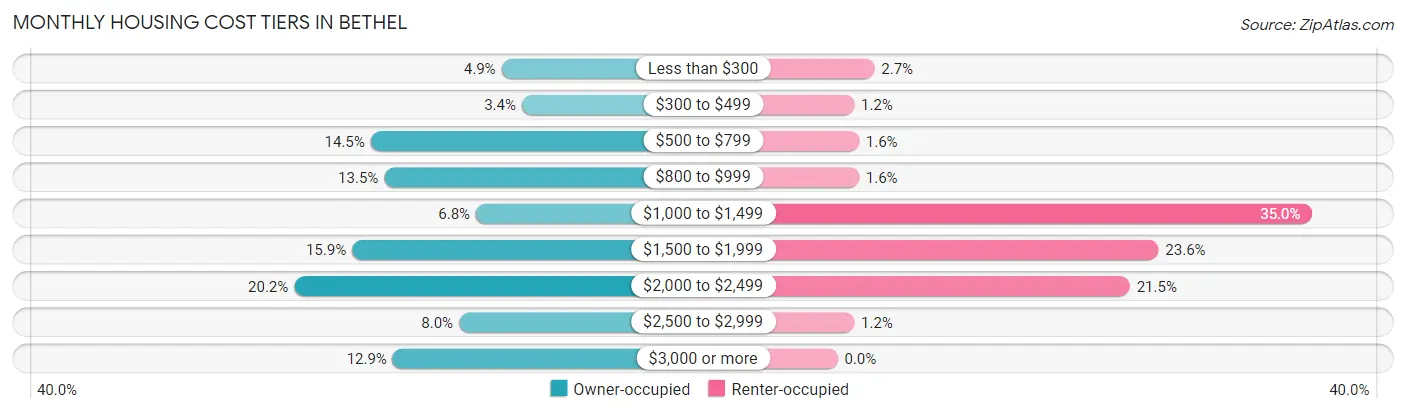
| Monthly Cost | Owner-occupied | Renter-occupied |
| Less than $300 | 39 (4.9%) | 31 (2.7%) |
| $300 to $499 | 27 (3.4%) | 14 (1.2%) |
| $500 to $799 | 116 (14.5%) | 18 (1.6%) |
| $800 to $999 | 108 (13.5%) | 18 (1.6%) |
| $1,000 to $1,499 | 54 (6.8%) | 398 (35.0%) |
| $1,500 to $1,999 | 127 (15.9%) | 269 (23.6%) |
| $2,000 to $2,499 | 161 (20.2%) | 245 (21.5%) |
| $2,500 to $2,999 | 64 (8.0%) | 14 (1.2%) |
| $3,000 or more | 103 (12.9%) | 0 (0.0%) |
| Total | 799 (100.0%) | 1,138 (100.0%) |
Physical Housing Characteristics in Bethel
Housing Structures in Bethel
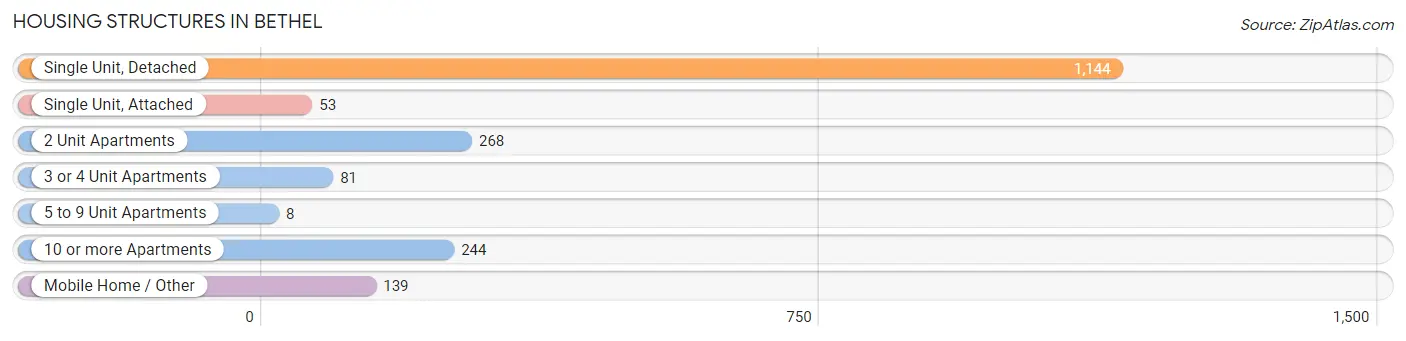
| Structure Type | # Housing Units | % Housing Units |
| Single Unit, Detached | 1,144 | 59.1% |
| Single Unit, Attached | 53 | 2.7% |
| 2 Unit Apartments | 268 | 13.8% |
| 3 or 4 Unit Apartments | 81 | 4.2% |
| 5 to 9 Unit Apartments | 8 | 0.4% |
| 10 or more Apartments | 244 | 12.6% |
| Mobile Home / Other | 139 | 7.2% |
| Total | 1,937 | 100.0% |
Housing Structures by Occupancy in Bethel
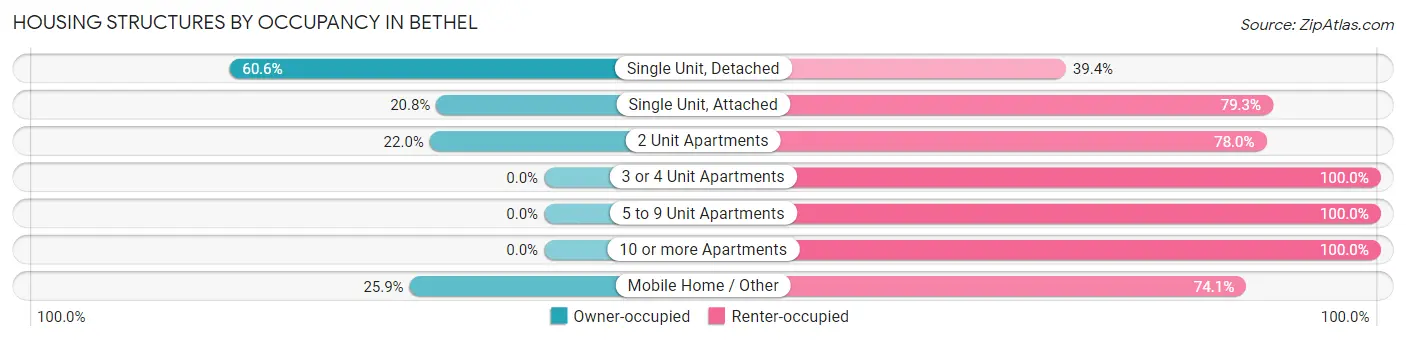
| Structure Type | Owner-occupied | Renter-occupied |
| Single Unit, Detached | 693 (60.6%) | 451 (39.4%) |
| Single Unit, Attached | 11 (20.7%) | 42 (79.2%) |
| 2 Unit Apartments | 59 (22.0%) | 209 (78.0%) |
| 3 or 4 Unit Apartments | 0 (0.0%) | 81 (100.0%) |
| 5 to 9 Unit Apartments | 0 (0.0%) | 8 (100.0%) |
| 10 or more Apartments | 0 (0.0%) | 244 (100.0%) |
| Mobile Home / Other | 36 (25.9%) | 103 (74.1%) |
| Total | 799 (41.2%) | 1,138 (58.8%) |
Housing Structures by Number of Rooms in Bethel
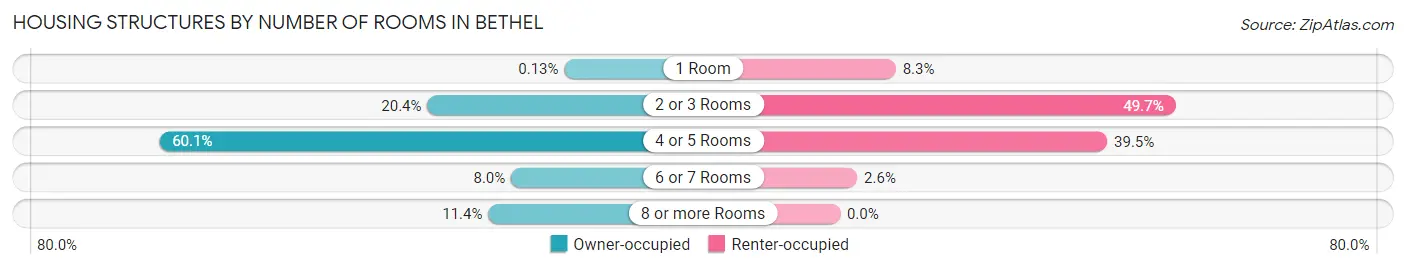
| Number of Rooms | Owner-occupied | Renter-occupied |
| 1 Room | 1 (0.1%) | 94 (8.3%) |
| 2 or 3 Rooms | 163 (20.4%) | 565 (49.6%) |
| 4 or 5 Rooms | 480 (60.1%) | 450 (39.5%) |
| 6 or 7 Rooms | 64 (8.0%) | 29 (2.5%) |
| 8 or more Rooms | 91 (11.4%) | 0 (0.0%) |
| Total | 799 (100.0%) | 1,138 (100.0%) |
Housing Structure by Heating Type in Bethel
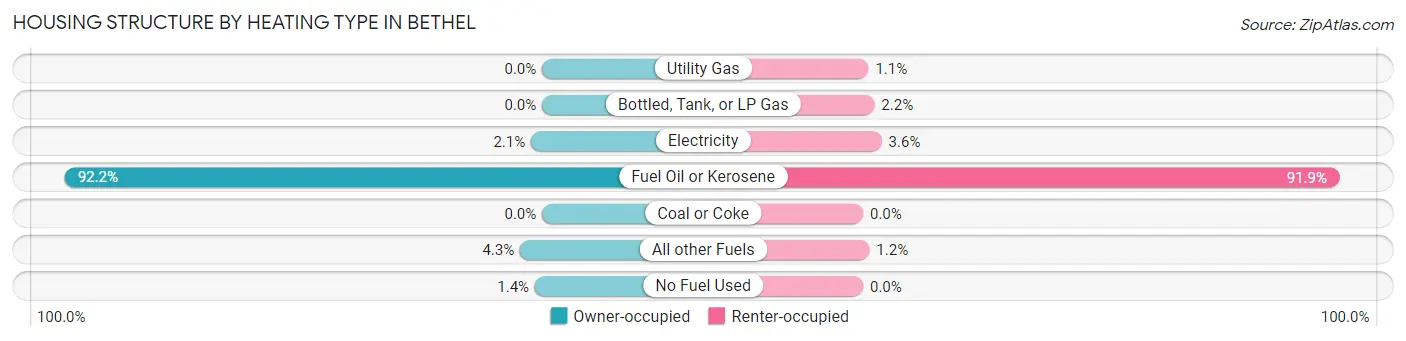
| Heating Type | Owner-occupied | Renter-occupied |
| Utility Gas | 0 (0.0%) | 12 (1.1%) |
| Bottled, Tank, or LP Gas | 0 (0.0%) | 25 (2.2%) |
| Electricity | 17 (2.1%) | 41 (3.6%) |
| Fuel Oil or Kerosene | 737 (92.2%) | 1,046 (91.9%) |
| Coal or Coke | 0 (0.0%) | 0 (0.0%) |
| All other Fuels | 34 (4.3%) | 14 (1.2%) |
| No Fuel Used | 11 (1.4%) | 0 (0.0%) |
| Total | 799 (100.0%) | 1,138 (100.0%) |
Household Vehicle Usage in Bethel
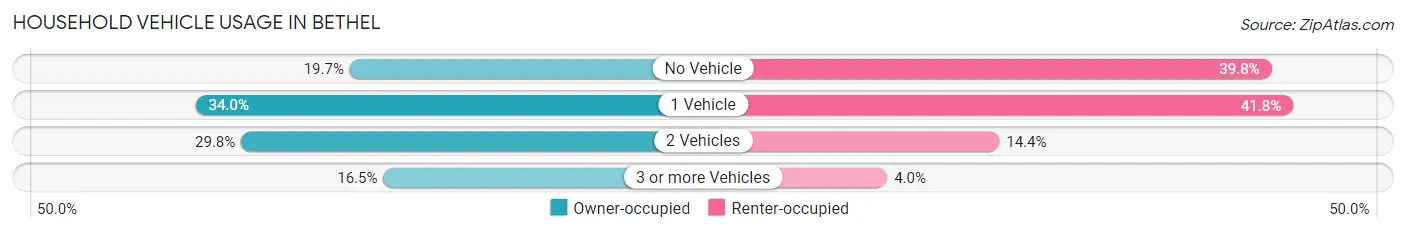
| Vehicles per Household | Owner-occupied | Renter-occupied |
| No Vehicle | 157 (19.7%) | 453 (39.8%) |
| 1 Vehicle | 272 (34.0%) | 476 (41.8%) |
| 2 Vehicles | 238 (29.8%) | 164 (14.4%) |
| 3 or more Vehicles | 132 (16.5%) | 45 (4.0%) |
| Total | 799 (100.0%) | 1,138 (100.0%) |
Real Estate & Mortgages in Bethel
Real Estate and Mortgage Overview in Bethel
| Characteristic | Without Mortgage | With Mortgage |
| Housing Units | 328 | 471 |
| Median Property Value | $306,500 | $369,700 |
| Median Household Income | $99,800 | $235 |
| Monthly Housing Costs | $787 | $103 |
| Real Estate Taxes | - | - |
Property Value by Mortgage Status in Bethel
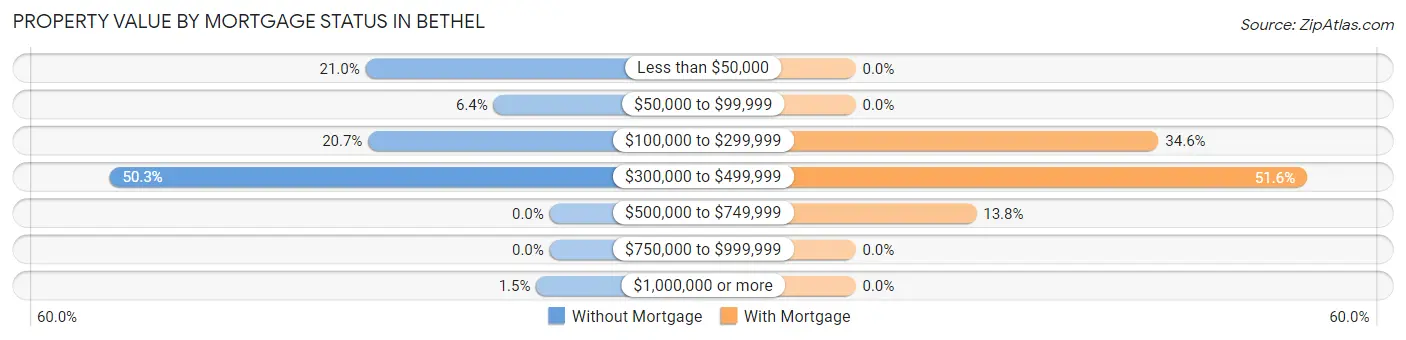
| Property Value | Without Mortgage | With Mortgage |
| Less than $50,000 | 69 (21.0%) | 0 (0.0%) |
| $50,000 to $99,999 | 21 (6.4%) | 0 (0.0%) |
| $100,000 to $299,999 | 68 (20.7%) | 163 (34.6%) |
| $300,000 to $499,999 | 165 (50.3%) | 243 (51.6%) |
| $500,000 to $749,999 | 0 (0.0%) | 65 (13.8%) |
| $750,000 to $999,999 | 0 (0.0%) | 0 (0.0%) |
| $1,000,000 or more | 5 (1.5%) | 0 (0.0%) |
| Total | 328 (100.0%) | 471 (100.0%) |
Household Income by Mortgage Status in Bethel
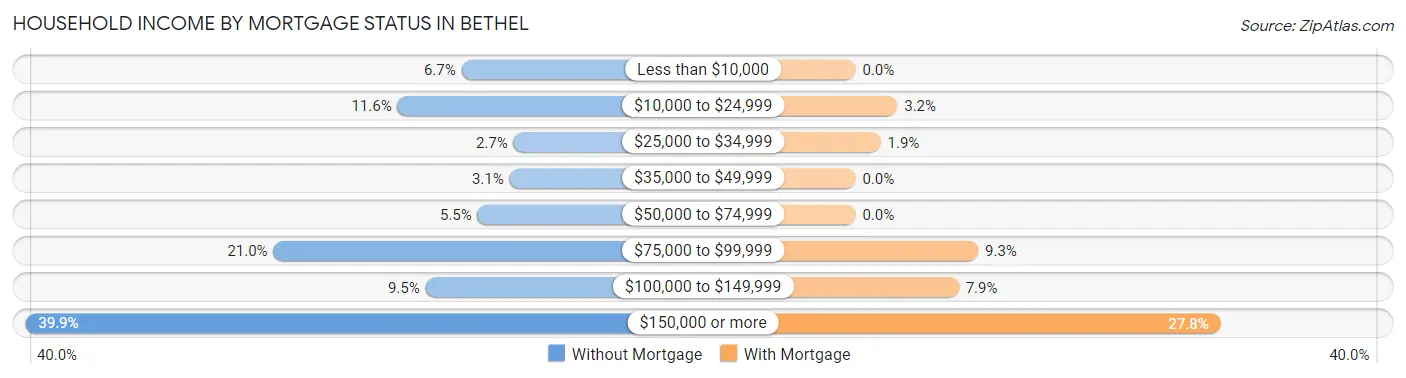
| Household Income | Without Mortgage | With Mortgage |
| Less than $10,000 | 22 (6.7%) | 0 (0.0%) |
| $10,000 to $24,999 | 38 (11.6%) | 15 (3.2%) |
| $25,000 to $34,999 | 9 (2.7%) | 9 (1.9%) |
| $35,000 to $49,999 | 10 (3.0%) | 0 (0.0%) |
| $50,000 to $74,999 | 18 (5.5%) | 0 (0.0%) |
| $75,000 to $99,999 | 69 (21.0%) | 44 (9.3%) |
| $100,000 to $149,999 | 31 (9.5%) | 37 (7.9%) |
| $150,000 or more | 131 (39.9%) | 131 (27.8%) |
| Total | 328 (100.0%) | 471 (100.0%) |
Property Value to Household Income Ratio in Bethel
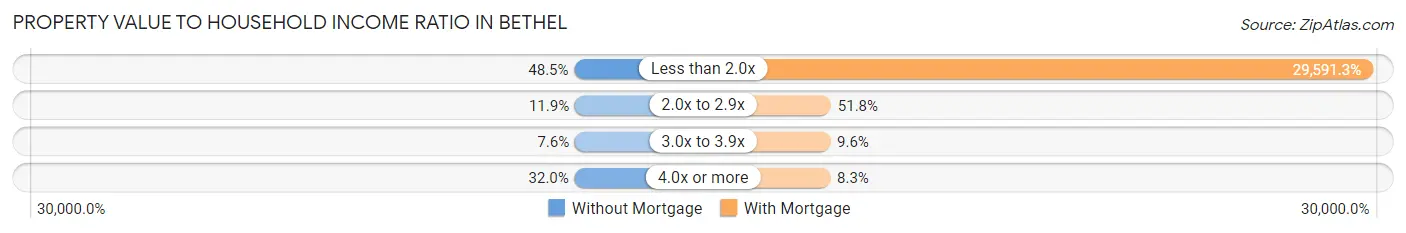
| Value-to-Income Ratio | Without Mortgage | With Mortgage |
| Less than 2.0x | 159 (48.5%) | 139,375 (29,591.3%) |
| 2.0x to 2.9x | 39 (11.9%) | 244 (51.8%) |
| 3.0x to 3.9x | 25 (7.6%) | 45 (9.6%) |
| 4.0x or more | 105 (32.0%) | 39 (8.3%) |
| Total | 328 (100.0%) | 471 (100.0%) |
Real Estate Taxes by Mortgage Status in Bethel
| Property Taxes | Without Mortgage | With Mortgage |
| Less than $800 | 0 (0.0%) | 0 (0.0%) |
| $800 to $1,499 | 0 (0.0%) | 0 (0.0%) |
| $800 to $1,499 | 0 (0.0%) | 0 (0.0%) |
| Total | 328 (100.0%) | 471 (100.0%) |
Health & Disability in Bethel
Health Insurance Coverage by Age in Bethel
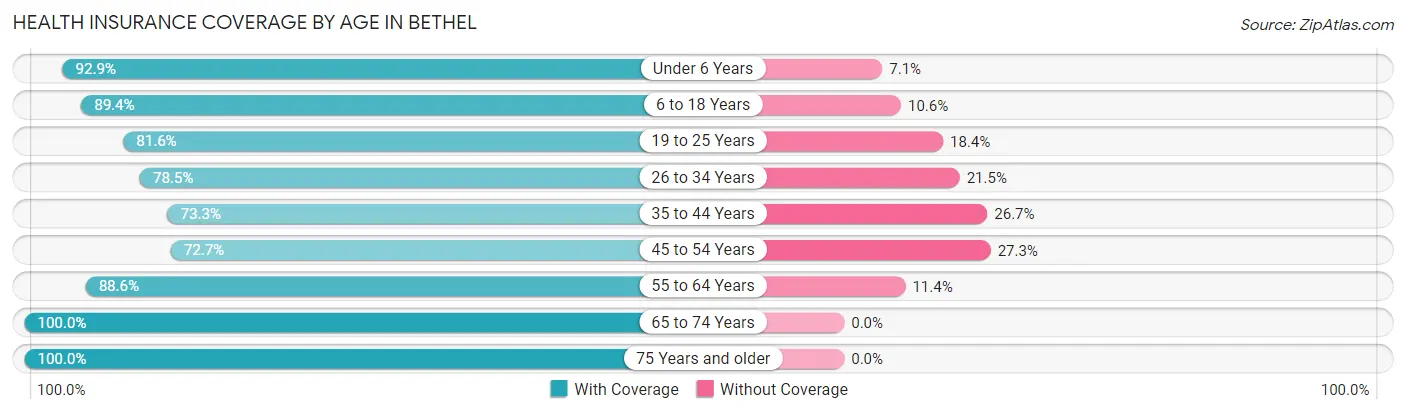
| Age Bracket | With Coverage | Without Coverage |
| Under 6 Years | 693 (92.9%) | 53 (7.1%) |
| 6 to 18 Years | 1,090 (89.4%) | 129 (10.6%) |
| 19 to 25 Years | 571 (81.6%) | 129 (18.4%) |
| 26 to 34 Years | 605 (78.5%) | 166 (21.5%) |
| 35 to 44 Years | 580 (73.3%) | 211 (26.7%) |
| 45 to 54 Years | 442 (72.7%) | 166 (27.3%) |
| 55 to 64 Years | 652 (88.6%) | 84 (11.4%) |
| 65 to 74 Years | 348 (100.0%) | 0 (0.0%) |
| 75 Years and older | 112 (100.0%) | 0 (0.0%) |
| Total | 5,093 (84.5%) | 938 (15.5%) |
Health Insurance Coverage by Citizenship Status in Bethel
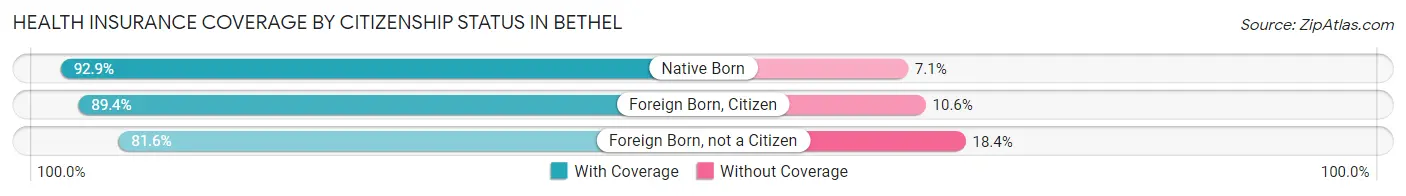
| Citizenship Status | With Coverage | Without Coverage |
| Native Born | 693 (92.9%) | 53 (7.1%) |
| Foreign Born, Citizen | 1,090 (89.4%) | 129 (10.6%) |
| Foreign Born, not a Citizen | 571 (81.6%) | 129 (18.4%) |
Health Insurance Coverage by Household Income in Bethel
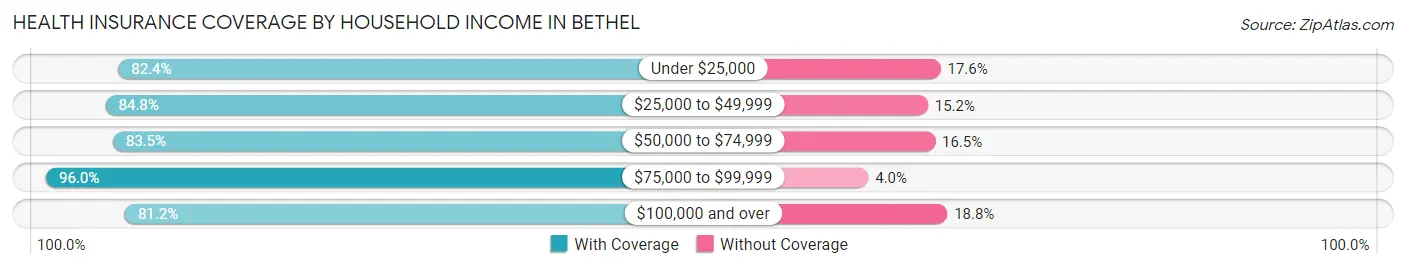
| Household Income | With Coverage | Without Coverage |
| Under $25,000 | 380 (82.4%) | 81 (17.6%) |
| $25,000 to $49,999 | 514 (84.8%) | 92 (15.2%) |
| $50,000 to $74,999 | 798 (83.5%) | 158 (16.5%) |
| $75,000 to $99,999 | 690 (96.0%) | 29 (4.0%) |
| $100,000 and over | 2,495 (81.2%) | 578 (18.8%) |
Public vs Private Health Insurance Coverage by Age in Bethel
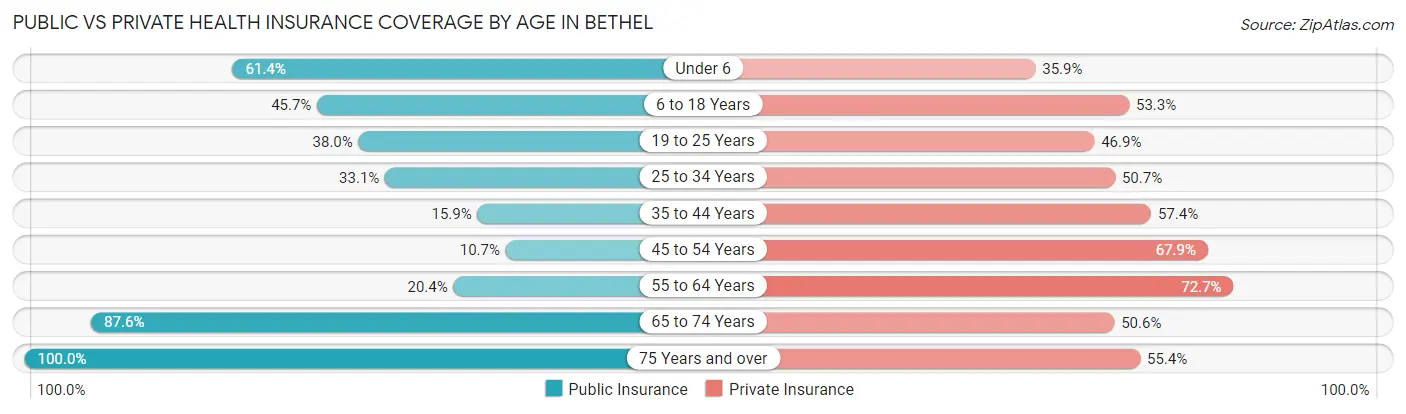
| Age Bracket | Public Insurance | Private Insurance |
| Under 6 | 458 (61.4%) | 268 (35.9%) |
| 6 to 18 Years | 557 (45.7%) | 650 (53.3%) |
| 19 to 25 Years | 266 (38.0%) | 328 (46.9%) |
| 25 to 34 Years | 255 (33.1%) | 391 (50.7%) |
| 35 to 44 Years | 126 (15.9%) | 454 (57.4%) |
| 45 to 54 Years | 65 (10.7%) | 413 (67.9%) |
| 55 to 64 Years | 150 (20.4%) | 535 (72.7%) |
| 65 to 74 Years | 305 (87.6%) | 176 (50.6%) |
| 75 Years and over | 112 (100.0%) | 62 (55.4%) |
| Total | 2,294 (38.0%) | 3,277 (54.3%) |
Disability Status by Sex by Age in Bethel
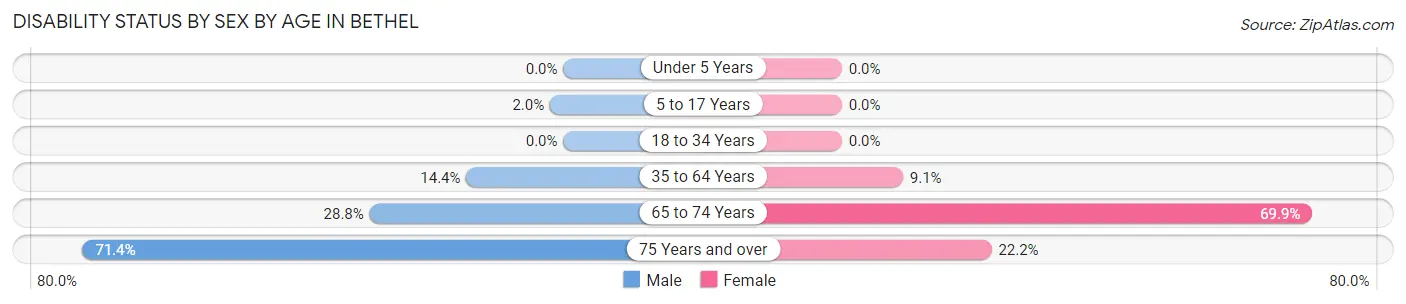
| Age Bracket | Male | Female |
| Under 5 Years | 0 (0.0%) | 0 (0.0%) |
| 5 to 17 Years | 13 (2.0%) | 0 (0.0%) |
| 18 to 34 Years | 0 (0.0%) | 0 (0.0%) |
| 35 to 64 Years | 147 (14.4%) | 101 (9.1%) |
| 65 to 74 Years | 61 (28.8%) | 95 (69.9%) |
| 75 Years and over | 35 (71.4%) | 14 (22.2%) |
Disability Class by Sex by Age in Bethel
Disability Class: Hearing Difficulty
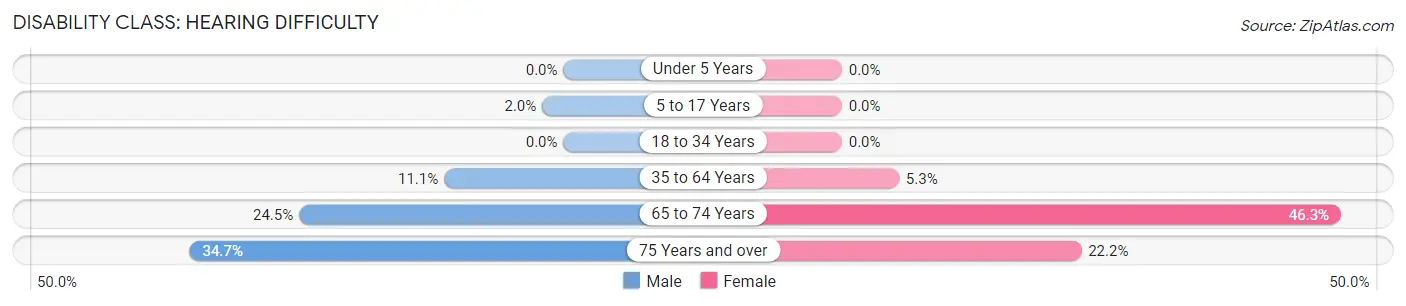
| Age Bracket | Male | Female |
| Under 5 Years | 0 (0.0%) | 0 (0.0%) |
| 5 to 17 Years | 13 (2.0%) | 0 (0.0%) |
| 18 to 34 Years | 0 (0.0%) | 0 (0.0%) |
| 35 to 64 Years | 113 (11.1%) | 59 (5.3%) |
| 65 to 74 Years | 52 (24.5%) | 63 (46.3%) |
| 75 Years and over | 17 (34.7%) | 14 (22.2%) |
Disability Class: Vision Difficulty
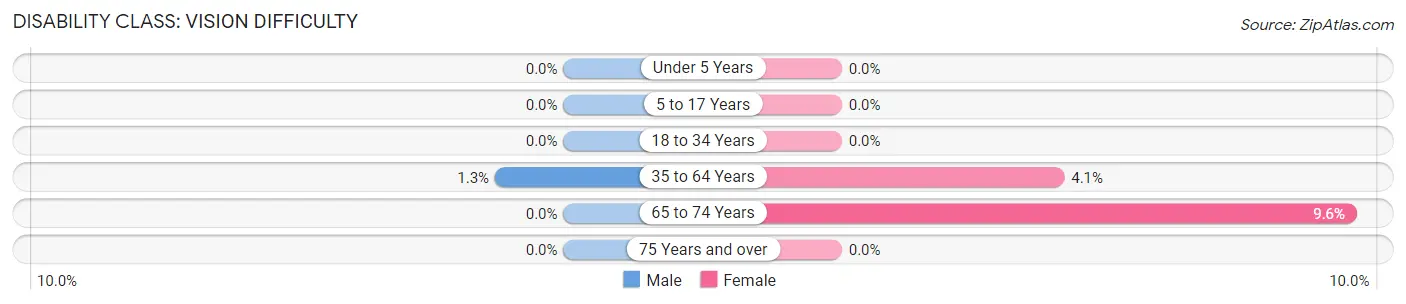
| Age Bracket | Male | Female |
| Under 5 Years | 0 (0.0%) | 0 (0.0%) |
| 5 to 17 Years | 0 (0.0%) | 0 (0.0%) |
| 18 to 34 Years | 0 (0.0%) | 0 (0.0%) |
| 35 to 64 Years | 13 (1.3%) | 46 (4.1%) |
| 65 to 74 Years | 0 (0.0%) | 13 (9.6%) |
| 75 Years and over | 0 (0.0%) | 0 (0.0%) |
Disability Class: Cognitive Difficulty
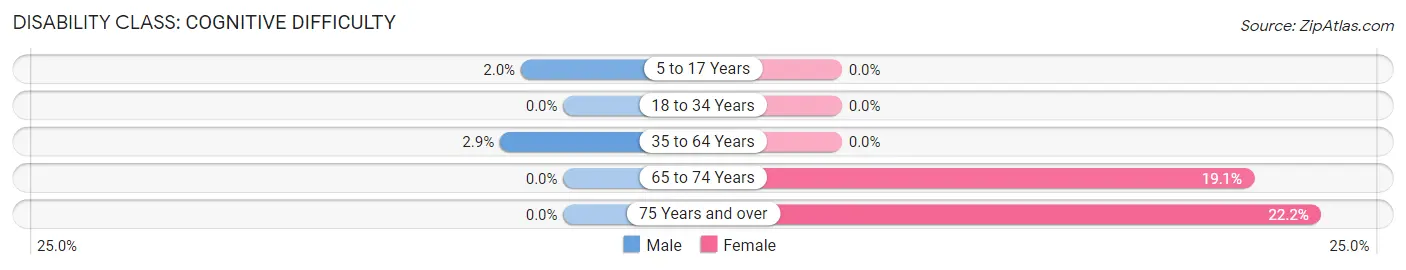
| Age Bracket | Male | Female |
| 5 to 17 Years | 13 (2.0%) | 0 (0.0%) |
| 18 to 34 Years | 0 (0.0%) | 0 (0.0%) |
| 35 to 64 Years | 30 (2.9%) | 0 (0.0%) |
| 65 to 74 Years | 0 (0.0%) | 26 (19.1%) |
| 75 Years and over | 0 (0.0%) | 14 (22.2%) |
Disability Class: Ambulatory Difficulty
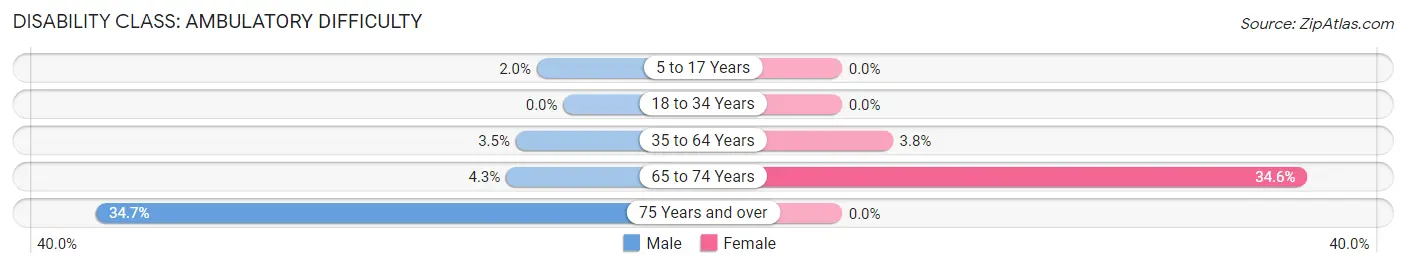
| Age Bracket | Male | Female |
| 5 to 17 Years | 13 (2.0%) | 0 (0.0%) |
| 18 to 34 Years | 0 (0.0%) | 0 (0.0%) |
| 35 to 64 Years | 36 (3.5%) | 42 (3.8%) |
| 65 to 74 Years | 9 (4.3%) | 47 (34.6%) |
| 75 Years and over | 17 (34.7%) | 0 (0.0%) |
Disability Class: Self-Care Difficulty
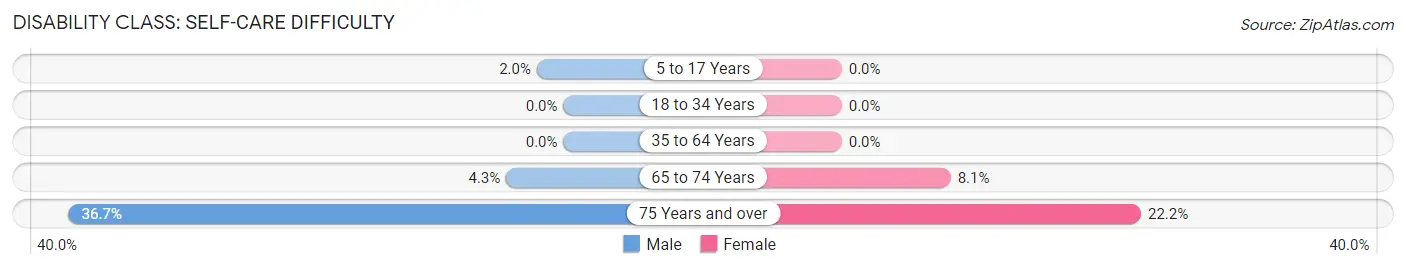
| Age Bracket | Male | Female |
| 5 to 17 Years | 13 (2.0%) | 0 (0.0%) |
| 18 to 34 Years | 0 (0.0%) | 0 (0.0%) |
| 35 to 64 Years | 0 (0.0%) | 0 (0.0%) |
| 65 to 74 Years | 9 (4.3%) | 11 (8.1%) |
| 75 Years and over | 18 (36.7%) | 14 (22.2%) |
Technology Access in Bethel
Computing Device Access in Bethel
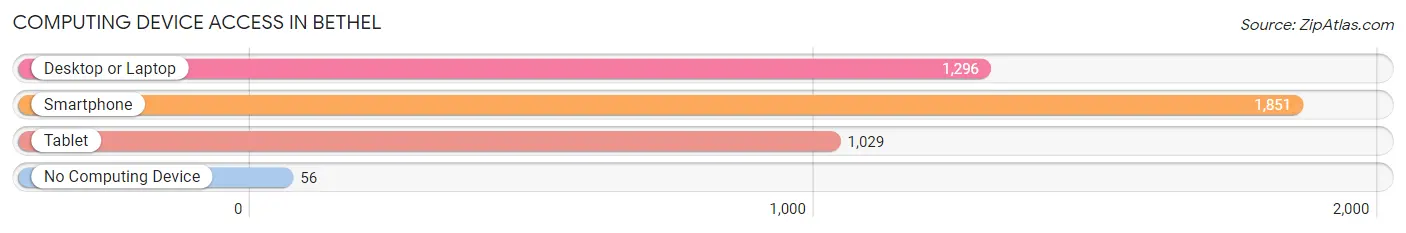
| Device Type | # Households | % Households |
| Desktop or Laptop | 1,296 | 66.9% |
| Smartphone | 1,851 | 95.6% |
| Tablet | 1,029 | 53.1% |
| No Computing Device | 56 | 2.9% |
| Total | 1,937 | 100.0% |
Internet Access in Bethel
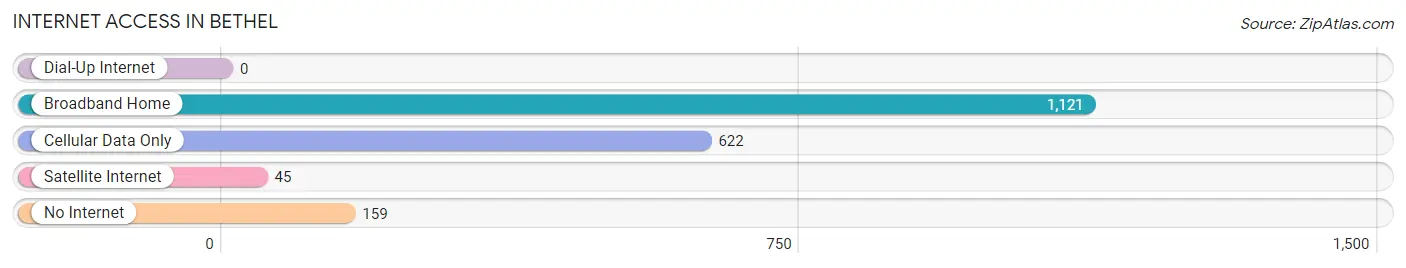
| Internet Type | # Households | % Households |
| Dial-Up Internet | 0 | 0.0% |
| Broadband Home | 1,121 | 57.9% |
| Cellular Data Only | 622 | 32.1% |
| Satellite Internet | 45 | 2.3% |
| No Internet | 159 | 8.2% |
| Total | 1,937 | 100.0% |
Bethel Summary
Bethel, Alaska is a city located in the southwestern part of the state, in the Yukon-Kuskokwim Delta region. It is the largest community in the region, with a population of 6,080 as of the 2010 census. Bethel is the hub of the Yukon-Kuskokwim Delta, and serves as the regional center for commerce, transportation, health care, and government services.
History
Bethel was first established in 1885 as a trading post by the Alaska Commercial Company. The town was named after the nearby Bethel Mission, which was founded by Moravian missionaries in 1885. The mission was established to serve the Yup'ik people of the region, and was the first permanent settlement in the area.
In the early 1900s, Bethel began to grow as a commercial center for the region. The Alaska Railroad was extended to Bethel in 1923, and the town became a hub for transportation and commerce. In the 1950s, the U.S. Air Force built an air base near Bethel, which further increased the town's population and economic activity.
Geography
Bethel is located in the Yukon-Kuskokwim Delta region of southwestern Alaska. The city is situated on the Kuskokwim River, about 30 miles from the Bering Sea. The terrain is mostly flat, with some low hills and ridges. The climate is subarctic, with long, cold winters and short, cool summers.
Economy
Bethel's economy is largely based on government services, health care, and transportation. The city is the regional hub for commerce, transportation, health care, and government services. The city is also home to a number of businesses, including retail stores, restaurants, and hotels.
The city is also home to a number of industries, including fishing, mining, and timber. The Bethel Airport is a major hub for air transportation in the region, and serves as a gateway to the rest of Alaska.
Demographics
As of the 2010 census, Bethel had a population of 6,080. The racial makeup of the city was 58.3% Native American, 28.2% White, 5.2% Asian, and 8.3% from other races. The median household income was $50,945, and the median family income was $60,945.
Bethel is home to a number of Native American tribes, including the Yup'ik, Cup'ik, and Inupiat. The city is also home to a large number of immigrants from Russia, the Philippines, and other countries.
Conclusion
Bethel, Alaska is a city located in the southwestern part of the state, in the Yukon-Kuskokwim Delta region. It is the largest community in the region, with a population of 6,080 as of the 2010 census. Bethel is the hub of the Yukon-Kuskokwim Delta, and serves as the regional center for commerce, transportation, health care, and government services. The city's economy is largely based on government services, health care, and transportation, and it is home to a number of Native American tribes, as well as immigrants from Russia, the Philippines, and other countries.
Common Questions
What is the Total Population of Bethel?
Total Population of Bethel is 6,312.
What is the Total Male Population of Bethel?
Total Male Population of Bethel is 3,434.
What is the Total Female Population of Bethel?
Total Female Population of Bethel is 2,878.
What is the Ratio of Males per 100 Females in Bethel?
There are 119.32 Males per 100 Females in Bethel.
What is the Ratio of Females per 100 Males in Bethel?
There are 83.81 Females per 100 Males in Bethel.
What is the Median Population Age in Bethel?
Median Population Age in Bethel is 30.8 Years.
What is the Average Family Size in Bethel
Average Family Size in Bethel is 3.8 People.
What is the Average Household Size in Bethel
Average Household Size in Bethel is 3.0 People.
What is Per Capita Income in Bethel?
Per Capita income in Bethel is $37,790.
What is the Median Family Income in Bethel?
Median Family Income in Bethel is $110,897.
What is the Median Household income in Bethel?
Median Household Income in Bethel is $100,852.
What is Income or Wage Gap in Bethel?
Income or Wage Gap in Bethel is 28.3%.
Women in Bethel earn 71.7 cents for every dollar earned by a man.
What is Inequality or Gini Index in Bethel?
Inequality or Gini Index in Bethel is 0.39.
How Large is the Labor Force in Bethel?
There are 3,086 People in the Labor Forcein in Bethel.
What is the Percentage of People in the Labor Force in Bethel?
67.5% of People are in the Labor Force in Bethel.
What is the Unemployment Rate in Bethel?
Unemployment Rate in Bethel is 8.9%.