Zip Codes with the Highest Percentage of Population with a Degree in Visual and Performing Arts in Lynnwood, WA
RELATED REPORTS & OPTIONS
Visual and Performing Arts
Lynnwood
Compare Zip Codes
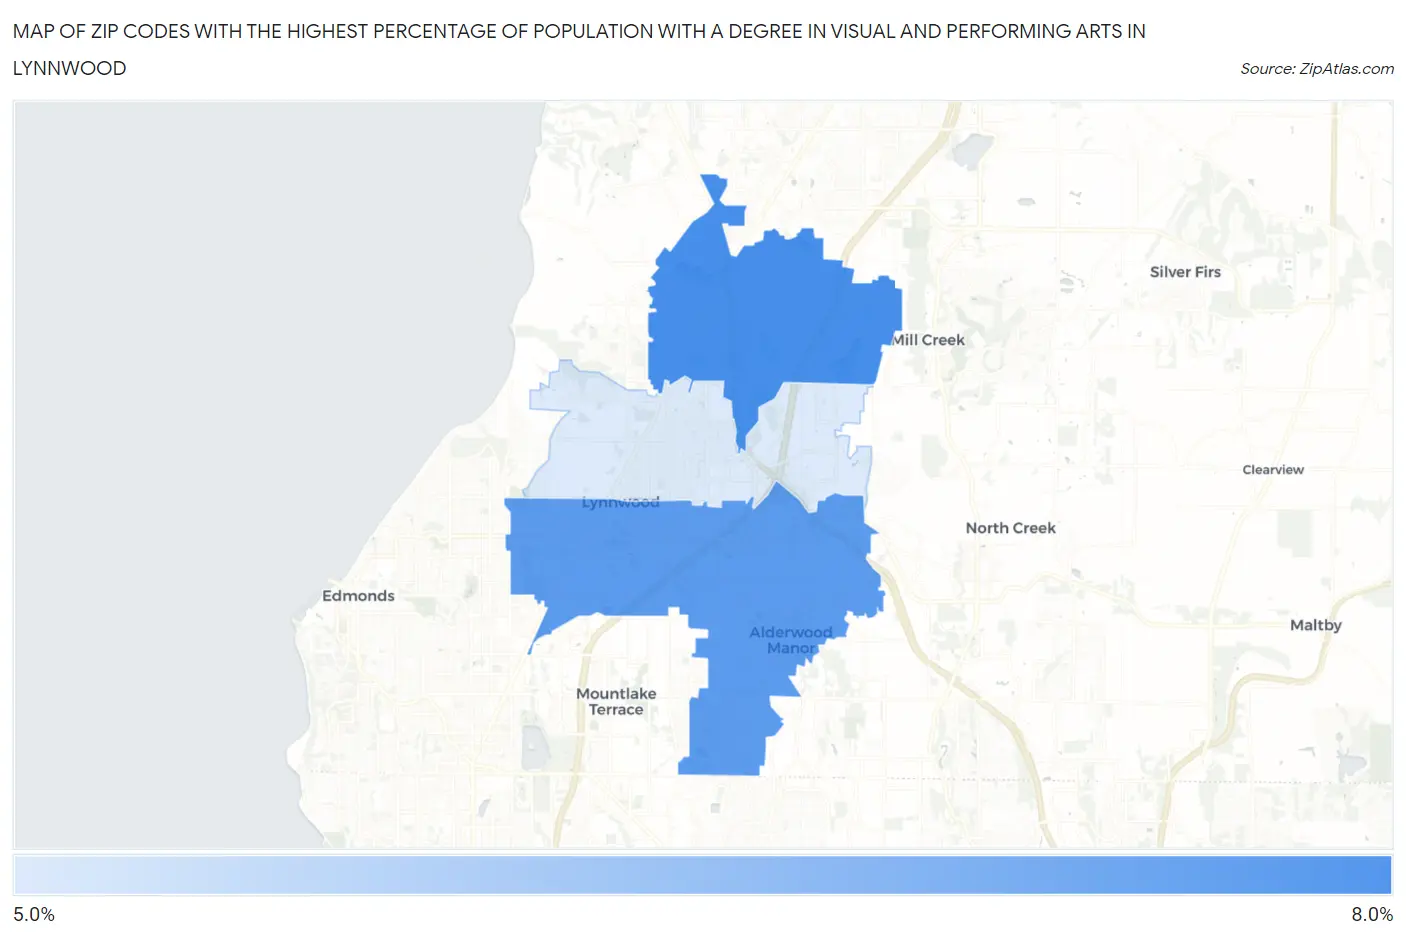
Map of Zip Codes with the Highest Percentage of Population with a Degree in Visual and Performing Arts in Lynnwood
0.0%
8.0%
Zip Codes with the Highest Percentage of Population with a Degree in Visual and Performing Arts in Lynnwood, WA
| Zip Code | % Graduates | vs State | vs National | |
| 1. | 98087 | 7.2% | 4.6%(+2.61)#87 | 4.3%(+2.98)#3,446 |
| 2. | 98036 | 7.0% | 4.6%(+2.40)#93 | 4.3%(+2.77)#3,644 |
| 3. | 98037 | 5.6% | 4.6%(+1.03)#137 | 4.3%(+1.40)#5,414 |
1
Common Questions
What are the Top Zip Codes with the Highest Percentage of Population with a Degree in Visual and Performing Arts in Lynnwood, WA?
Top Zip Codes with the Highest Percentage of Population with a Degree in Visual and Performing Arts in Lynnwood, WA are:
What zip code has the Highest Percentage of Population with a Degree in Visual and Performing Arts in Lynnwood, WA?
98087 has the Highest Percentage of Population with a Degree in Visual and Performing Arts in Lynnwood, WA with 7.2%.
What is the Percentage of Population with a Degree in Visual and Performing Arts in Lynnwood, WA?
Percentage of Population with a Degree in Visual and Performing Arts in Lynnwood is 4.8%.
What is the Percentage of Population with a Degree in Visual and Performing Arts in Washington?
Percentage of Population with a Degree in Visual and Performing Arts in Washington is 4.6%.
What is the Percentage of Population with a Degree in Visual and Performing Arts in the United States?
Percentage of Population with a Degree in Visual and Performing Arts in the United States is 4.3%.