Zip Codes with the Highest Percentage of Population with a Degree in Visual and Performing Arts in Port Angeles, WA
RELATED REPORTS & OPTIONS
Visual and Performing Arts
Port Angeles
Compare Zip Codes
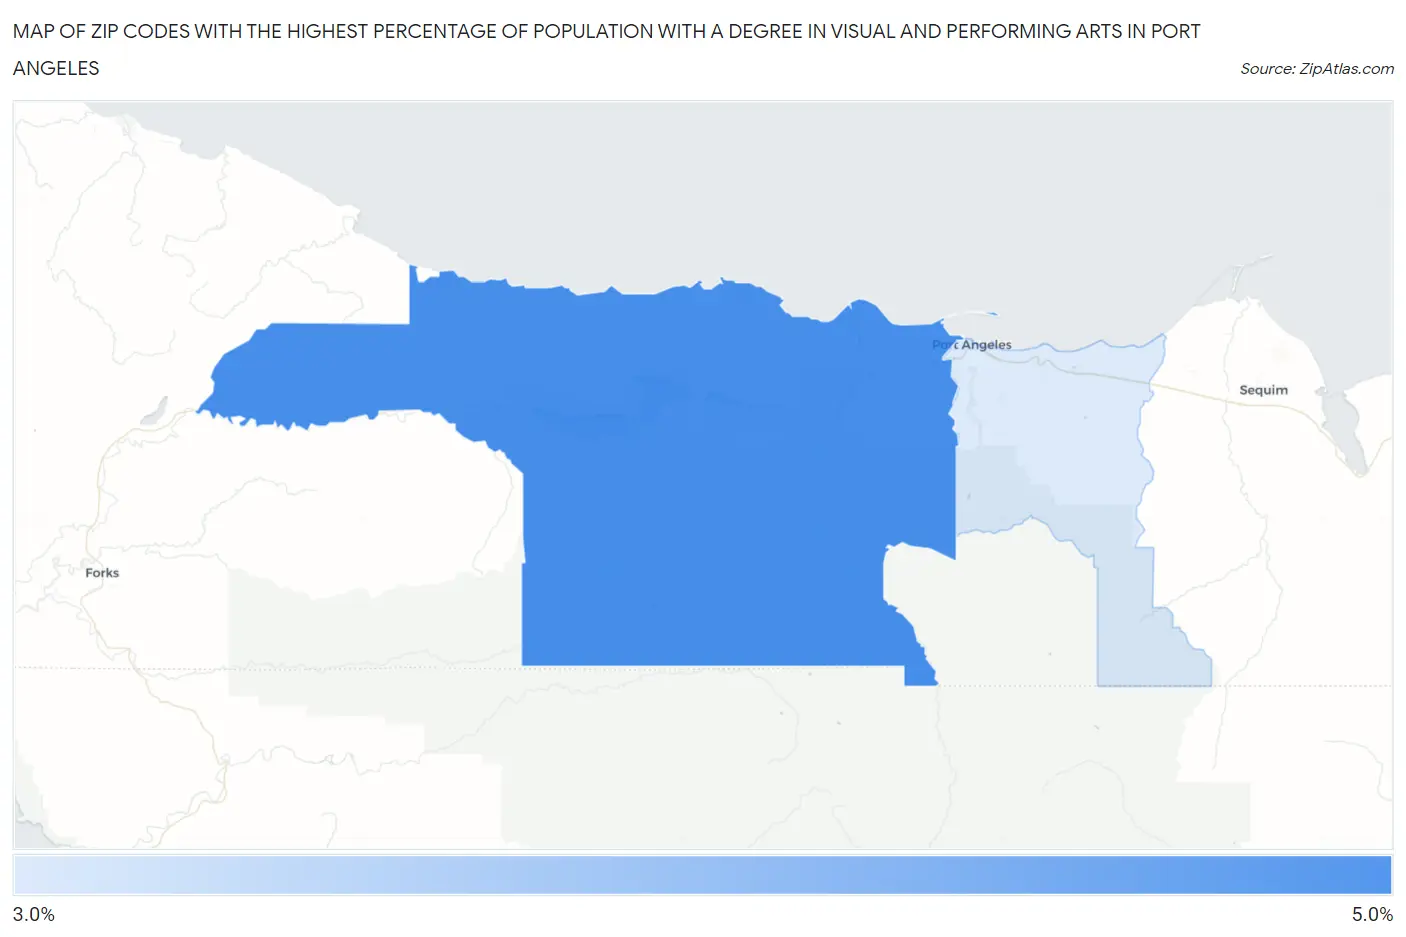
Map of Zip Codes with the Highest Percentage of Population with a Degree in Visual and Performing Arts in Port Angeles
0.0%
5.0%
Zip Codes with the Highest Percentage of Population with a Degree in Visual and Performing Arts in Port Angeles, WA
| Zip Code | % Graduates | vs State | vs National | |
| 1. | 98363 | 4.1% | 4.6%(-0.567)#240 | 4.3%(-0.200)#9,078 |
| 2. | 98362 | 3.8% | 4.6%(-0.861)#252 | 4.3%(-0.494)#9,982 |
1
Common Questions
What are the Top Zip Codes with the Highest Percentage of Population with a Degree in Visual and Performing Arts in Port Angeles, WA?
Top Zip Codes with the Highest Percentage of Population with a Degree in Visual and Performing Arts in Port Angeles, WA are:
What zip code has the Highest Percentage of Population with a Degree in Visual and Performing Arts in Port Angeles, WA?
98363 has the Highest Percentage of Population with a Degree in Visual and Performing Arts in Port Angeles, WA with 4.1%.
What is the Percentage of Population with a Degree in Visual and Performing Arts in Port Angeles, WA?
Percentage of Population with a Degree in Visual and Performing Arts in Port Angeles is 3.1%.
What is the Percentage of Population with a Degree in Visual and Performing Arts in Washington?
Percentage of Population with a Degree in Visual and Performing Arts in Washington is 4.6%.
What is the Percentage of Population with a Degree in Visual and Performing Arts in the United States?
Percentage of Population with a Degree in Visual and Performing Arts in the United States is 4.3%.