Zip Codes with the Highest Percentage of Population Employed in Community & Social Service in Lynnwood, WA

RELATED REPORTS & OPTIONS

Community & Social Service
Population
Families and Households
Female Fertility
Female Fertility (Unmarried)
Race (Community Size)
Race (Percentage)
Ancestry (Community Size)
AfghanAfricanAlaskan AthabascanAmericanApacheArabArmenianAustrianBelgianBhutaneseBlackfeetBrazilianBritishBulgarianBurmeseCambodianCanadianCentral AmericanCherokeeChileanChippewaChoctawColombianColvilleComancheCosta RicanCroatianCubanCzechCzechoslovakianDanishDutchEastern EuropeanEgyptianEnglishEthiopianEuropeanFilipinoFinnishFrenchFrench CanadianGermanGreekGuamanian / ChamorroGuatemalanHonduranHungarianIcelanderIndian (Asian)IndonesianInupiatIranianIrishIroquoisItalianJamaicanJapaneseKoreanLaotianLebaneseLithuanianMalaysianMexicanMexican American IndianNative HawaiianNicaraguanNigerianNorthern EuropeanNorwegianOsagePakistaniPalestinianPennsylvania GermanPeruvianPolishPortuguesePuerto RicanPuget Sound SalishRomanianRussianSalvadoranSamoanScandinavianScotch-IrishScottishSerbianSiouxSlovakSouth AmericanSpaniardSpanishSri LankanSubsaharan AfricanSwedishSwissThaiTlingit-HaidaTurkishUkrainianVenezuelanVietnameseWelshYakamaYugoslavian
Ancestry (Percentage)
AfghanAfricanAlaskan AthabascanAmericanApacheArabArmenianAustrianBelgianBhutaneseBlackfeetBrazilianBritishBulgarianBurmeseCambodianCanadianCentral AmericanCherokeeChileanChippewaChoctawColombianColvilleComancheCosta RicanCroatianCubanCzechCzechoslovakianDanishDutchEastern EuropeanEgyptianEnglishEthiopianEuropeanFilipinoFinnishFrenchFrench CanadianGermanGreekGuamanian / ChamorroGuatemalanHonduranHungarianIcelanderIndian (Asian)IndonesianInupiatIranianIrishIroquoisItalianJamaicanJapaneseKoreanLaotianLebaneseLithuanianMalaysianMexicanMexican American IndianNative HawaiianNicaraguanNigerianNorthern EuropeanNorwegianOsagePakistaniPalestinianPennsylvania GermanPeruvianPolishPortuguesePuerto RicanPuget Sound SalishRomanianRussianSalvadoranSamoanScandinavianScotch-IrishScottishSerbianSiouxSlovakSouth AmericanSpaniardSpanishSri LankanSubsaharan AfricanSwedishSwissThaiTlingit-HaidaTurkishUkrainianVenezuelanVietnameseWelshYakamaYugoslavian
Immigrant Origin (Total)
Immigrant Origin (Percentage)
Income
Income (Families)
Income (Households)
Poverty
Poverty (Families)
Unemployment
Employment Occupations
Employment Industries
Employer Class
Commute Time
Commute Means
School Enrollment
Education by Degree Field
Occupancy
Finances
Physical Characteristics
Lynnwood
Compare Zip Codes
Comparison Subject

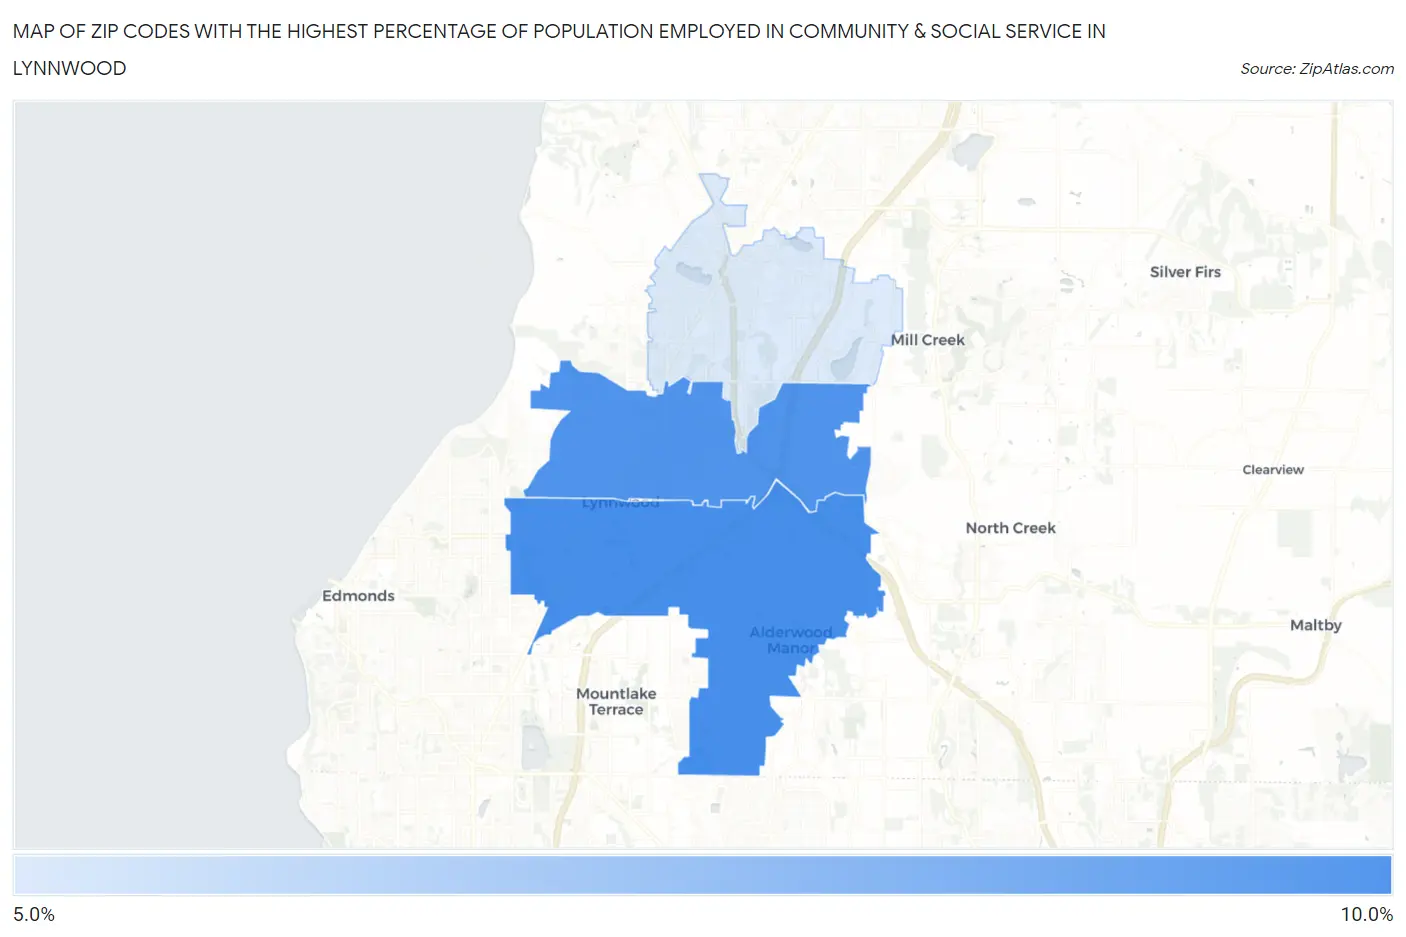
Map of Zip Codes with the Highest Percentage of Population Employed in Community & Social Service in Lynnwood

0.0%
10.0%
Zip Codes with the Highest Percentage of Population Employed in Community & Social Service  in Lynnwood Map

Zip Codes with the Highest Percentage of Population Employed in Community & Social Service in Lynnwood, WA

Zip Code % Employed vs State vs National
1.980369.7%10.7%(-0.992)#31311.2%(-1.49)#14,805
2.980379.5%10.7%(-1.22)#32511.2%(-1.72)#15,423
3.980875.8%10.7%(-4.95)#47511.2%(-5.45)#24,854

Common Questions

What are the Top Zip Codes with the Highest Percentage of Population Employed in Community & Social Service in Lynnwood, WA?
Top Zip Codes with the Highest Percentage of Population Employed in Community & Social Service in Lynnwood, WA are:
#1
9.7%
#2
9.5%
#3
5.8%
What zip code has the Highest Percentage of Population Employed in Community & Social Service in Lynnwood, WA?
98036 has the Highest Percentage of Population Employed in Community & Social Service in Lynnwood, WA with 9.7%.
What is the Percentage of Population Employed in Community & Social Service in Lynnwood, WA?
Percentage of Population Employed in Community & Social Service in Lynnwood is 9.2%.
What is the Percentage of Population Employed in Community & Social Service in Washington?
Percentage of Population Employed in Community & Social Service in Washington is 10.7%.
What is the Percentage of Population Employed in Community & Social Service in the United States?
Percentage of Population Employed in Community & Social Service in the United States is 11.2%.