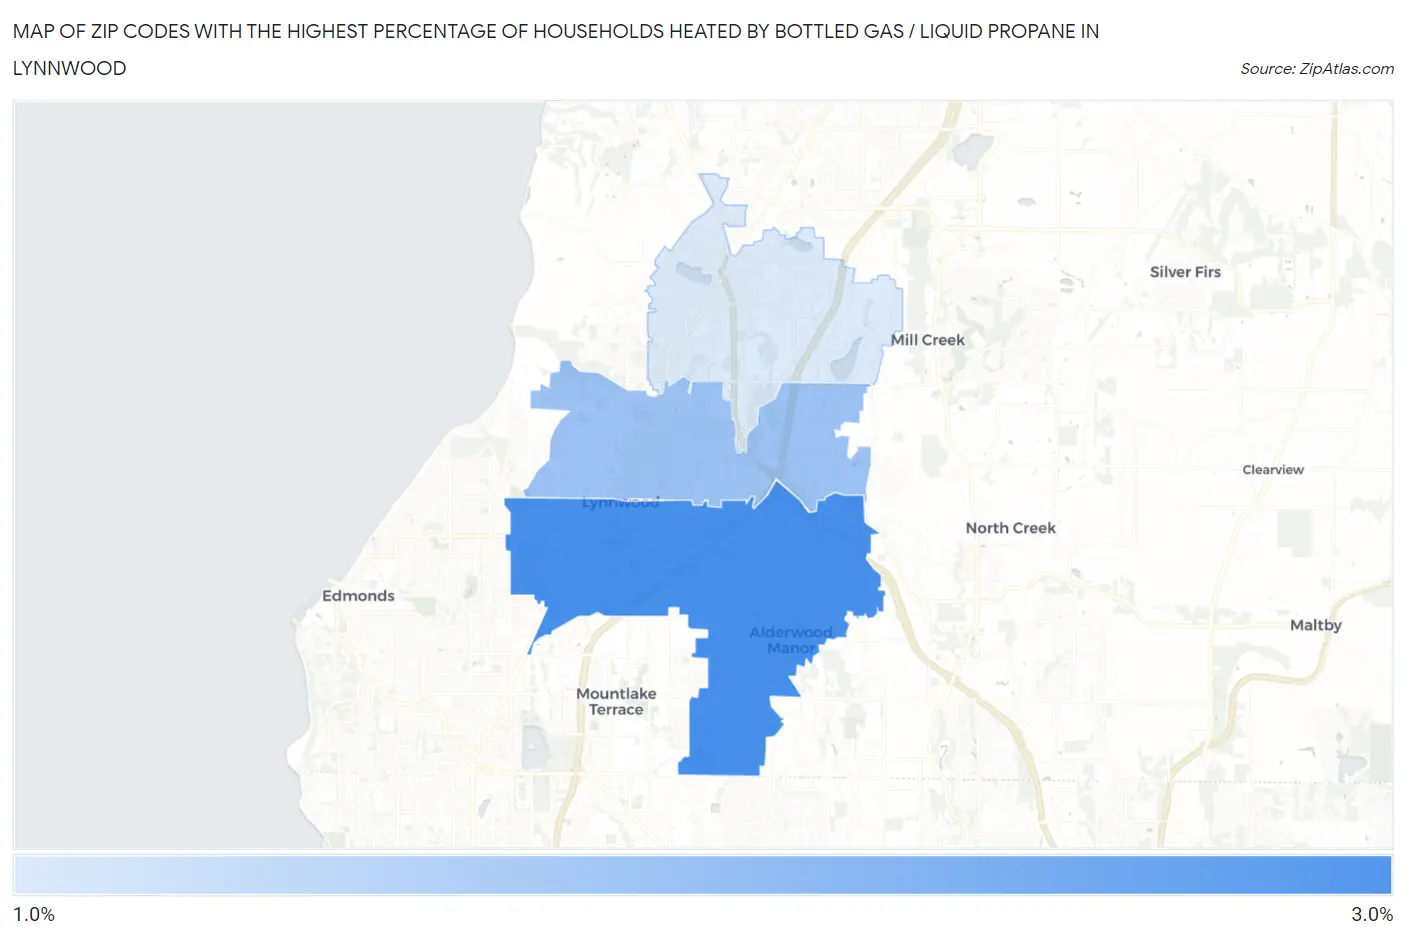
Zip Codes with the Highest Percentage of Households Heated by Bottled Gas / Liquid Propane in Lynnwood, WA
RELATED REPORTS & OPTIONS
Bottled Gas / LP Heating
Lynnwood
Compare Zip Codes
Map of Zip Codes with the Highest Percentage of Households Heated by Bottled Gas / Liquid Propane in Lynnwood
0.0%
3.0%
Zip Codes with the Highest Percentage of Households Heated by Bottled Gas / Liquid Propane in Lynnwood, WA
| Zip Code | Bottled Gas / LP Heating | vs State | vs National | |
| 1. | 98036 | 3.0% | 3.1%(-0.100)#248 | 4.9%(-1.90)#20,992 |
| 2. | 98037 | 1.9% | 3.1%(-1.20)#313 | 4.9%(-3.00)#23,461 |
| 3. | 98087 | 1.1% | 3.1%(-2.00)#386 | 4.9%(-3.80)#26,178 |
1
Common Questions
What are the Top Zip Codes with the Highest Percentage of Households Heated by Bottled Gas / Liquid Propane in Lynnwood, WA?
Top Zip Codes with the Highest Percentage of Households Heated by Bottled Gas / Liquid Propane in Lynnwood, WA are:
What zip code has the Highest Percentage of Households Heated by Bottled Gas / Liquid Propane in Lynnwood, WA?
98036 has the Highest Percentage of Households Heated by Bottled Gas / Liquid Propane in Lynnwood, WA with 3.0%.
What is the Percentage of Households Heated by Bottled Gas / Liquid Propane in Lynnwood, WA?
Percentage of Households Heated by Bottled Gas / Liquid Propane in Lynnwood is 3.2%.
What is the Percentage of Households Heated by Bottled Gas / Liquid Propane in Washington?
Percentage of Households Heated by Bottled Gas / Liquid Propane in Washington is 3.1%.
What is the Percentage of Households Heated by Bottled Gas / Liquid Propane in the United States?
Percentage of Households Heated by Bottled Gas / Liquid Propane in the United States is 4.9%.