Zip Codes with the Highest Percentage of Population with a Degree in Visual and Performing Arts in Bellingham, WA
RELATED REPORTS & OPTIONS
Visual and Performing Arts
Bellingham
Compare Zip Codes
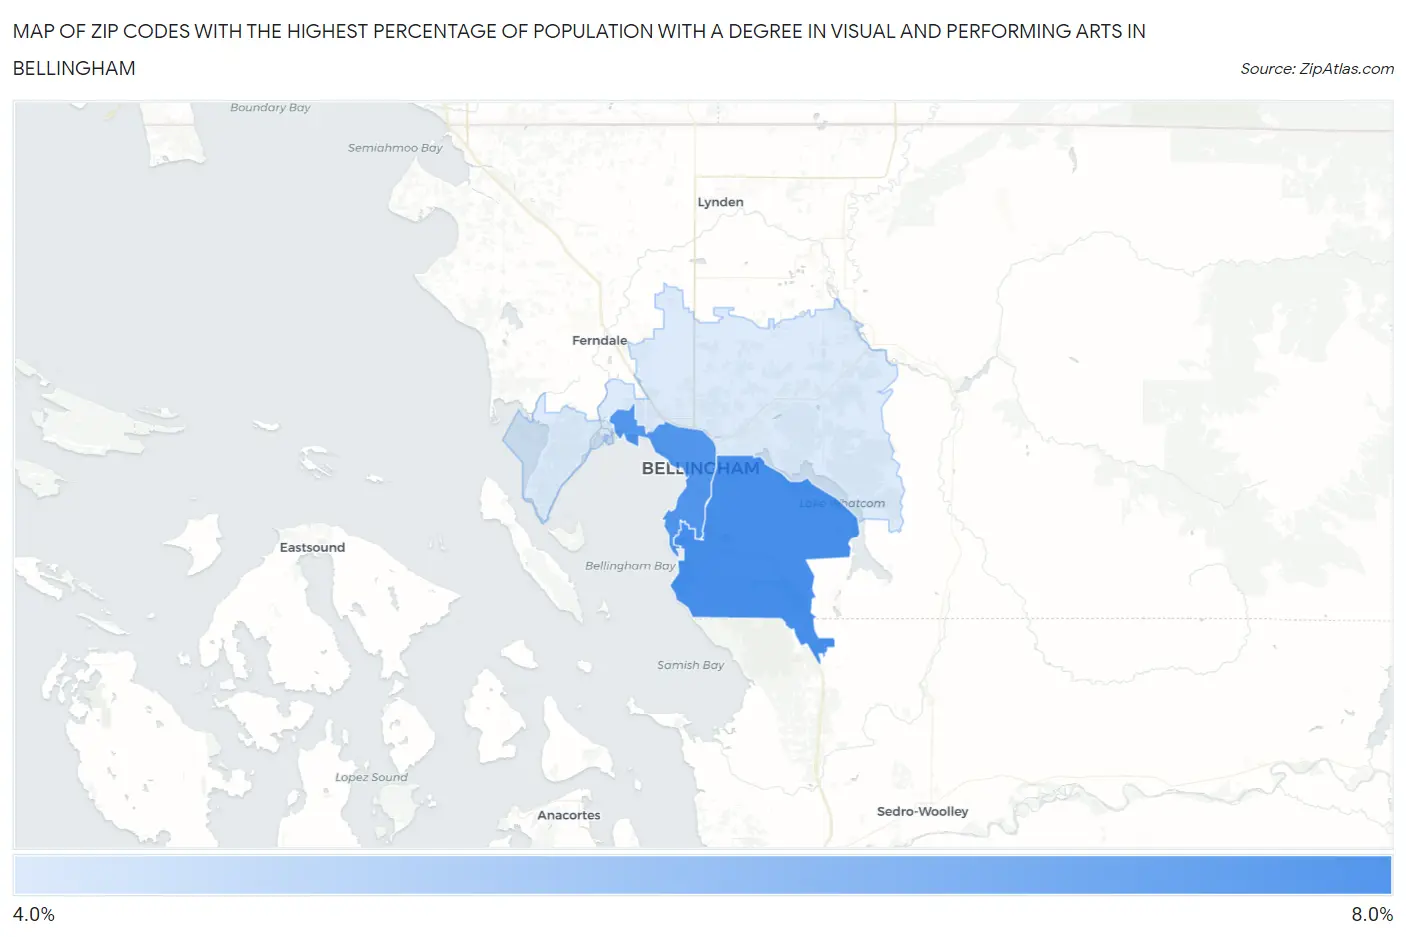
Map of Zip Codes with the Highest Percentage of Population with a Degree in Visual and Performing Arts in Bellingham
0.0%
8.0%
Zip Codes with the Highest Percentage of Population with a Degree in Visual and Performing Arts in Bellingham, WA
| Zip Code | % Graduates | vs State | vs National | |
| 1. | 98229 | 6.1% | 4.6%(+1.46)#119 | 4.3%(+1.83)#4,756 |
| 2. | 98225 | 6.0% | 4.6%(+1.34)#124 | 4.3%(+1.70)#4,934 |
| 3. | 98226 | 4.3% | 4.6%(-0.288)#214 | 4.3%(+0.079)#8,267 |
1
Common Questions
What are the Top Zip Codes with the Highest Percentage of Population with a Degree in Visual and Performing Arts in Bellingham, WA?
Top Zip Codes with the Highest Percentage of Population with a Degree in Visual and Performing Arts in Bellingham, WA are:
What zip code has the Highest Percentage of Population with a Degree in Visual and Performing Arts in Bellingham, WA?
98229 has the Highest Percentage of Population with a Degree in Visual and Performing Arts in Bellingham, WA with 6.1%.
What is the Percentage of Population with a Degree in Visual and Performing Arts in Bellingham, WA?
Percentage of Population with a Degree in Visual and Performing Arts in Bellingham is 6.0%.
What is the Percentage of Population with a Degree in Visual and Performing Arts in Washington?
Percentage of Population with a Degree in Visual and Performing Arts in Washington is 4.6%.
What is the Percentage of Population with a Degree in Visual and Performing Arts in the United States?
Percentage of Population with a Degree in Visual and Performing Arts in the United States is 4.3%.