Zip Codes with the Highest Percentage of Population with a Degree in Visual and Performing Arts in Port Orchard, WA
RELATED REPORTS & OPTIONS
Visual and Performing Arts
Port Orchard
Compare Zip Codes
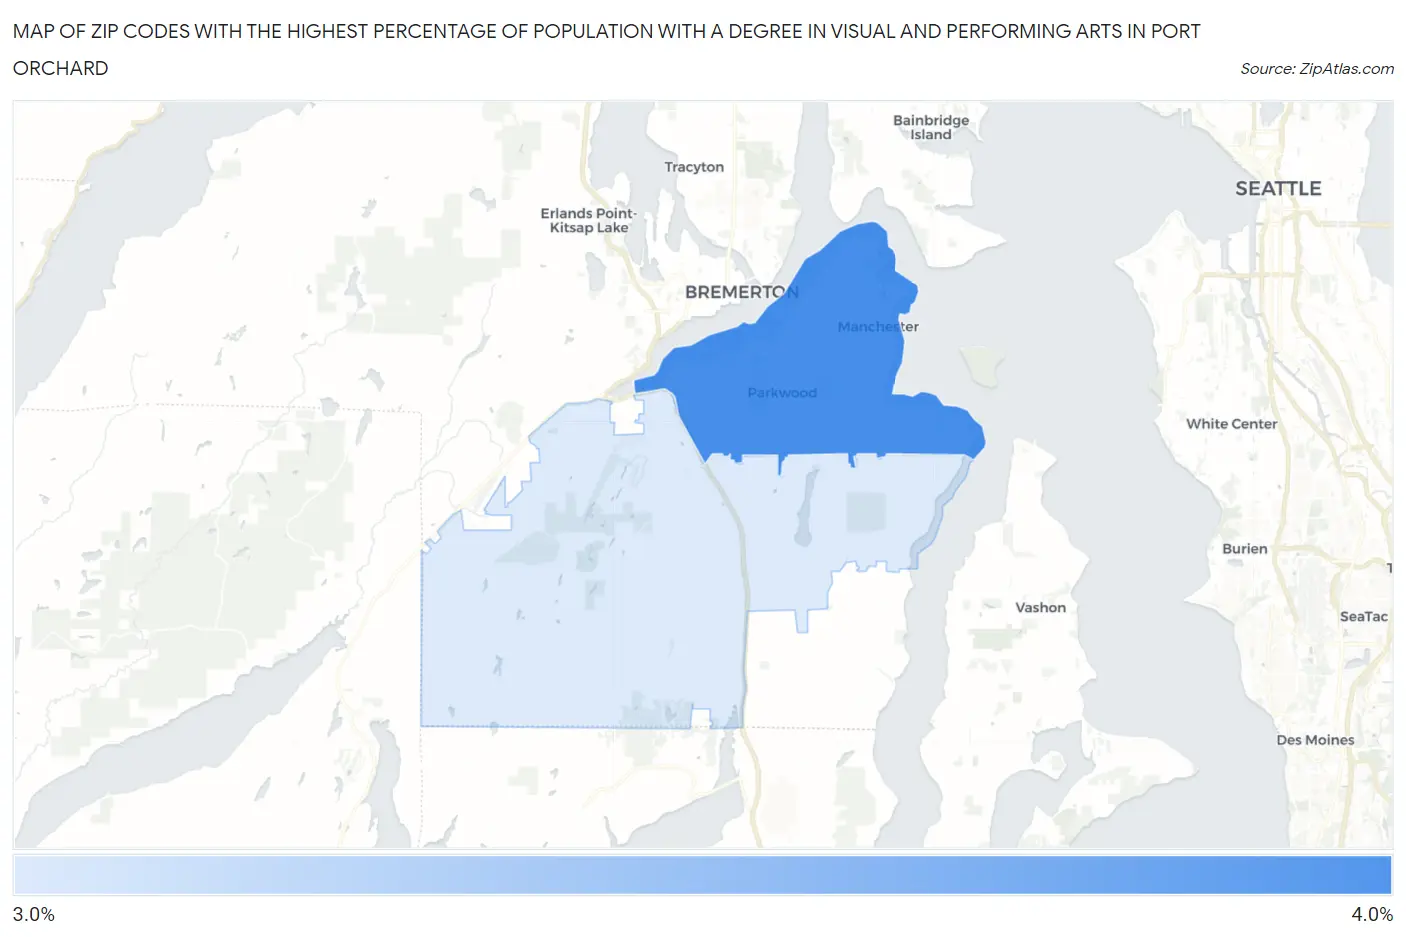
Map of Zip Codes with the Highest Percentage of Population with a Degree in Visual and Performing Arts in Port Orchard
0.0%
4.0%
Zip Codes with the Highest Percentage of Population with a Degree in Visual and Performing Arts in Port Orchard, WA
| Zip Code | % Graduates | vs State | vs National | |
| 1. | 98366 | 3.7% | 4.6%(-0.917)#257 | 4.3%(-0.550)#10,170 |
| 2. | 98367 | 3.2% | 4.6%(-1.38)#301 | 4.3%(-1.01)#11,845 |
1
Common Questions
What are the Top Zip Codes with the Highest Percentage of Population with a Degree in Visual and Performing Arts in Port Orchard, WA?
Top Zip Codes with the Highest Percentage of Population with a Degree in Visual and Performing Arts in Port Orchard, WA are:
What zip code has the Highest Percentage of Population with a Degree in Visual and Performing Arts in Port Orchard, WA?
98366 has the Highest Percentage of Population with a Degree in Visual and Performing Arts in Port Orchard, WA with 3.7%.
What is the Percentage of Population with a Degree in Visual and Performing Arts in Port Orchard, WA?
Percentage of Population with a Degree in Visual and Performing Arts in Port Orchard is 4.2%.
What is the Percentage of Population with a Degree in Visual and Performing Arts in Washington?
Percentage of Population with a Degree in Visual and Performing Arts in Washington is 4.6%.
What is the Percentage of Population with a Degree in Visual and Performing Arts in the United States?
Percentage of Population with a Degree in Visual and Performing Arts in the United States is 4.3%.