Zip Codes with the Highest Percentage of Population Employed in Installation, Maintenance & Repair in Lynnwood, WA
RELATED REPORTS & OPTIONS
Installation, Maintenance & Repair
Lynnwood
Compare Zip Codes
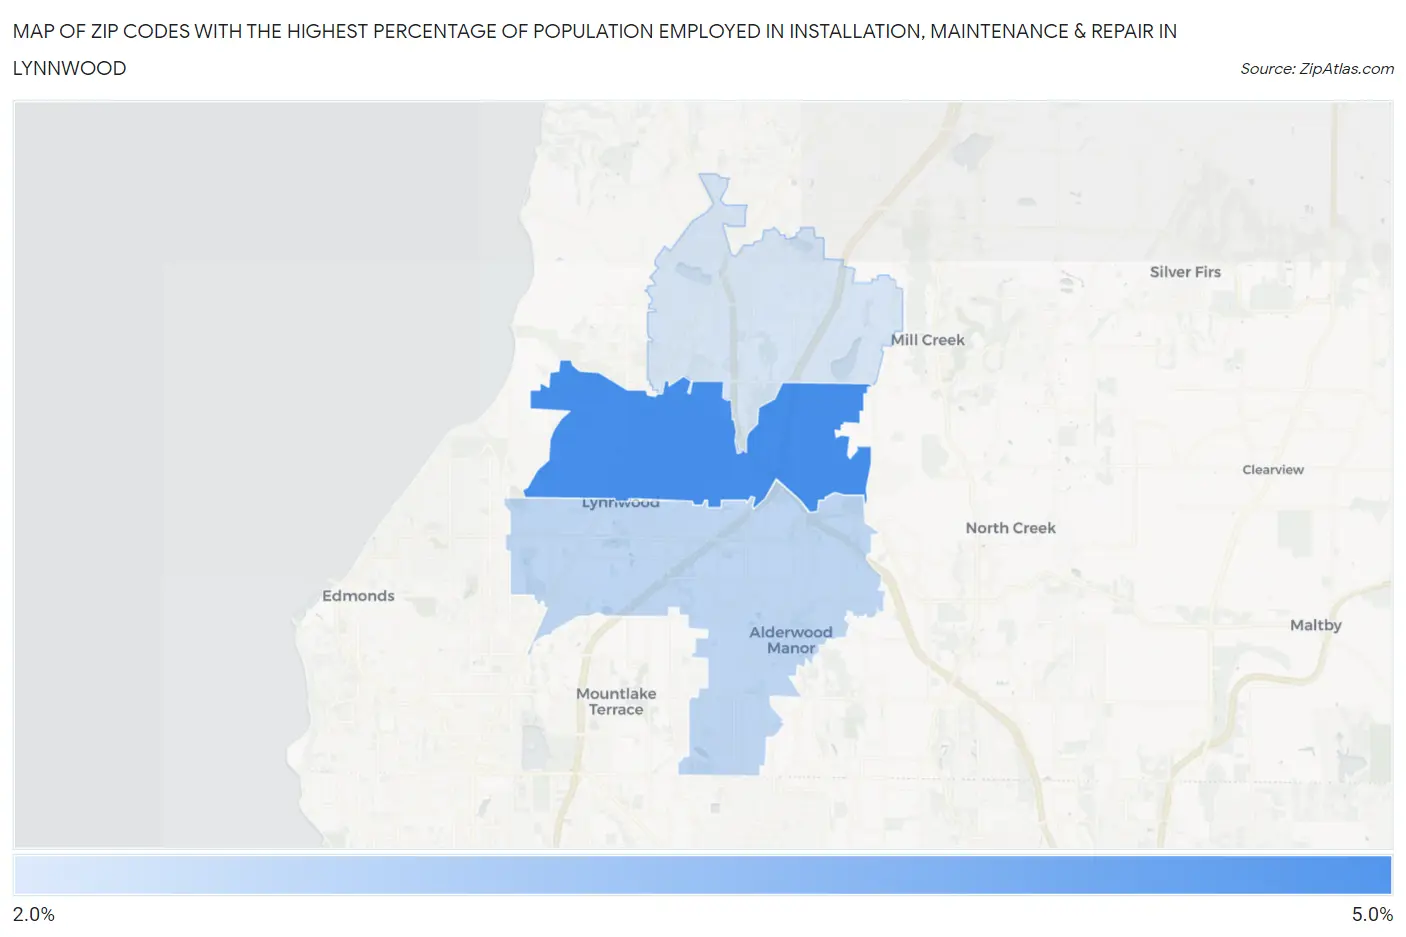
Map of Zip Codes with the Highest Percentage of Population Employed in Installation, Maintenance & Repair in Lynnwood
0.0%
5.0%
Zip Codes with the Highest Percentage of Population Employed in Installation, Maintenance & Repair in Lynnwood, WA
| Zip Code | % Employed | vs State | vs National | |
| 1. | 98037 | 4.0% | 2.9%(+1.10)#192 | 3.1%(+0.962)#12,231 |
| 2. | 98036 | 2.9% | 2.9%(-0.050)#291 | 3.1%(-0.189)#17,614 |
| 3. | 98087 | 2.6% | 2.9%(-0.283)#312 | 3.1%(-0.422)#18,833 |
1
Common Questions
What are the Top Zip Codes with the Highest Percentage of Population Employed in Installation, Maintenance & Repair in Lynnwood, WA?
Top Zip Codes with the Highest Percentage of Population Employed in Installation, Maintenance & Repair in Lynnwood, WA are:
What zip code has the Highest Percentage of Population Employed in Installation, Maintenance & Repair in Lynnwood, WA?
98037 has the Highest Percentage of Population Employed in Installation, Maintenance & Repair in Lynnwood, WA with 4.0%.
What is the Percentage of Population Employed in Installation, Maintenance & Repair in Lynnwood, WA?
Percentage of Population Employed in Installation, Maintenance & Repair in Lynnwood is 4.4%.
What is the Percentage of Population Employed in Installation, Maintenance & Repair in Washington?
Percentage of Population Employed in Installation, Maintenance & Repair in Washington is 2.9%.
What is the Percentage of Population Employed in Installation, Maintenance & Repair in the United States?
Percentage of Population Employed in Installation, Maintenance & Repair in the United States is 3.1%.