Zip Codes with the Highest Percentage of Population with a Degree in Visual and Performing Arts in Yakima, WA
RELATED REPORTS & OPTIONS
Visual and Performing Arts
Yakima
Compare Zip Codes
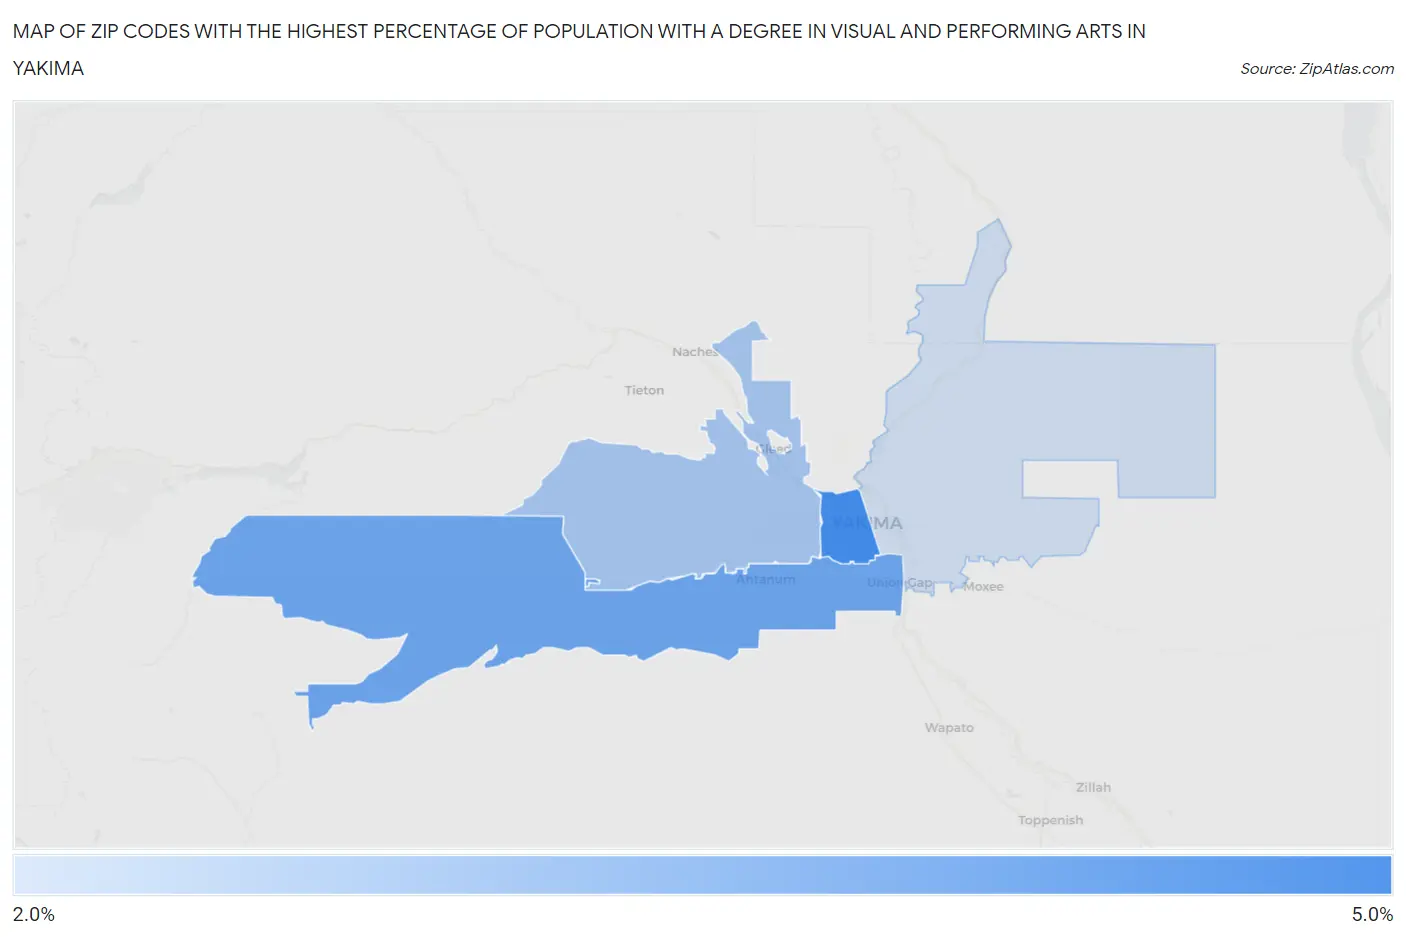
Map of Zip Codes with the Highest Percentage of Population with a Degree in Visual and Performing Arts in Yakima
0.0%
5.0%
Zip Codes with the Highest Percentage of Population with a Degree in Visual and Performing Arts in Yakima, WA
| Zip Code | % Graduates | vs State | vs National | |
| 1. | 98902 | 4.1% | 4.6%(-0.482)#231 | 4.3%(-0.115)#8,807 |
| 2. | 98903 | 3.6% | 4.6%(-0.991)#265 | 4.3%(-0.624)#10,409 |
| 3. | 98908 | 3.0% | 4.6%(-1.62)#320 | 4.3%(-1.26)#12,748 |
| 4. | 98901 | 2.5% | 4.6%(-2.14)#359 | 4.3%(-1.78)#14,710 |
1
Common Questions
What are the Top 3 Zip Codes with the Highest Percentage of Population with a Degree in Visual and Performing Arts in Yakima, WA?
Top 3 Zip Codes with the Highest Percentage of Population with a Degree in Visual and Performing Arts in Yakima, WA are:
What zip code has the Highest Percentage of Population with a Degree in Visual and Performing Arts in Yakima, WA?
98902 has the Highest Percentage of Population with a Degree in Visual and Performing Arts in Yakima, WA with 4.1%.
What is the Percentage of Population with a Degree in Visual and Performing Arts in Yakima, WA?
Percentage of Population with a Degree in Visual and Performing Arts in Yakima is 3.8%.
What is the Percentage of Population with a Degree in Visual and Performing Arts in Washington?
Percentage of Population with a Degree in Visual and Performing Arts in Washington is 4.6%.
What is the Percentage of Population with a Degree in Visual and Performing Arts in the United States?
Percentage of Population with a Degree in Visual and Performing Arts in the United States is 4.3%.