Ecuadorian vs Crow 2 or more Vehicles in Household
COMPARE
Ecuadorian
Crow
2 or more Vehicles in Household
2 or more Vehicles in Household Comparison
Ecuadorians
Crow
42.0%
2 OR MORE VEHICLES IN HOUSEHOLD
0.0/ 100
METRIC RATING
329th/ 347
METRIC RANK
55.7%
2 OR MORE VEHICLES IN HOUSEHOLD
67.0/ 100
METRIC RATING
160th/ 347
METRIC RANK
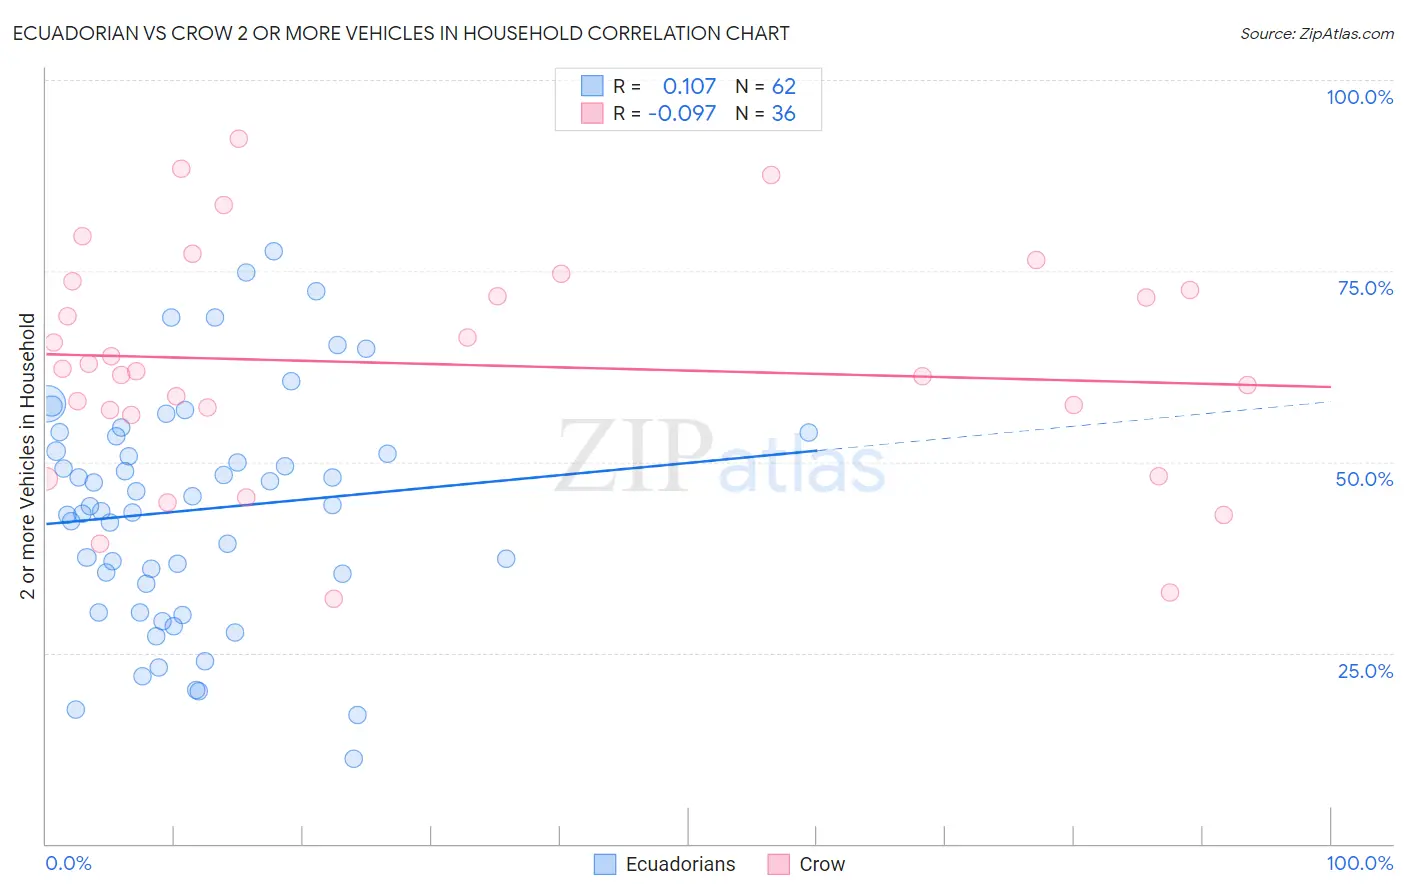
Ecuadorian vs Crow 2 or more Vehicles in Household Correlation Chart
The statistical analysis conducted on geographies consisting of 317,664,097 people shows a poor positive correlation between the proportion of Ecuadorians and percentage of households with 2 or more vehicles available in the United States with a correlation coefficient (R) of 0.107 and weighted average of 42.0%. Similarly, the statistical analysis conducted on geographies consisting of 59,203,156 people shows a slight negative correlation between the proportion of Crow and percentage of households with 2 or more vehicles available in the United States with a correlation coefficient (R) of -0.097 and weighted average of 55.7%, a difference of 32.8%.
2 or more Vehicles in Household Correlation Summary
| Measurement | Ecuadorian | Crow |
| Minimum | 11.1% | 32.0% |
| Maximum | 77.6% | 92.3% |
| Range | 66.5% | 60.3% |
| Mean | 43.7% | 62.8% |
| Median | 44.3% | 62.0% |
| Interquartile 25% (IQ1) | 34.1% | 56.5% |
| Interquartile 75% (IQ3) | 53.3% | 73.1% |
| Interquartile Range (IQR) | 19.3% | 16.6% |
| Standard Deviation (Sample) | 15.0% | 15.0% |
| Standard Deviation (Population) | 14.9% | 14.8% |
Similar Demographics by 2 or more Vehicles in Household
Demographics Similar to Ecuadorians by 2 or more Vehicles in Household
In terms of 2 or more vehicles in household, the demographic groups most similar to Ecuadorians are Immigrants from Dominica (41.6%, a difference of 0.82%), Inupiat (42.6%, a difference of 1.6%), West Indian (41.3%, a difference of 1.7%), Immigrants from Yemen (42.8%, a difference of 2.1%), and Immigrants from Senegal (43.0%, a difference of 2.5%).
| Demographics | Rating | Rank | 2 or more Vehicles in Household |
| Senegalese | 0.0 /100 | #322 | Tragic 44.2% |
| Immigrants | Caribbean | 0.0 /100 | #323 | Tragic 44.2% |
| Immigrants | Cabo Verde | 0.0 /100 | #324 | Tragic 43.3% |
| Immigrants | West Indies | 0.0 /100 | #325 | Tragic 43.1% |
| Immigrants | Senegal | 0.0 /100 | #326 | Tragic 43.0% |
| Immigrants | Yemen | 0.0 /100 | #327 | Tragic 42.8% |
| Inupiat | 0.0 /100 | #328 | Tragic 42.6% |
| Ecuadorians | 0.0 /100 | #329 | Tragic 42.0% |
| Immigrants | Dominica | 0.0 /100 | #330 | Tragic 41.6% |
| West Indians | 0.0 /100 | #331 | Tragic 41.3% |
| Trinidadians and Tobagonians | 0.0 /100 | #332 | Tragic 40.9% |
| Immigrants | Ecuador | 0.0 /100 | #333 | Tragic 40.5% |
| Immigrants | Trinidad and Tobago | 0.0 /100 | #334 | Tragic 40.3% |
| Immigrants | Bangladesh | 0.0 /100 | #335 | Tragic 38.8% |
| Vietnamese | 0.0 /100 | #336 | Tragic 38.5% |
Demographics Similar to Crow by 2 or more Vehicles in Household
In terms of 2 or more vehicles in household, the demographic groups most similar to Crow are Paiute (55.8%, a difference of 0.050%), Tlingit-Haida (55.8%, a difference of 0.070%), Immigrants from Kuwait (55.8%, a difference of 0.14%), Immigrants from Lithuania (55.8%, a difference of 0.15%), and Ukrainian (55.8%, a difference of 0.17%).
| Demographics | Rating | Rank | 2 or more Vehicles in Household |
| Lumbee | 71.9 /100 | #153 | Good 55.9% |
| Ukrainians | 70.8 /100 | #154 | Good 55.8% |
| Immigrants | Venezuela | 70.7 /100 | #155 | Good 55.8% |
| Immigrants | Lithuania | 70.4 /100 | #156 | Good 55.8% |
| Immigrants | Kuwait | 70.2 /100 | #157 | Good 55.8% |
| Tlingit-Haida | 68.5 /100 | #158 | Good 55.8% |
| Paiute | 68.0 /100 | #159 | Good 55.8% |
| Crow | 67.0 /100 | #160 | Good 55.7% |
| Colville | 61.1 /100 | #161 | Good 55.6% |
| German Russians | 60.9 /100 | #162 | Good 55.6% |
| Immigrants | Zimbabwe | 60.2 /100 | #163 | Good 55.6% |
| Dutch West Indians | 59.8 /100 | #164 | Average 55.6% |
| Immigrants | El Salvador | 59.4 /100 | #165 | Average 55.6% |
| Immigrants | Sri Lanka | 58.3 /100 | #166 | Average 55.5% |
| Kenyans | 58.1 /100 | #167 | Average 55.5% |