Immigrants from Turkey vs Immigrants from South Central Asia Unemployment Among Women with Children Ages 6 to 17 years
COMPARE
Immigrants from Turkey
Immigrants from South Central Asia
Unemployment Among Women with Children Ages 6 to 17 years
Unemployment Among Women with Children Ages 6 to 17 years Comparison
Immigrants from Turkey
Immigrants from South Central Asia
9.1%
UNEMPLOYMENT AMONG WOMEN WITH CHILDREN AGES 6 TO 17 YEARS
25.8/ 100
METRIC RATING
193rd/ 347
METRIC RANK
7.9%
UNEMPLOYMENT AMONG WOMEN WITH CHILDREN AGES 6 TO 17 YEARS
100.0/ 100
METRIC RATING
35th/ 347
METRIC RANK
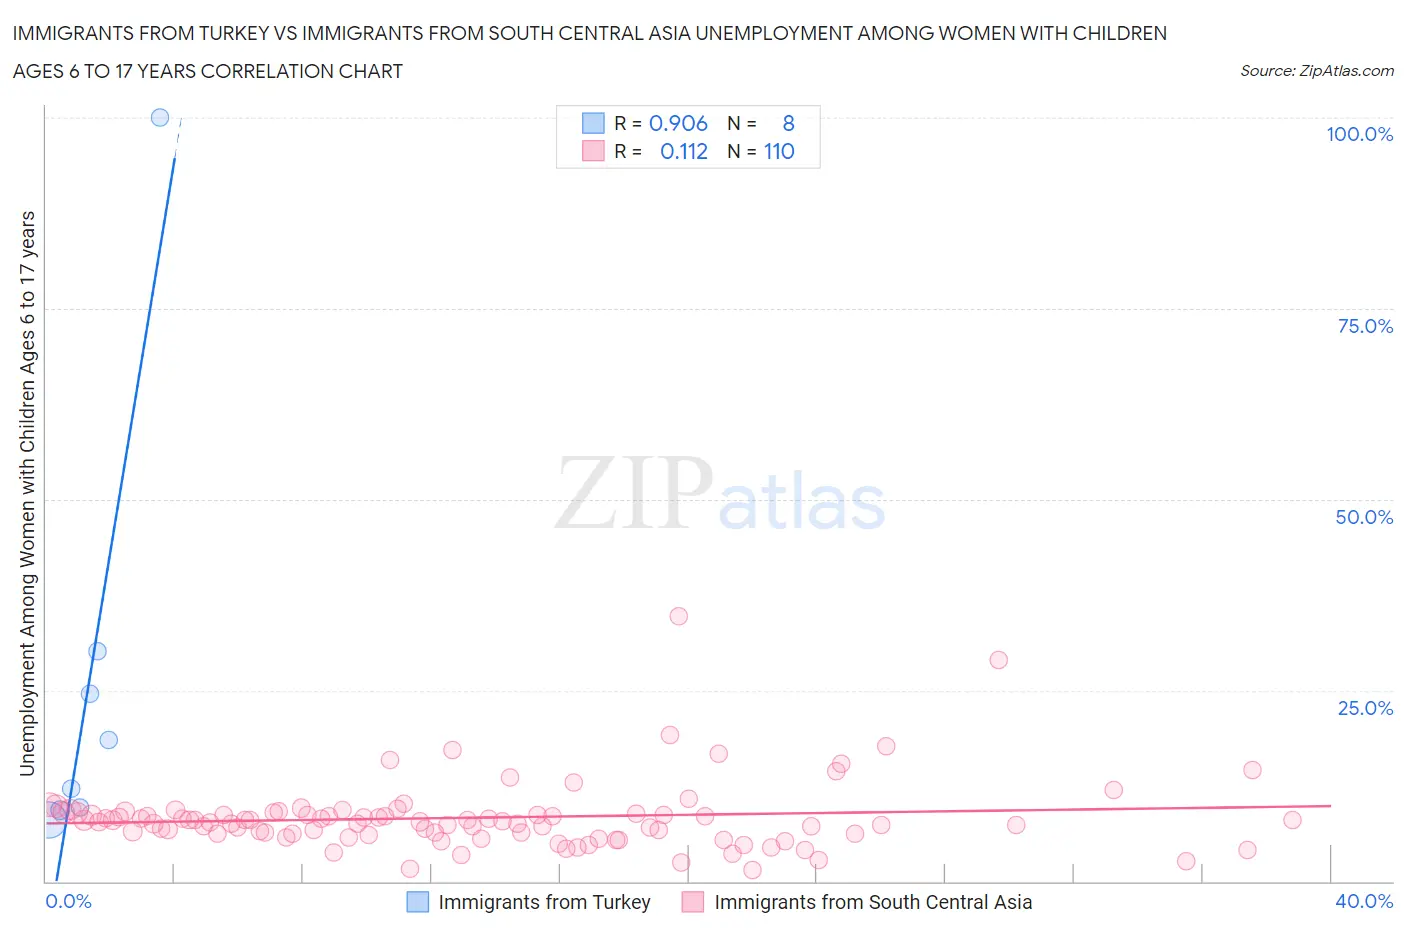
Immigrants from Turkey vs Immigrants from South Central Asia Unemployment Among Women with Children Ages 6 to 17 years Correlation Chart
The statistical analysis conducted on geographies consisting of 175,776,961 people shows a near-perfect positive correlation between the proportion of Immigrants from Turkey and unemployment rate among women with children between the ages 6 and 17 in the United States with a correlation coefficient (R) of 0.906 and weighted average of 9.1%. Similarly, the statistical analysis conducted on geographies consisting of 326,255,607 people shows a poor positive correlation between the proportion of Immigrants from South Central Asia and unemployment rate among women with children between the ages 6 and 17 in the United States with a correlation coefficient (R) of 0.112 and weighted average of 7.9%, a difference of 14.1%.
Unemployment Among Women with Children Ages 6 to 17 years Correlation Summary
| Measurement | Immigrants from Turkey | Immigrants from South Central Asia |
| Minimum | 8.1% | 1.5% |
| Maximum | 100.0% | 34.7% |
| Range | 91.9% | 33.2% |
| Mean | 26.5% | 8.3% |
| Median | 15.3% | 7.8% |
| Interquartile 25% (IQ1) | 9.5% | 6.2% |
| Interquartile 75% (IQ3) | 27.3% | 8.9% |
| Interquartile Range (IQR) | 17.8% | 2.7% |
| Standard Deviation (Sample) | 30.7% | 4.5% |
| Standard Deviation (Population) | 28.7% | 4.5% |
Similar Demographics by Unemployment Among Women with Children Ages 6 to 17 years
Demographics Similar to Immigrants from Turkey by Unemployment Among Women with Children Ages 6 to 17 years
In terms of unemployment among women with children ages 6 to 17 years, the demographic groups most similar to Immigrants from Turkey are Immigrants from Kazakhstan (9.1%, a difference of 0.030%), Austrian (9.1%, a difference of 0.050%), Guamanian/Chamorro (9.1%, a difference of 0.070%), Brazilian (9.1%, a difference of 0.080%), and Immigrants from Panama (9.1%, a difference of 0.090%).
| Demographics | Rating | Rank | Unemployment Among Women with Children Ages 6 to 17 years |
| Immigrants | Spain | 32.4 /100 | #186 | Fair 9.0% |
| Comanche | 30.0 /100 | #187 | Fair 9.0% |
| Immigrants | Syria | 29.7 /100 | #188 | Fair 9.1% |
| Immigrants | Immigrants | 29.2 /100 | #189 | Fair 9.1% |
| Slovenes | 28.5 /100 | #190 | Fair 9.1% |
| Belizeans | 28.4 /100 | #191 | Fair 9.1% |
| Guamanians/Chamorros | 27.2 /100 | #192 | Fair 9.1% |
| Immigrants | Turkey | 25.8 /100 | #193 | Fair 9.1% |
| Immigrants | Kazakhstan | 25.3 /100 | #194 | Fair 9.1% |
| Austrians | 25.0 /100 | #195 | Fair 9.1% |
| Brazilians | 24.4 /100 | #196 | Fair 9.1% |
| Immigrants | Panama | 24.3 /100 | #197 | Fair 9.1% |
| Guyanese | 21.8 /100 | #198 | Fair 9.1% |
| Czechoslovakians | 20.8 /100 | #199 | Fair 9.1% |
| Trinidadians and Tobagonians | 18.2 /100 | #200 | Poor 9.1% |
Demographics Similar to Immigrants from South Central Asia by Unemployment Among Women with Children Ages 6 to 17 years
In terms of unemployment among women with children ages 6 to 17 years, the demographic groups most similar to Immigrants from South Central Asia are Burmese (8.0%, a difference of 0.080%), Native Hawaiian (7.9%, a difference of 0.11%), Asian (8.0%, a difference of 0.11%), Immigrants from Korea (7.9%, a difference of 0.39%), and Immigrants from Cambodia (7.9%, a difference of 0.44%).
| Demographics | Rating | Rank | Unemployment Among Women with Children Ages 6 to 17 years |
| Immigrants | Uzbekistan | 100.0 /100 | #28 | Exceptional 7.8% |
| Thais | 100.0 /100 | #29 | Exceptional 7.8% |
| Immigrants | Iran | 100.0 /100 | #30 | Exceptional 7.9% |
| Laotians | 100.0 /100 | #31 | Exceptional 7.9% |
| Immigrants | Cambodia | 100.0 /100 | #32 | Exceptional 7.9% |
| Immigrants | Korea | 100.0 /100 | #33 | Exceptional 7.9% |
| Native Hawaiians | 100.0 /100 | #34 | Exceptional 7.9% |
| Immigrants | South Central Asia | 100.0 /100 | #35 | Exceptional 7.9% |
| Burmese | 100.0 /100 | #36 | Exceptional 8.0% |
| Asians | 100.0 /100 | #37 | Exceptional 8.0% |
| Alsatians | 100.0 /100 | #38 | Exceptional 8.0% |
| Somalis | 100.0 /100 | #39 | Exceptional 8.0% |
| Immigrants | Zimbabwe | 100.0 /100 | #40 | Exceptional 8.0% |
| Iranians | 100.0 /100 | #41 | Exceptional 8.0% |
| Immigrants | Somalia | 100.0 /100 | #42 | Exceptional 8.0% |