Cape Verdean vs Immigrants from Colombia Unemployment Among Women with Children Ages 6 to 17 years
COMPARE
Cape Verdean
Immigrants from Colombia
Unemployment Among Women with Children Ages 6 to 17 years
Unemployment Among Women with Children Ages 6 to 17 years Comparison
Cape Verdeans
Immigrants from Colombia
10.9%
UNEMPLOYMENT AMONG WOMEN WITH CHILDREN AGES 6 TO 17 YEARS
0.0/ 100
METRIC RATING
327th/ 347
METRIC RANK
9.3%
UNEMPLOYMENT AMONG WOMEN WITH CHILDREN AGES 6 TO 17 YEARS
2.1/ 100
METRIC RATING
242nd/ 347
METRIC RANK
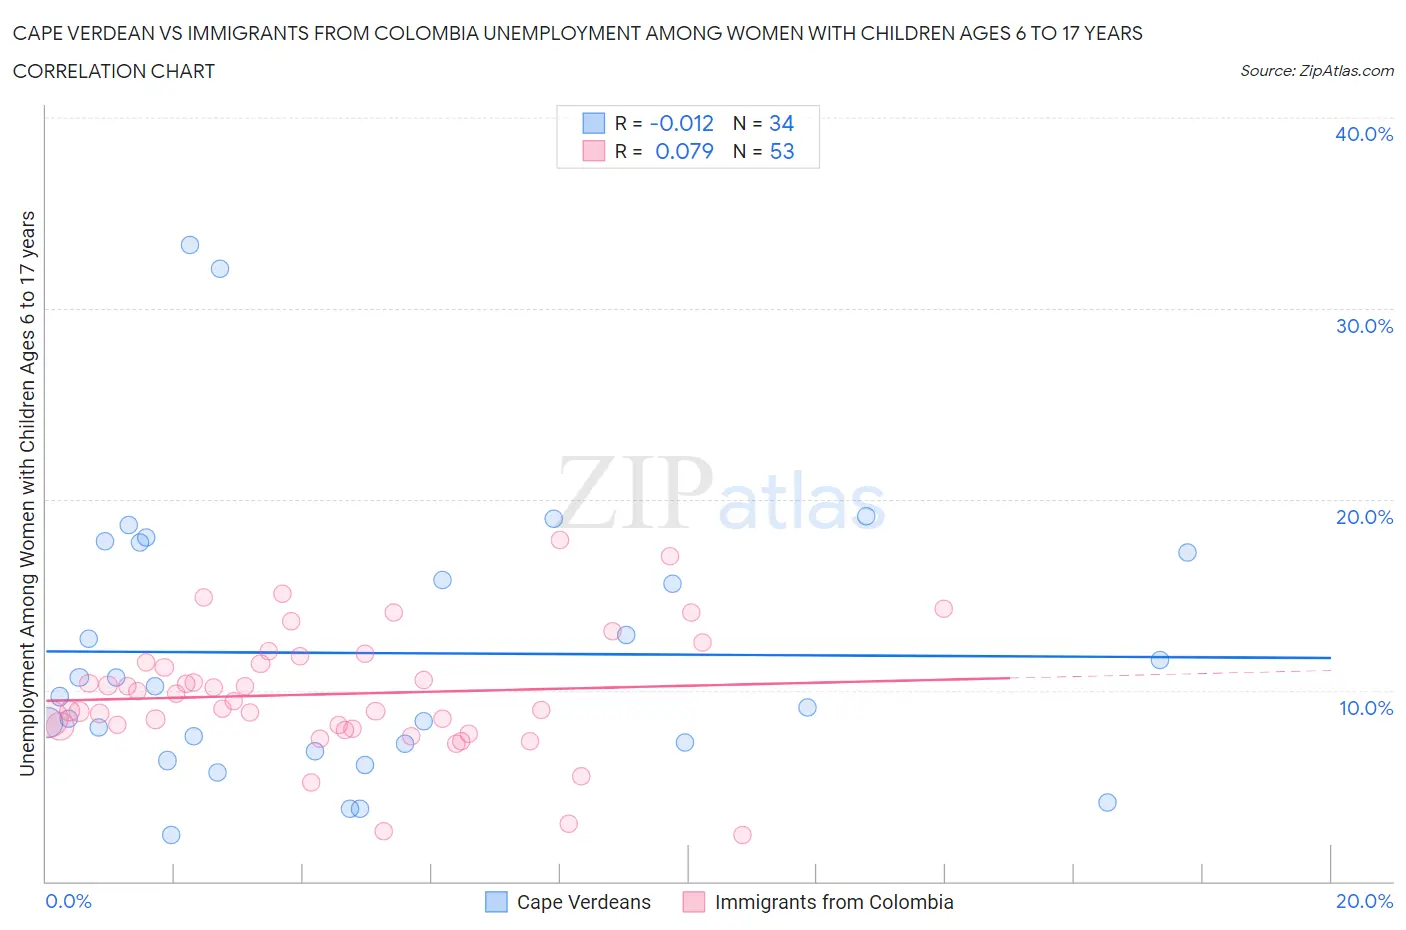
Cape Verdean vs Immigrants from Colombia Unemployment Among Women with Children Ages 6 to 17 years Correlation Chart
The statistical analysis conducted on geographies consisting of 93,873,663 people shows no correlation between the proportion of Cape Verdeans and unemployment rate among women with children between the ages 6 and 17 in the United States with a correlation coefficient (R) of -0.012 and weighted average of 10.9%. Similarly, the statistical analysis conducted on geographies consisting of 278,056,309 people shows a slight positive correlation between the proportion of Immigrants from Colombia and unemployment rate among women with children between the ages 6 and 17 in the United States with a correlation coefficient (R) of 0.079 and weighted average of 9.3%, a difference of 16.2%.
Unemployment Among Women with Children Ages 6 to 17 years Correlation Summary
| Measurement | Cape Verdean | Immigrants from Colombia |
| Minimum | 2.4% | 2.4% |
| Maximum | 33.3% | 17.9% |
| Range | 30.9% | 15.5% |
| Mean | 11.9% | 9.8% |
| Median | 10.0% | 9.4% |
| Interquartile 25% (IQ1) | 7.2% | 8.0% |
| Interquartile 75% (IQ3) | 17.2% | 11.6% |
| Interquartile Range (IQR) | 10.0% | 3.6% |
| Standard Deviation (Sample) | 7.2% | 3.2% |
| Standard Deviation (Population) | 7.1% | 3.2% |
Similar Demographics by Unemployment Among Women with Children Ages 6 to 17 years
Demographics Similar to Cape Verdeans by Unemployment Among Women with Children Ages 6 to 17 years
In terms of unemployment among women with children ages 6 to 17 years, the demographic groups most similar to Cape Verdeans are Liberian (10.8%, a difference of 0.070%), Cajun (10.8%, a difference of 0.13%), Ottawa (10.9%, a difference of 0.14%), Immigrants from Dominican Republic (10.8%, a difference of 0.32%), and Dominican (10.8%, a difference of 0.38%).
| Demographics | Rating | Rank | Unemployment Among Women with Children Ages 6 to 17 years |
| Apache | 0.0 /100 | #320 | Tragic 10.7% |
| Tohono O'odham | 0.0 /100 | #321 | Tragic 10.7% |
| Cree | 0.0 /100 | #322 | Tragic 10.8% |
| Dominicans | 0.0 /100 | #323 | Tragic 10.8% |
| Immigrants | Dominican Republic | 0.0 /100 | #324 | Tragic 10.8% |
| Cajuns | 0.0 /100 | #325 | Tragic 10.8% |
| Liberians | 0.0 /100 | #326 | Tragic 10.8% |
| Cape Verdeans | 0.0 /100 | #327 | Tragic 10.9% |
| Ottawa | 0.0 /100 | #328 | Tragic 10.9% |
| Pennsylvania Germans | 0.0 /100 | #329 | Tragic 11.0% |
| Chippewa | 0.0 /100 | #330 | Tragic 11.1% |
| Blacks/African Americans | 0.0 /100 | #331 | Tragic 11.4% |
| Tsimshian | 0.0 /100 | #332 | Tragic 11.4% |
| Natives/Alaskans | 0.0 /100 | #333 | Tragic 11.5% |
| Ugandans | 0.0 /100 | #334 | Tragic 12.0% |
Demographics Similar to Immigrants from Colombia by Unemployment Among Women with Children Ages 6 to 17 years
In terms of unemployment among women with children ages 6 to 17 years, the demographic groups most similar to Immigrants from Colombia are Colombian (9.3%, a difference of 0.020%), Guatemalan (9.3%, a difference of 0.090%), Scottish (9.4%, a difference of 0.090%), English (9.4%, a difference of 0.14%), and Immigrants from Cameroon (9.4%, a difference of 0.17%).
| Demographics | Rating | Rank | Unemployment Among Women with Children Ages 6 to 17 years |
| Uruguayans | 3.0 /100 | #235 | Tragic 9.3% |
| Hungarians | 3.0 /100 | #236 | Tragic 9.3% |
| Immigrants | Belize | 2.8 /100 | #237 | Tragic 9.3% |
| Arabs | 2.7 /100 | #238 | Tragic 9.3% |
| Immigrants | Saudi Arabia | 2.7 /100 | #239 | Tragic 9.3% |
| Guatemalans | 2.3 /100 | #240 | Tragic 9.3% |
| Colombians | 2.2 /100 | #241 | Tragic 9.3% |
| Immigrants | Colombia | 2.1 /100 | #242 | Tragic 9.3% |
| Scottish | 2.0 /100 | #243 | Tragic 9.4% |
| English | 1.9 /100 | #244 | Tragic 9.4% |
| Immigrants | Cameroon | 1.8 /100 | #245 | Tragic 9.4% |
| Immigrants | Africa | 1.6 /100 | #246 | Tragic 9.4% |
| Poles | 1.5 /100 | #247 | Tragic 9.4% |
| Dutch | 1.5 /100 | #248 | Tragic 9.4% |
| Immigrants | South America | 1.5 /100 | #249 | Tragic 9.4% |