Immigrants from Austria vs Immigrants from Colombia Unemployment Among Women with Children Ages 6 to 17 years
COMPARE
Immigrants from Austria
Immigrants from Colombia
Unemployment Among Women with Children Ages 6 to 17 years
Unemployment Among Women with Children Ages 6 to 17 years Comparison
Immigrants from Austria
Immigrants from Colombia
8.8%
UNEMPLOYMENT AMONG WOMEN WITH CHILDREN AGES 6 TO 17 YEARS
87.5/ 100
METRIC RATING
142nd/ 347
METRIC RANK
9.3%
UNEMPLOYMENT AMONG WOMEN WITH CHILDREN AGES 6 TO 17 YEARS
2.1/ 100
METRIC RATING
242nd/ 347
METRIC RANK
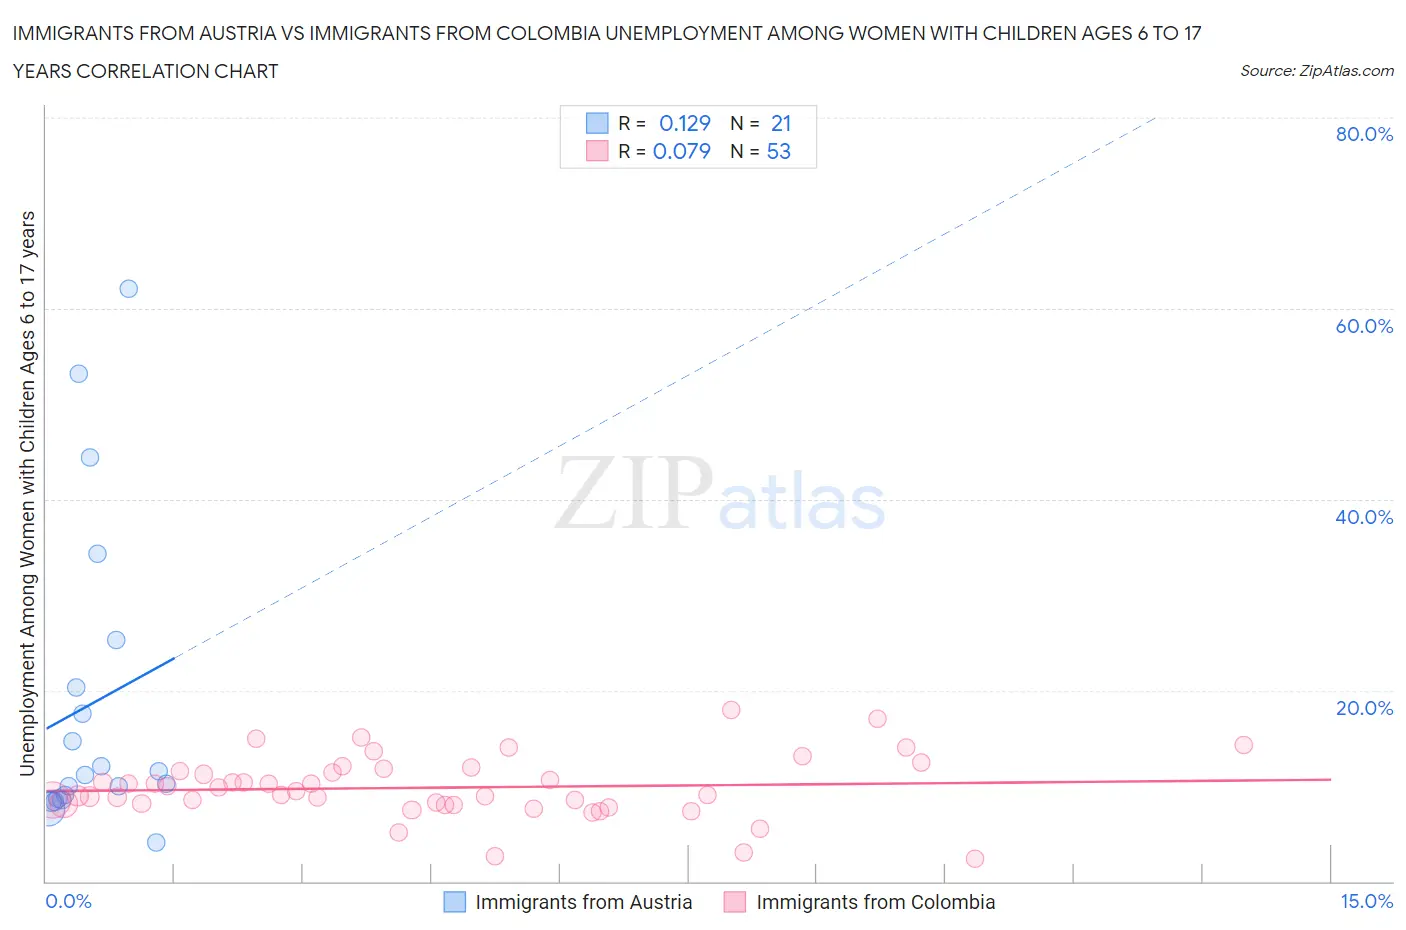
Immigrants from Austria vs Immigrants from Colombia Unemployment Among Women with Children Ages 6 to 17 years Correlation Chart
The statistical analysis conducted on geographies consisting of 134,337,989 people shows a poor positive correlation between the proportion of Immigrants from Austria and unemployment rate among women with children between the ages 6 and 17 in the United States with a correlation coefficient (R) of 0.129 and weighted average of 8.8%. Similarly, the statistical analysis conducted on geographies consisting of 278,056,309 people shows a slight positive correlation between the proportion of Immigrants from Colombia and unemployment rate among women with children between the ages 6 and 17 in the United States with a correlation coefficient (R) of 0.079 and weighted average of 9.3%, a difference of 6.5%.
Unemployment Among Women with Children Ages 6 to 17 years Correlation Summary
| Measurement | Immigrants from Austria | Immigrants from Colombia |
| Minimum | 4.0% | 2.4% |
| Maximum | 62.0% | 17.9% |
| Range | 58.0% | 15.5% |
| Mean | 18.6% | 9.8% |
| Median | 11.2% | 9.4% |
| Interquartile 25% (IQ1) | 8.6% | 8.0% |
| Interquartile 75% (IQ3) | 22.8% | 11.6% |
| Interquartile Range (IQR) | 14.2% | 3.6% |
| Standard Deviation (Sample) | 16.2% | 3.2% |
| Standard Deviation (Population) | 15.8% | 3.2% |
Similar Demographics by Unemployment Among Women with Children Ages 6 to 17 years
Demographics Similar to Immigrants from Austria by Unemployment Among Women with Children Ages 6 to 17 years
In terms of unemployment among women with children ages 6 to 17 years, the demographic groups most similar to Immigrants from Austria are Serbian (8.8%, a difference of 0.020%), Immigrants from Poland (8.8%, a difference of 0.080%), Immigrants from Kenya (8.8%, a difference of 0.13%), Russian (8.8%, a difference of 0.16%), and Kenyan (8.8%, a difference of 0.18%).
| Demographics | Rating | Rank | Unemployment Among Women with Children Ages 6 to 17 years |
| Europeans | 90.6 /100 | #135 | Exceptional 8.7% |
| Immigrants | Latvia | 90.4 /100 | #136 | Exceptional 8.7% |
| Immigrants | Argentina | 90.0 /100 | #137 | Excellent 8.7% |
| Immigrants | Ethiopia | 89.5 /100 | #138 | Excellent 8.8% |
| Northern Europeans | 89.2 /100 | #139 | Excellent 8.8% |
| Immigrants | Poland | 88.3 /100 | #140 | Excellent 8.8% |
| Serbians | 87.6 /100 | #141 | Excellent 8.8% |
| Immigrants | Austria | 87.5 /100 | #142 | Excellent 8.8% |
| Immigrants | Kenya | 86.1 /100 | #143 | Excellent 8.8% |
| Russians | 85.8 /100 | #144 | Excellent 8.8% |
| Kenyans | 85.6 /100 | #145 | Excellent 8.8% |
| Chileans | 80.8 /100 | #146 | Excellent 8.8% |
| Immigrants | Bangladesh | 79.4 /100 | #147 | Good 8.8% |
| Costa Ricans | 77.0 /100 | #148 | Good 8.8% |
| Croatians | 76.0 /100 | #149 | Good 8.8% |
Demographics Similar to Immigrants from Colombia by Unemployment Among Women with Children Ages 6 to 17 years
In terms of unemployment among women with children ages 6 to 17 years, the demographic groups most similar to Immigrants from Colombia are Colombian (9.3%, a difference of 0.020%), Guatemalan (9.3%, a difference of 0.090%), Scottish (9.4%, a difference of 0.090%), English (9.4%, a difference of 0.14%), and Immigrants from Cameroon (9.4%, a difference of 0.17%).
| Demographics | Rating | Rank | Unemployment Among Women with Children Ages 6 to 17 years |
| Uruguayans | 3.0 /100 | #235 | Tragic 9.3% |
| Hungarians | 3.0 /100 | #236 | Tragic 9.3% |
| Immigrants | Belize | 2.8 /100 | #237 | Tragic 9.3% |
| Arabs | 2.7 /100 | #238 | Tragic 9.3% |
| Immigrants | Saudi Arabia | 2.7 /100 | #239 | Tragic 9.3% |
| Guatemalans | 2.3 /100 | #240 | Tragic 9.3% |
| Colombians | 2.2 /100 | #241 | Tragic 9.3% |
| Immigrants | Colombia | 2.1 /100 | #242 | Tragic 9.3% |
| Scottish | 2.0 /100 | #243 | Tragic 9.4% |
| English | 1.9 /100 | #244 | Tragic 9.4% |
| Immigrants | Cameroon | 1.8 /100 | #245 | Tragic 9.4% |
| Immigrants | Africa | 1.6 /100 | #246 | Tragic 9.4% |
| Poles | 1.5 /100 | #247 | Tragic 9.4% |
| Dutch | 1.5 /100 | #248 | Tragic 9.4% |
| Immigrants | South America | 1.5 /100 | #249 | Tragic 9.4% |