Ute vs Immigrants from Laos Married-Couple Family Poverty
COMPARE
Ute
Immigrants from Laos
Married-Couple Family Poverty
Married-Couple Family Poverty Comparison
Ute
Immigrants from Laos
6.4%
MARRIED-COUPLE FAMILY POVERTY
0.0/ 100
METRIC RATING
283rd/ 347
METRIC RANK
5.7%
MARRIED-COUPLE FAMILY POVERTY
4.4/ 100
METRIC RATING
232nd/ 347
METRIC RANK
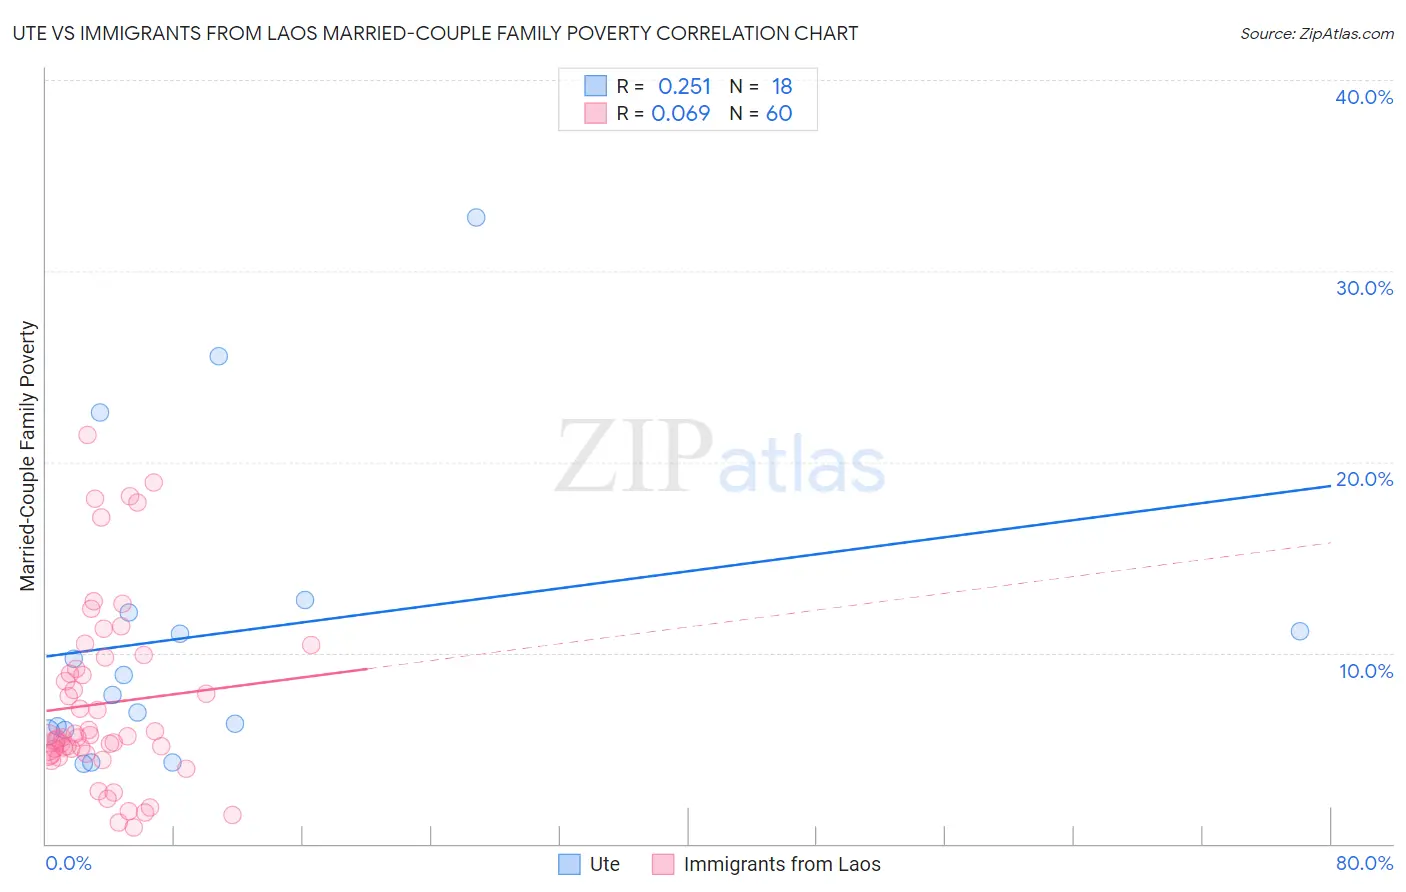
Ute vs Immigrants from Laos Married-Couple Family Poverty Correlation Chart
The statistical analysis conducted on geographies consisting of 55,601,048 people shows a weak positive correlation between the proportion of Ute and poverty level among married-couple families in the United States with a correlation coefficient (R) of 0.251 and weighted average of 6.4%. Similarly, the statistical analysis conducted on geographies consisting of 200,657,338 people shows a slight positive correlation between the proportion of Immigrants from Laos and poverty level among married-couple families in the United States with a correlation coefficient (R) of 0.069 and weighted average of 5.7%, a difference of 13.2%.
Married-Couple Family Poverty Correlation Summary
| Measurement | Ute | Immigrants from Laos |
| Minimum | 4.2% | 0.85% |
| Maximum | 32.8% | 21.4% |
| Range | 28.6% | 20.6% |
| Mean | 11.0% | 7.3% |
| Median | 8.3% | 5.5% |
| Interquartile 25% (IQ1) | 6.0% | 4.7% |
| Interquartile 75% (IQ3) | 12.1% | 9.5% |
| Interquartile Range (IQR) | 6.1% | 4.8% |
| Standard Deviation (Sample) | 8.0% | 4.8% |
| Standard Deviation (Population) | 7.8% | 4.7% |
Similar Demographics by Married-Couple Family Poverty
Demographics Similar to Ute by Married-Couple Family Poverty
In terms of married-couple family poverty, the demographic groups most similar to Ute are Dutch West Indian (6.4%, a difference of 0.12%), Seminole (6.4%, a difference of 0.38%), Mexican American Indian (6.4%, a difference of 0.39%), Black/African American (6.5%, a difference of 0.63%), and Guyanese (6.5%, a difference of 0.73%).
| Demographics | Rating | Rank | Married-Couple Family Poverty |
| Yaqui | 0.1 /100 | #276 | Tragic 6.3% |
| Indonesians | 0.1 /100 | #277 | Tragic 6.3% |
| Immigrants | Trinidad and Tobago | 0.1 /100 | #278 | Tragic 6.4% |
| Houma | 0.0 /100 | #279 | Tragic 6.4% |
| West Indians | 0.0 /100 | #280 | Tragic 6.4% |
| Mexican American Indians | 0.0 /100 | #281 | Tragic 6.4% |
| Seminole | 0.0 /100 | #282 | Tragic 6.4% |
| Ute | 0.0 /100 | #283 | Tragic 6.4% |
| Dutch West Indians | 0.0 /100 | #284 | Tragic 6.4% |
| Blacks/African Americans | 0.0 /100 | #285 | Tragic 6.5% |
| Guyanese | 0.0 /100 | #286 | Tragic 6.5% |
| Ecuadorians | 0.0 /100 | #287 | Tragic 6.5% |
| Salvadorans | 0.0 /100 | #288 | Tragic 6.5% |
| Nepalese | 0.0 /100 | #289 | Tragic 6.5% |
| Immigrants | Barbados | 0.0 /100 | #290 | Tragic 6.5% |
Demographics Similar to Immigrants from Laos by Married-Couple Family Poverty
In terms of married-couple family poverty, the demographic groups most similar to Immigrants from Laos are Immigrants from Iraq (5.7%, a difference of 0.060%), Moroccan (5.7%, a difference of 0.32%), Subsaharan African (5.7%, a difference of 0.35%), Immigrants from Colombia (5.7%, a difference of 0.44%), and Immigrants from Uruguay (5.7%, a difference of 0.44%).
| Demographics | Rating | Rank | Married-Couple Family Poverty |
| Immigrants | Cambodia | 6.1 /100 | #225 | Tragic 5.6% |
| South Americans | 5.7 /100 | #226 | Tragic 5.6% |
| Immigrants | Zaire | 5.6 /100 | #227 | Tragic 5.6% |
| Arabs | 5.4 /100 | #228 | Tragic 5.7% |
| Sub-Saharan Africans | 4.9 /100 | #229 | Tragic 5.7% |
| Moroccans | 4.9 /100 | #230 | Tragic 5.7% |
| Immigrants | Iraq | 4.4 /100 | #231 | Tragic 5.7% |
| Immigrants | Laos | 4.4 /100 | #232 | Tragic 5.7% |
| Immigrants | Colombia | 3.7 /100 | #233 | Tragic 5.7% |
| Immigrants | Uruguay | 3.7 /100 | #234 | Tragic 5.7% |
| Immigrants | Sudan | 3.5 /100 | #235 | Tragic 5.7% |
| Ghanaians | 3.3 /100 | #236 | Tragic 5.7% |
| Immigrants | South America | 3.1 /100 | #237 | Tragic 5.7% |
| Cherokee | 2.7 /100 | #238 | Tragic 5.8% |
| Venezuelans | 2.7 /100 | #239 | Tragic 5.8% |