Immigrants from Haiti vs Immigrants from Northern Europe Married-Couple Family Poverty
COMPARE
Immigrants from Haiti
Immigrants from Northern Europe
Married-Couple Family Poverty
Married-Couple Family Poverty Comparison
Immigrants from Haiti
Immigrants from Northern Europe
7.0%
MARRIED-COUPLE FAMILY POVERTY
0.0/ 100
METRIC RATING
306th/ 347
METRIC RANK
4.2%
MARRIED-COUPLE FAMILY POVERTY
99.8/ 100
METRIC RATING
39th/ 347
METRIC RANK
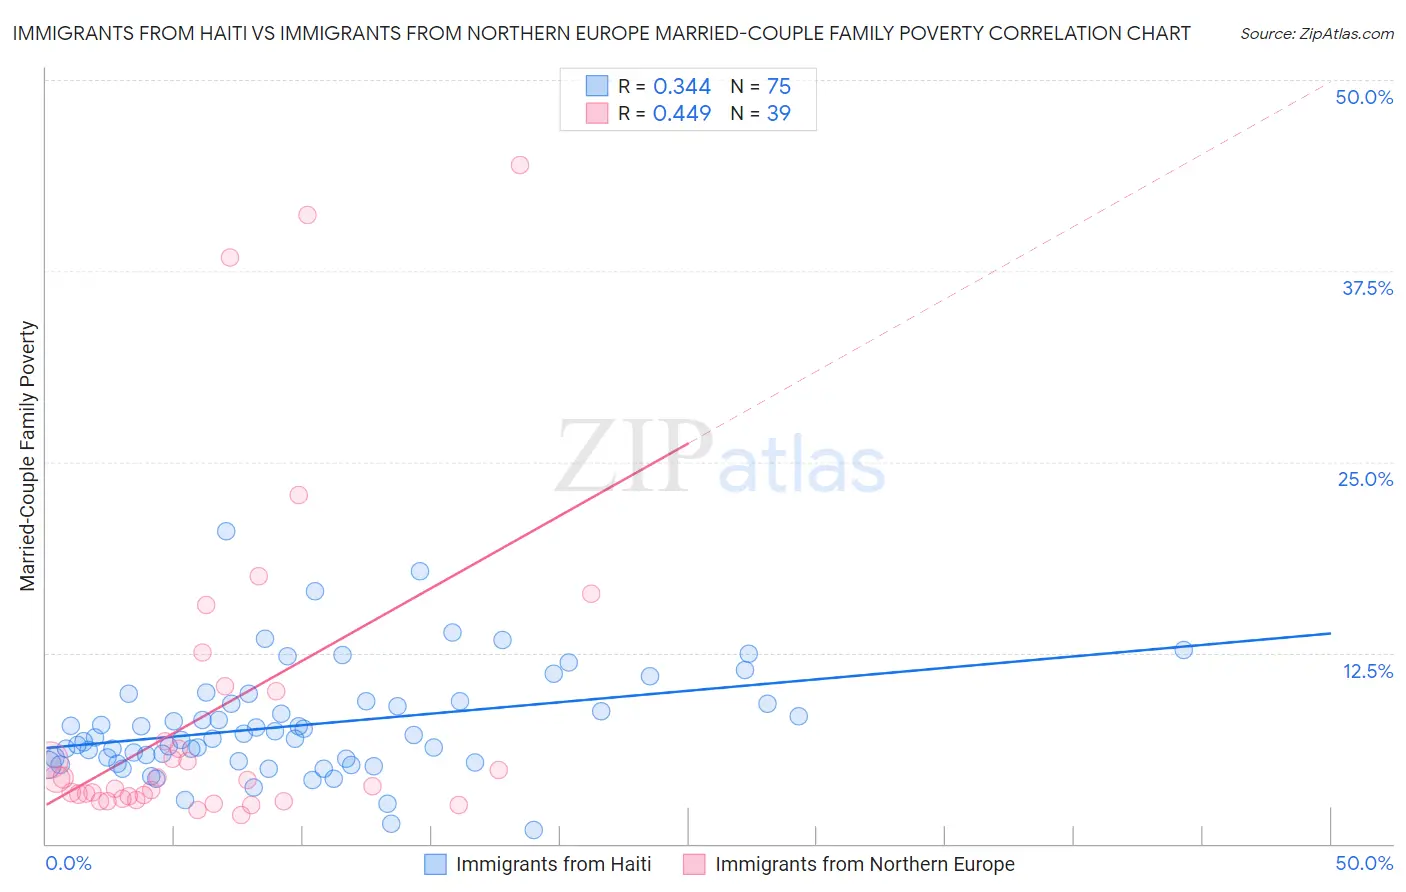
Immigrants from Haiti vs Immigrants from Northern Europe Married-Couple Family Poverty Correlation Chart
The statistical analysis conducted on geographies consisting of 224,016,924 people shows a mild positive correlation between the proportion of Immigrants from Haiti and poverty level among married-couple families in the United States with a correlation coefficient (R) of 0.344 and weighted average of 7.0%. Similarly, the statistical analysis conducted on geographies consisting of 470,220,521 people shows a moderate positive correlation between the proportion of Immigrants from Northern Europe and poverty level among married-couple families in the United States with a correlation coefficient (R) of 0.449 and weighted average of 4.2%, a difference of 64.3%.
Married-Couple Family Poverty Correlation Summary
| Measurement | Immigrants from Haiti | Immigrants from Northern Europe |
| Minimum | 0.90% | 1.9% |
| Maximum | 20.5% | 44.4% |
| Range | 19.6% | 42.6% |
| Mean | 7.8% | 8.6% |
| Median | 7.0% | 4.2% |
| Interquartile 25% (IQ1) | 5.4% | 3.0% |
| Interquartile 75% (IQ3) | 9.3% | 10.0% |
| Interquartile Range (IQR) | 4.0% | 7.0% |
| Standard Deviation (Sample) | 3.5% | 10.7% |
| Standard Deviation (Population) | 3.5% | 10.6% |
Similar Demographics by Married-Couple Family Poverty
Demographics Similar to Immigrants from Haiti by Married-Couple Family Poverty
In terms of married-couple family poverty, the demographic groups most similar to Immigrants from Haiti are Guatemalan (7.0%, a difference of 1.1%), Spanish American Indian (7.1%, a difference of 1.3%), Hopi (7.1%, a difference of 1.9%), Immigrants from Nicaragua (7.1%, a difference of 1.9%), and Immigrants from Dominica (7.1%, a difference of 2.0%).
| Demographics | Rating | Rank | Married-Couple Family Poverty |
| Nicaraguans | 0.0 /100 | #299 | Tragic 6.7% |
| Immigrants | Belize | 0.0 /100 | #300 | Tragic 6.7% |
| Central Americans | 0.0 /100 | #301 | Tragic 6.7% |
| Immigrants | Ecuador | 0.0 /100 | #302 | Tragic 6.7% |
| Immigrants | El Salvador | 0.0 /100 | #303 | Tragic 6.8% |
| Cubans | 0.0 /100 | #304 | Tragic 6.8% |
| Haitians | 0.0 /100 | #305 | Tragic 6.8% |
| Immigrants | Haiti | 0.0 /100 | #306 | Tragic 7.0% |
| Guatemalans | 0.0 /100 | #307 | Tragic 7.0% |
| Spanish American Indians | 0.0 /100 | #308 | Tragic 7.1% |
| Hopi | 0.0 /100 | #309 | Tragic 7.1% |
| Immigrants | Nicaragua | 0.0 /100 | #310 | Tragic 7.1% |
| Immigrants | Dominica | 0.0 /100 | #311 | Tragic 7.1% |
| Immigrants | Armenia | 0.0 /100 | #312 | Tragic 7.1% |
| Immigrants | St. Vincent and the Grenadines | 0.0 /100 | #313 | Tragic 7.1% |
Demographics Similar to Immigrants from Northern Europe by Married-Couple Family Poverty
In terms of married-couple family poverty, the demographic groups most similar to Immigrants from Northern Europe are Belgian (4.2%, a difference of 0.13%), Iranian (4.2%, a difference of 0.25%), French Canadian (4.2%, a difference of 0.28%), English (4.2%, a difference of 0.32%), and European (4.2%, a difference of 0.35%).
| Demographics | Rating | Rank | Married-Couple Family Poverty |
| Greeks | 99.9 /100 | #32 | Exceptional 4.2% |
| Irish | 99.9 /100 | #33 | Exceptional 4.2% |
| Dutch | 99.9 /100 | #34 | Exceptional 4.2% |
| Europeans | 99.9 /100 | #35 | Exceptional 4.2% |
| English | 99.9 /100 | #36 | Exceptional 4.2% |
| Iranians | 99.9 /100 | #37 | Exceptional 4.2% |
| Belgians | 99.9 /100 | #38 | Exceptional 4.2% |
| Immigrants | Northern Europe | 99.8 /100 | #39 | Exceptional 4.2% |
| French Canadians | 99.8 /100 | #40 | Exceptional 4.2% |
| Northern Europeans | 99.8 /100 | #41 | Exceptional 4.3% |
| Scottish | 99.8 /100 | #42 | Exceptional 4.3% |
| Swiss | 99.8 /100 | #43 | Exceptional 4.3% |
| Immigrants | Japan | 99.8 /100 | #44 | Exceptional 4.3% |
| Serbians | 99.8 /100 | #45 | Exceptional 4.3% |
| British | 99.8 /100 | #46 | Exceptional 4.3% |