Czech vs Okinawan Married-Couple Family Poverty
COMPARE
Czech
Okinawan
Married-Couple Family Poverty
Married-Couple Family Poverty Comparison
Czechs
Okinawans
4.0%
MARRIED-COUPLE FAMILY POVERTY
100.0/ 100
METRIC RATING
13th/ 347
METRIC RANK
4.4%
MARRIED-COUPLE FAMILY POVERTY
99.6/ 100
METRIC RATING
61st/ 347
METRIC RANK
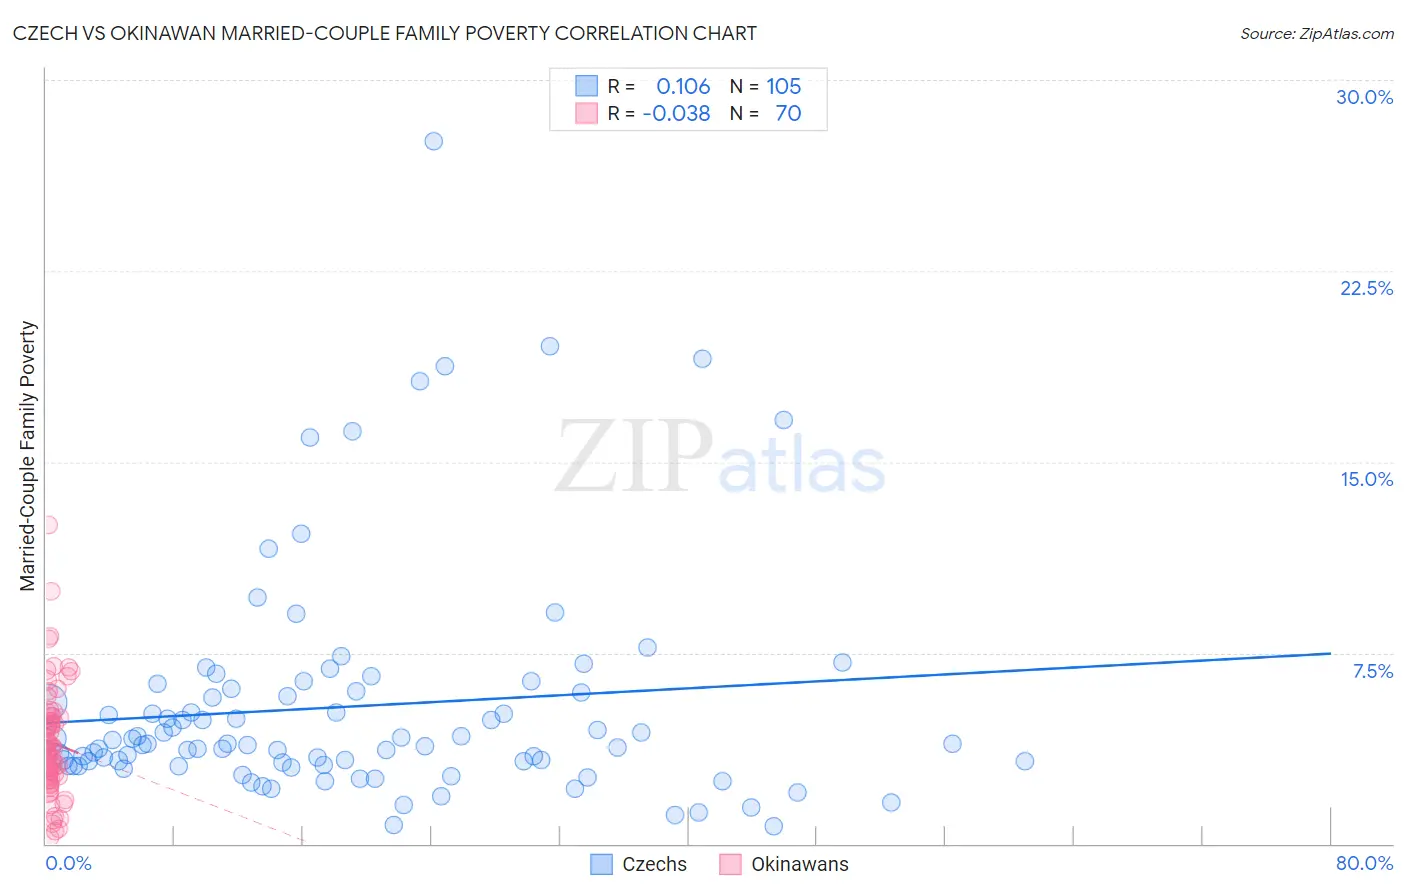
Czech vs Okinawan Married-Couple Family Poverty Correlation Chart
The statistical analysis conducted on geographies consisting of 476,498,804 people shows a poor positive correlation between the proportion of Czechs and poverty level among married-couple families in the United States with a correlation coefficient (R) of 0.106 and weighted average of 4.0%. Similarly, the statistical analysis conducted on geographies consisting of 73,604,889 people shows no correlation between the proportion of Okinawans and poverty level among married-couple families in the United States with a correlation coefficient (R) of -0.038 and weighted average of 4.4%, a difference of 8.9%.
Married-Couple Family Poverty Correlation Summary
| Measurement | Czech | Okinawan |
| Minimum | 0.69% | 0.25% |
| Maximum | 27.6% | 12.5% |
| Range | 26.9% | 12.3% |
| Mean | 5.4% | 4.0% |
| Median | 3.9% | 3.7% |
| Interquartile 25% (IQ1) | 3.1% | 2.5% |
| Interquartile 75% (IQ3) | 6.0% | 5.0% |
| Interquartile Range (IQR) | 2.9% | 2.5% |
| Standard Deviation (Sample) | 4.5% | 2.2% |
| Standard Deviation (Population) | 4.5% | 2.2% |
Similar Demographics by Married-Couple Family Poverty
Demographics Similar to Czechs by Married-Couple Family Poverty
In terms of married-couple family poverty, the demographic groups most similar to Czechs are Slovak (4.0%, a difference of 0.040%), Polish (4.0%, a difference of 0.070%), German (4.0%, a difference of 0.34%), Filipino (4.0%, a difference of 0.37%), and Italian (4.0%, a difference of 0.38%).
| Demographics | Rating | Rank | Married-Couple Family Poverty |
| Luxembourgers | 100.0 /100 | #6 | Exceptional 3.9% |
| Latvians | 100.0 /100 | #7 | Exceptional 3.9% |
| Thais | 100.0 /100 | #8 | Exceptional 3.9% |
| Croatians | 100.0 /100 | #9 | Exceptional 3.9% |
| Carpatho Rusyns | 100.0 /100 | #10 | Exceptional 3.9% |
| Lithuanians | 100.0 /100 | #11 | Exceptional 4.0% |
| Bulgarians | 100.0 /100 | #12 | Exceptional 4.0% |
| Czechs | 100.0 /100 | #13 | Exceptional 4.0% |
| Slovaks | 100.0 /100 | #14 | Exceptional 4.0% |
| Poles | 100.0 /100 | #15 | Exceptional 4.0% |
| Germans | 100.0 /100 | #16 | Exceptional 4.0% |
| Filipinos | 100.0 /100 | #17 | Exceptional 4.0% |
| Italians | 100.0 /100 | #18 | Exceptional 4.0% |
| Immigrants | Ireland | 99.9 /100 | #19 | Exceptional 4.1% |
| Maltese | 99.9 /100 | #20 | Exceptional 4.1% |
Demographics Similar to Okinawans by Married-Couple Family Poverty
In terms of married-couple family poverty, the demographic groups most similar to Okinawans are Immigrants from Australia (4.4%, a difference of 0.010%), Tlingit-Haida (4.4%, a difference of 0.11%), Immigrants from Sweden (4.4%, a difference of 0.18%), Immigrants from Sri Lanka (4.4%, a difference of 0.37%), and Czechoslovakian (4.4%, a difference of 0.73%).
| Demographics | Rating | Rank | Married-Couple Family Poverty |
| Austrians | 99.7 /100 | #54 | Exceptional 4.3% |
| French | 99.7 /100 | #55 | Exceptional 4.3% |
| Immigrants | Zimbabwe | 99.7 /100 | #56 | Exceptional 4.3% |
| Immigrants | Netherlands | 99.7 /100 | #57 | Exceptional 4.3% |
| Czechoslovakians | 99.7 /100 | #58 | Exceptional 4.4% |
| Immigrants | Sweden | 99.6 /100 | #59 | Exceptional 4.4% |
| Tlingit-Haida | 99.6 /100 | #60 | Exceptional 4.4% |
| Okinawans | 99.6 /100 | #61 | Exceptional 4.4% |
| Immigrants | Australia | 99.6 /100 | #62 | Exceptional 4.4% |
| Immigrants | Sri Lanka | 99.6 /100 | #63 | Exceptional 4.4% |
| Immigrants | Bulgaria | 99.5 /100 | #64 | Exceptional 4.4% |
| Macedonians | 99.4 /100 | #65 | Exceptional 4.4% |
| Immigrants | Serbia | 99.4 /100 | #66 | Exceptional 4.4% |
| Immigrants | Canada | 99.4 /100 | #67 | Exceptional 4.4% |
| Slavs | 99.4 /100 | #68 | Exceptional 4.4% |