Zip Codes with the Highest Percentage of Population with a Degree in Liberal Arts and History in Pottstown, PA
RELATED REPORTS & OPTIONS
Liberal Arts and History
Pottstown
Compare Zip Codes
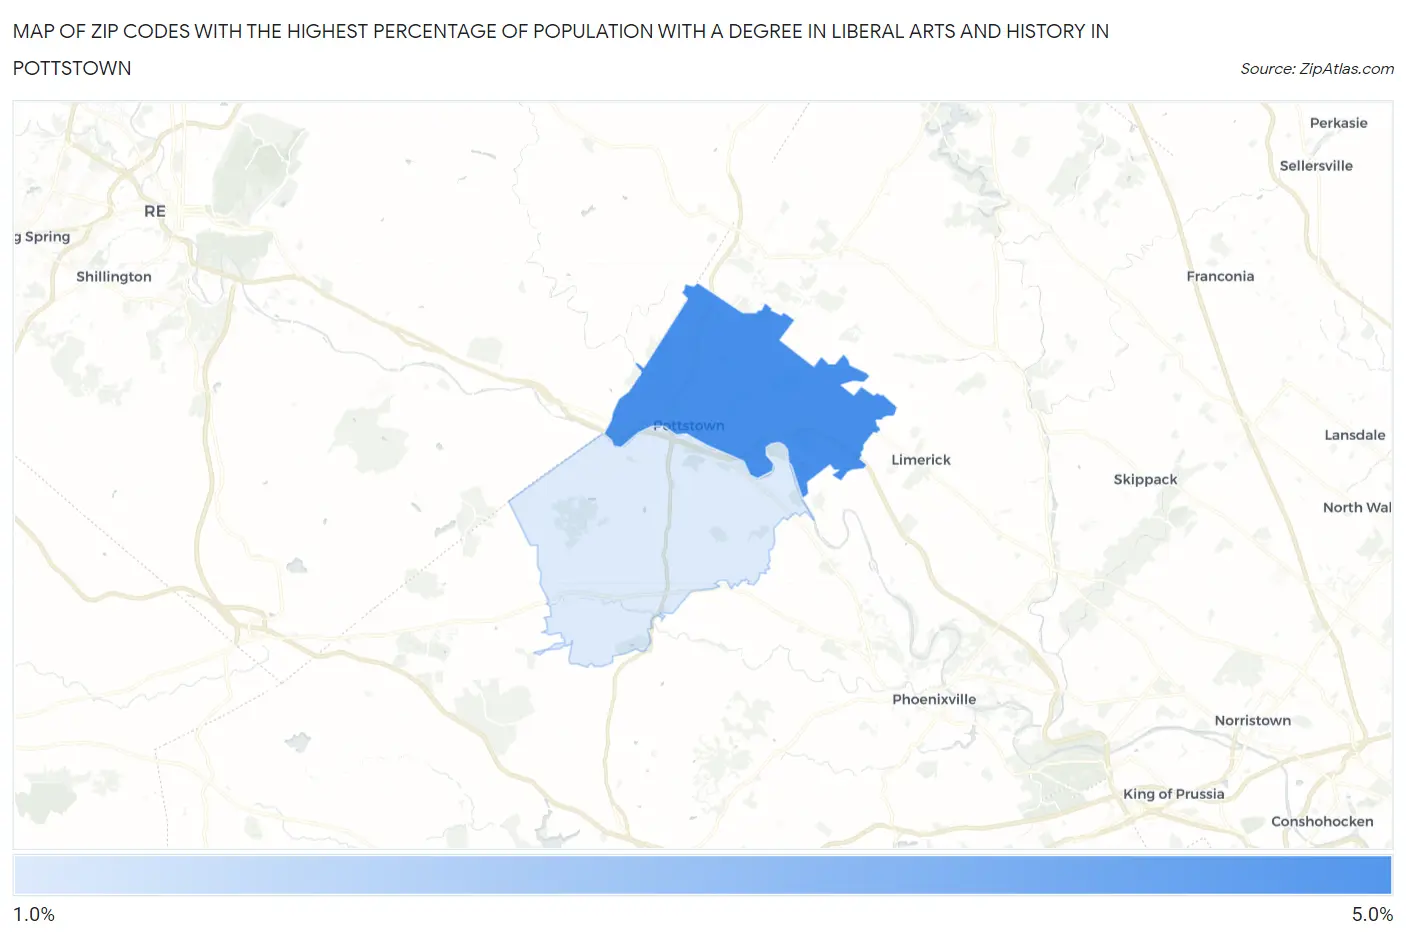
Map of Zip Codes with the Highest Percentage of Population with a Degree in Liberal Arts and History in Pottstown
0.0%
5.0%
Zip Codes with the Highest Percentage of Population with a Degree in Liberal Arts and History in Pottstown, PA
| Zip Code | % Graduates | vs State | vs National | |
| 1. | 19464 | 4.8% | 4.6%(+0.161)#606 | 4.9%(-0.101)#12,065 |
| 2. | 19465 | 1.8% | 4.6%(-2.82)#1,125 | 4.9%(-3.09)#21,870 |
1
Common Questions
What are the Top Zip Codes with the Highest Percentage of Population with a Degree in Liberal Arts and History in Pottstown, PA?
Top Zip Codes with the Highest Percentage of Population with a Degree in Liberal Arts and History in Pottstown, PA are:
What zip code has the Highest Percentage of Population with a Degree in Liberal Arts and History in Pottstown, PA?
19464 has the Highest Percentage of Population with a Degree in Liberal Arts and History in Pottstown, PA with 4.8%.
What is the Percentage of Population with a Degree in Liberal Arts and History in Pennsylvania?
Percentage of Population with a Degree in Liberal Arts and History in Pennsylvania is 4.6%.
What is the Percentage of Population with a Degree in Liberal Arts and History in the United States?
Percentage of Population with a Degree in Liberal Arts and History in the United States is 4.9%.