Zip Codes with the Highest Percentage of Population Taking Taxi / Cab to Work in Springfield, OH
RELATED REPORTS & OPTIONS
Taxi / Cab
Springfield
Compare Zip Codes
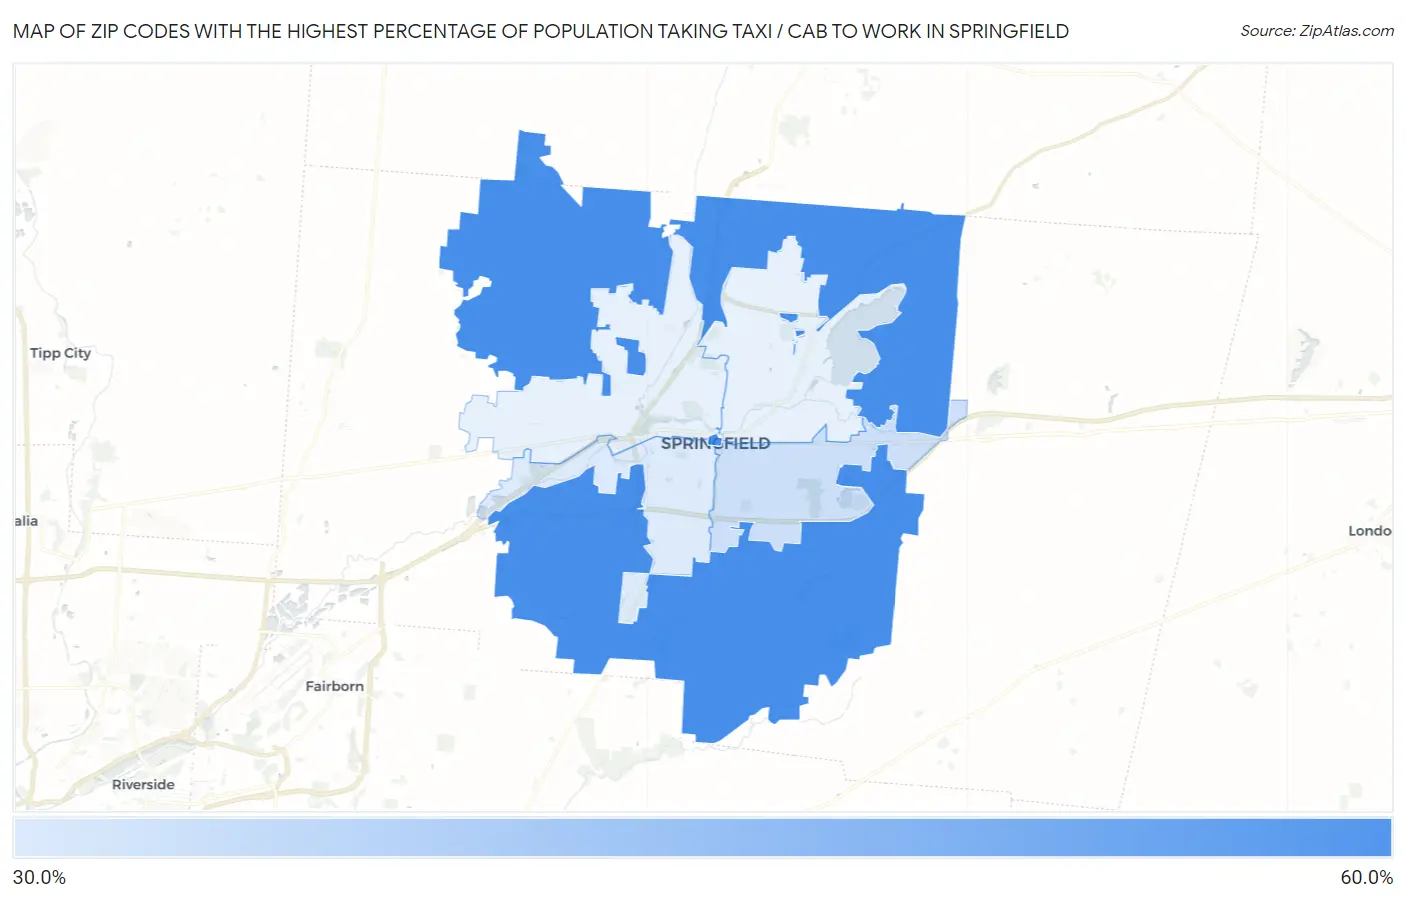
Map of Zip Codes with the Highest Percentage of Population Taking Taxi / Cab to Work in Springfield
0.0%
60.0%
Zip Codes with the Highest Percentage of Population Taking Taxi / Cab to Work in Springfield, OH
| Zip Code | % Take Taxi / Cab | vs State | vs National | |
| 1. | 45502 | 52.2% | 37.6%(+14.6)#99 | 38.2%(+14.0)#2,323 |
| 2. | 45505 | 39.5% | 37.6%(+1.90)#232 | 38.2%(+1.30)#6,844 |
| 3. | 45506 | 38.0% | 37.6%(+0.400)#248 | 38.2%(-0.200)#7,503 |
1
Common Questions
What are the Top 3 Zip Codes with the Highest Percentage of Population Taking Taxi / Cab to Work in Springfield, OH?
Top 3 Zip Codes with the Highest Percentage of Population Taking Taxi / Cab to Work in Springfield, OH are:
What zip code has the Highest Percentage of Population Taking Taxi / Cab to Work in Springfield, OH?
45502 has the Highest Percentage of Population Taking Taxi / Cab to Work in Springfield, OH with 52.2%.
What is the Percentage of Population Taking Taxi / Cab to Work in Springfield, OH?
Percentage of Population Taking Taxi / Cab to Work in Springfield is 58.2%.
What is the Percentage of Population Taking Taxi / Cab to Work in Ohio?
Percentage of Population Taking Taxi / Cab to Work in Ohio is 37.6%.
What is the Percentage of Population Taking Taxi / Cab to Work in the United States?
Percentage of Population Taking Taxi / Cab to Work in the United States is 38.2%.