Zip Codes with the Highest Percentage of Population Employed in Arts, Media & Entertainment in Cleveland, OH

RELATED REPORTS & OPTIONS

Arts, Media & Entertainment
Population
Families and Households
Female Fertility
Female Fertility (Unmarried)
Race (Community Size)
Race (Percentage)
Ancestry (Community Size)
AfghanAfricanAlbanianAlsatianAmericanApacheArabArgentineanArmenianAustralianAustrianBahamianBangladeshiBarbadianBelgianBelizeanBhutaneseBlackfeetBrazilianBritishBritish West IndianBulgarianBurmeseCajunCambodianCanadianCape VerdeanCarpatho RusynCelticCentral AmericanCentral American IndianCherokeeChickasawChileanChippewaChoctawColombianComancheCosta RicanCreekCroatianCubanCzechCzechoslovakianDanishDelawareDominicanDutchDutch West IndianEastern EuropeanEcuadorianEgyptianEnglishEstonianEthiopianEuropeanFilipinoFinnishFrenchFrench American IndianFrench CanadianGermanGhanaianGreekGuamanian / ChamorroGuatemalanGuyaneseHaitianHonduranHungarianIcelanderIndian (Asian)IndonesianIranianIraqiIrishIroquoisIsraeliItalianJamaicanJapaneseJordanianKoreanLaotianLatvianLebaneseLiberianLithuanianLumbeeLuxembourgerMacedonianMalaysianMexicanMexican American IndianMongolianMoroccanNative HawaiianNavajoNicaraguanNigerianNorthern EuropeanNorwegianPakistaniPalestinianPanamanianParaguayanPennsylvania GermanPeruvianPolishPortuguesePuebloPuerto RicanRomanianRussianSalvadoranSamoanScandinavianScotch-IrishScottishSeminoleSerbianSierra LeoneanSiouxSlavicSlovakSloveneSomaliSouth AfricanSouth AmericanSouth American IndianSpaniardSpanishSri LankanSubsaharan AfricanSudaneseSwedishSwissSyrianThaiTrinidadian and TobagonianTurkishU.S. Virgin IslanderUgandanUkrainianUruguayanVenezuelanVietnameseWelshWest IndianYaquiYugoslavianZimbabwean
Ancestry (Percentage)
AfghanAfricanAlbanianAlsatianAmericanApacheArabArgentineanArmenianAustralianAustrianBahamianBangladeshiBarbadianBelgianBelizeanBhutaneseBlackfeetBrazilianBritishBritish West IndianBulgarianBurmeseCajunCambodianCanadianCape VerdeanCarpatho RusynCelticCentral AmericanCentral American IndianCherokeeChickasawChileanChippewaChoctawColombianComancheCosta RicanCreekCroatianCubanCzechCzechoslovakianDanishDelawareDominicanDutchDutch West IndianEastern EuropeanEcuadorianEgyptianEnglishEstonianEthiopianEuropeanFilipinoFinnishFrenchFrench American IndianFrench CanadianGermanGhanaianGreekGuamanian / ChamorroGuatemalanGuyaneseHaitianHonduranHungarianIcelanderIndian (Asian)IndonesianIranianIraqiIrishIroquoisIsraeliItalianJamaicanJapaneseJordanianKoreanLaotianLatvianLebaneseLiberianLithuanianLumbeeLuxembourgerMacedonianMalaysianMexicanMexican American IndianMongolianMoroccanNative HawaiianNavajoNicaraguanNigerianNorthern EuropeanNorwegianPakistaniPalestinianPanamanianParaguayanPennsylvania GermanPeruvianPolishPortuguesePuebloPuerto RicanRomanianRussianSalvadoranSamoanScandinavianScotch-IrishScottishSeminoleSerbianSierra LeoneanSiouxSlavicSlovakSloveneSomaliSouth AfricanSouth AmericanSouth American IndianSpaniardSpanishSri LankanSubsaharan AfricanSudaneseSwedishSwissSyrianThaiTrinidadian and TobagonianTurkishU.S. Virgin IslanderUgandanUkrainianUruguayanVenezuelanVietnameseWelshWest IndianYaquiYugoslavianZimbabwean
Immigrant Origin (Total)
AfghanistanAfricaAlbaniaArgentinaAsiaAustraliaAustriaBangladeshBarbadosBelarusBelgiumBelizeBosnia and HerzegovinaBrazilBulgariaBurma / MyanmarCambodiaCanadaCaribbeanCentral AmericaChileChinaColombiaCongoCosta RicaCroatiaCubaCzechoslovakiaDominican RepublicEastern AfricaEastern AsiaEastern EuropeEcuadorEgyptEl SalvadorEnglandEthiopiaEuropeFranceGermanyGhanaGreeceGuatemalaGuyanaHaitiHondurasHong KongHungaryIndiaIndonesiaIranIraqIrelandIsraelItalyJamaicaJapanJordanKazakhstanKenyaKoreaKuwaitLaosLatin AmericaLatviaLebanonLiberiaLithuaniaMalaysiaMexicoMiddle AfricaMoldovaMoroccoNepalNetherlandsNicaraguaNigeriaNorthern AfricaNorthern EuropeOceaniaPakistanPanamaPeruPhilippinesPolandRomaniaRussiaSaudi ArabiaScotlandSerbiaSierra LeoneSingaporeSomaliaSouth AfricaSouth AmericaSouth Central AsiaSouth Eastern AsiaSouthern EuropeSpainSri LankaSudanSwedenSyriaTaiwanThailandTrinidad and TobagoTurkeyUgandaUkraineUruguayUzbekistanVenezuelaVietnamWest IndiesWestern AfricaWestern AsiaWestern EuropeZaireZimbabwe
Immigrant Origin (Percentage)
AfghanistanAfricaAlbaniaArgentinaAsiaAustraliaAustriaBangladeshBarbadosBelarusBelgiumBelizeBosnia and HerzegovinaBrazilBulgariaBurma / MyanmarCambodiaCanadaCaribbeanCentral AmericaChileChinaColombiaCongoCosta RicaCroatiaCubaCzechoslovakiaDominican RepublicEastern AfricaEastern AsiaEastern EuropeEcuadorEgyptEl SalvadorEnglandEthiopiaEuropeFranceGermanyGhanaGreeceGuatemalaGuyanaHaitiHondurasHong KongHungaryIndiaIndonesiaIranIraqIrelandIsraelItalyJamaicaJapanJordanKazakhstanKenyaKoreaKuwaitLaosLatin AmericaLatviaLebanonLiberiaLithuaniaMalaysiaMexicoMiddle AfricaMoldovaMoroccoNepalNetherlandsNicaraguaNigeriaNorthern AfricaNorthern EuropeOceaniaPakistanPanamaPeruPhilippinesPolandRomaniaRussiaSaudi ArabiaScotlandSerbiaSierra LeoneSingaporeSomaliaSouth AfricaSouth AmericaSouth Central AsiaSouth Eastern AsiaSouthern EuropeSpainSri LankaSudanSwedenSyriaTaiwanThailandTrinidad and TobagoTurkeyUgandaUkraineUruguayUzbekistanVenezuelaVietnamWest IndiesWestern AfricaWestern AsiaWestern EuropeZaireZimbabwe
Income
Income (Families)
Income (Households)
Poverty
Poverty (Families)
Unemployment
Employment Occupations
Employment Industries
Employer Class
Commute Time
Commute Means
School Enrollment
Education by Degree Field
Occupancy
Finances
Physical Characteristics
Cleveland
Compare Zip Codes
Comparison Subject

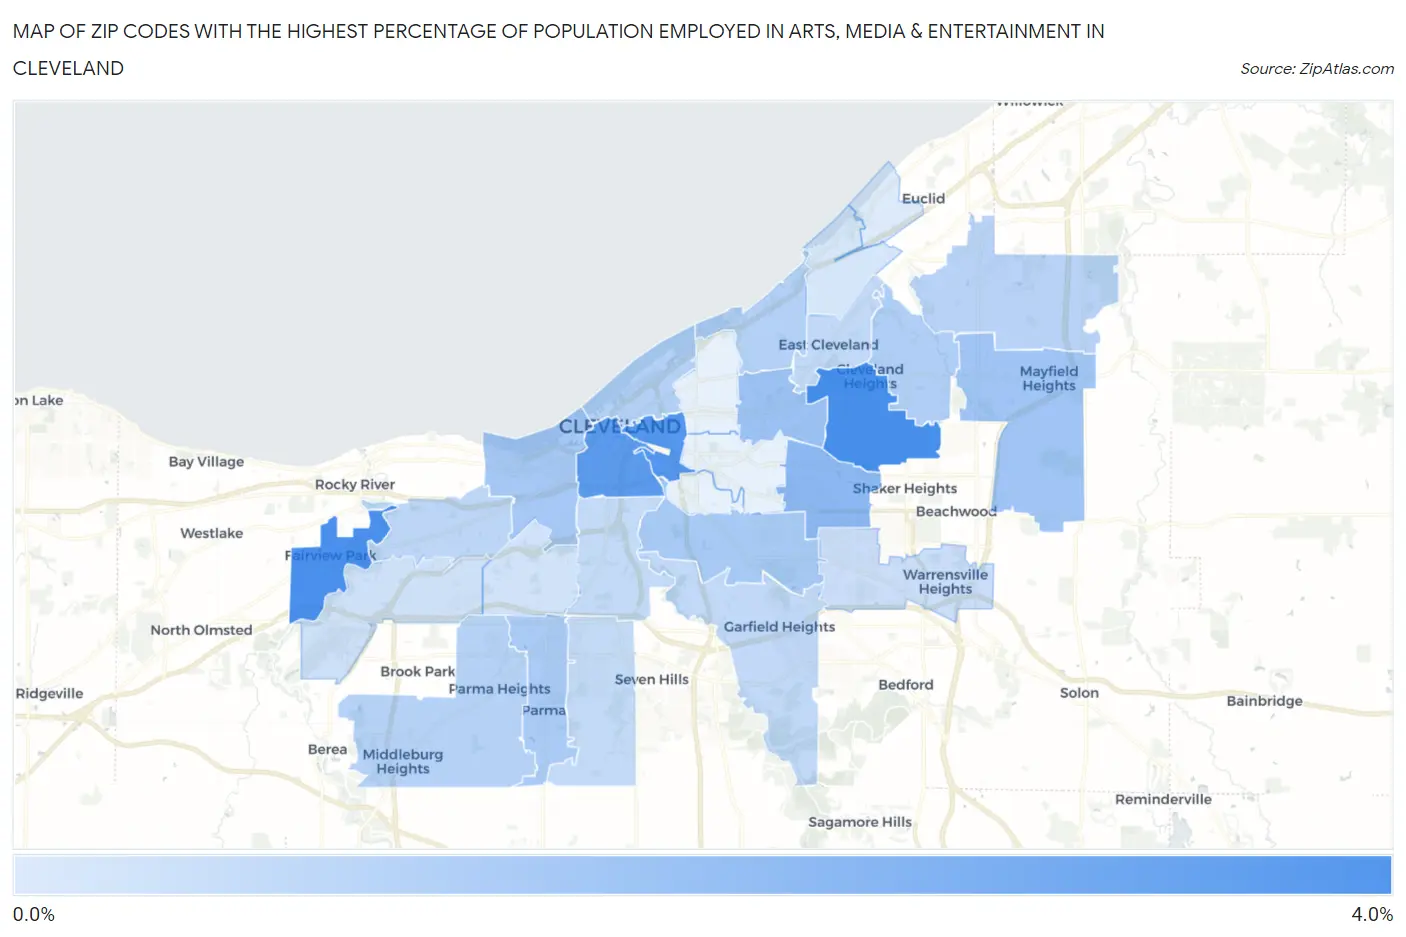
Map of Zip Codes with the Highest Percentage of Population Employed in Arts, Media & Entertainment in Cleveland

0.0%
4.0%
Zip Codes with the Highest Percentage of Population Employed in Arts, Media & Entertainment in Cleveland Map

Zip Codes with the Highest Percentage of Population Employed in Arts, Media & Entertainment in Cleveland, OH

Zip Code % Employed vs State vs National
1.441183.8%1.6%(+2.23)#482.1%(+1.72)#2,654
2.441263.7%1.6%(+2.17)#512.1%(+1.66)#2,740
3.441153.5%1.6%(+1.92)#642.1%(+1.41)#3,112
4.441133.4%1.6%(+1.82)#692.1%(+1.31)#3,294
5.441202.3%1.6%(+0.739)#1632.1%(+0.230)#6,411
6.441062.0%1.6%(+0.469)#2192.1%(-0.040)#7,705
7.441241.8%1.6%(+0.277)#2542.1%(-0.232)#8,804
8.441021.8%1.6%(+0.213)#2682.1%(-0.297)#9,189
9.441051.7%1.6%(+0.152)#2842.1%(-0.358)#9,594
10.441291.7%1.6%(+0.124)#2942.1%(-0.385)#9,811
11.441211.5%1.6%(-0.062)#3502.1%(-0.571)#11,046
12.441081.5%1.6%(-0.090)#3572.1%(-0.600)#11,257
13.441141.5%1.6%(-0.094)#3582.1%(-0.603)#11,293
14.441301.4%1.6%(-0.121)#3622.1%(-0.631)#11,491
15.441431.3%1.6%(-0.209)#3892.1%(-0.718)#12,143
16.441111.3%1.6%(-0.281)#4122.1%(-0.791)#12,676
17.441251.2%1.6%(-0.399)#4562.1%(-0.908)#13,569
18.441121.1%1.6%(-0.404)#4642.1%(-0.913)#13,615
19.441341.1%1.6%(-0.418)#4662.1%(-0.928)#13,710
20.441091.1%1.6%(-0.434)#4672.1%(-0.943)#13,844
21.441280.99%1.6%(-0.561)#5042.1%(-1.07)#14,883
22.441350.87%1.6%(-0.678)#5392.1%(-1.19)#15,859
23.441440.84%1.6%(-0.712)#5432.1%(-1.22)#16,111
24.441100.73%1.6%(-0.819)#5882.1%(-1.33)#16,966
25.441190.58%1.6%(-0.971)#6472.1%(-1.48)#18,207

Common Questions

What are the Top 10 Zip Codes with the Highest Percentage of Population Employed in Arts, Media & Entertainment in Cleveland, OH?
Top 10 Zip Codes with the Highest Percentage of Population Employed in Arts, Media & Entertainment in Cleveland, OH are:
#1
3.8%
#2
3.7%
#3
3.5%
#4
3.4%
#5
2.3%
#6
2.0%
#7
1.8%
#8
1.8%
#9
1.7%
#10
1.7%
What zip code has the Highest Percentage of Population Employed in Arts, Media & Entertainment in Cleveland, OH?
44118 has the Highest Percentage of Population Employed in Arts, Media & Entertainment in Cleveland, OH with 3.8%.
What is the Percentage of Population Employed in Arts, Media & Entertainment in Cleveland, OH?
Percentage of Population Employed in Arts, Media & Entertainment in Cleveland is 1.4%.
What is the Percentage of Population Employed in Arts, Media & Entertainment in Ohio?
Percentage of Population Employed in Arts, Media & Entertainment in Ohio is 1.6%.
What is the Percentage of Population Employed in Arts, Media & Entertainment in the United States?
Percentage of Population Employed in Arts, Media & Entertainment in the United States is 2.1%.