Acomita Lake, NM
Acomita Lake Map
Acomita Lake Overview
728
TOTAL POPULATION
402
MALE POPULATION
326
FEMALE POPULATION
123.31
MALES / 100 FEMALES
81.09
FEMALES / 100 MALES
37.7
MEDIAN AGE
5.7
AVG FAMILY SIZE
5.3
AVG HOUSEHOLD SIZE
$15,402
PER CAPITA INCOME
$80,060
AVG FAMILY INCOME
$78,417
AVG HOUSEHOLD INCOME
0.32
INEQUALITY / GINI INDEX
372
LABOR FORCE [ PEOPLE ]
65.7%
PERCENT IN LABOR FORCE
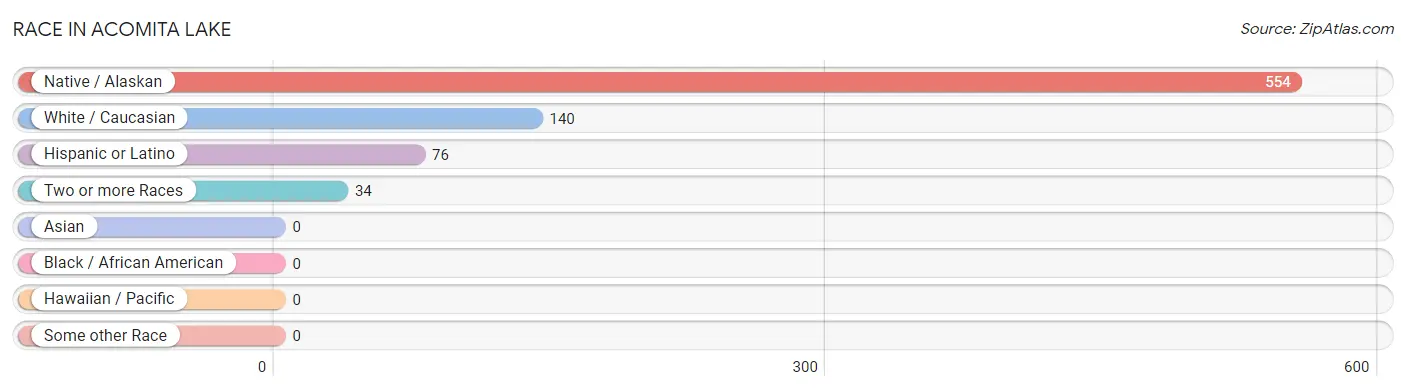
Race in Acomita Lake
The most populous races in Acomita Lake are Native / Alaskan (554 | 76.1%), White / Caucasian (140 | 19.2%), and Hispanic or Latino (76 | 10.4%).
| Race | # Population | % Population |
| Asian | 0 | 0.0% |
| Black / African American | 0 | 0.0% |
| Hawaiian / Pacific | 0 | 0.0% |
| Hispanic or Latino | 76 | 10.4% |
| Native / Alaskan | 554 | 76.1% |
| White / Caucasian | 140 | 19.2% |
| Two or more Races | 34 | 4.7% |
| Some other Race | 0 | 0.0% |
| Total | 728 | 100.0% |
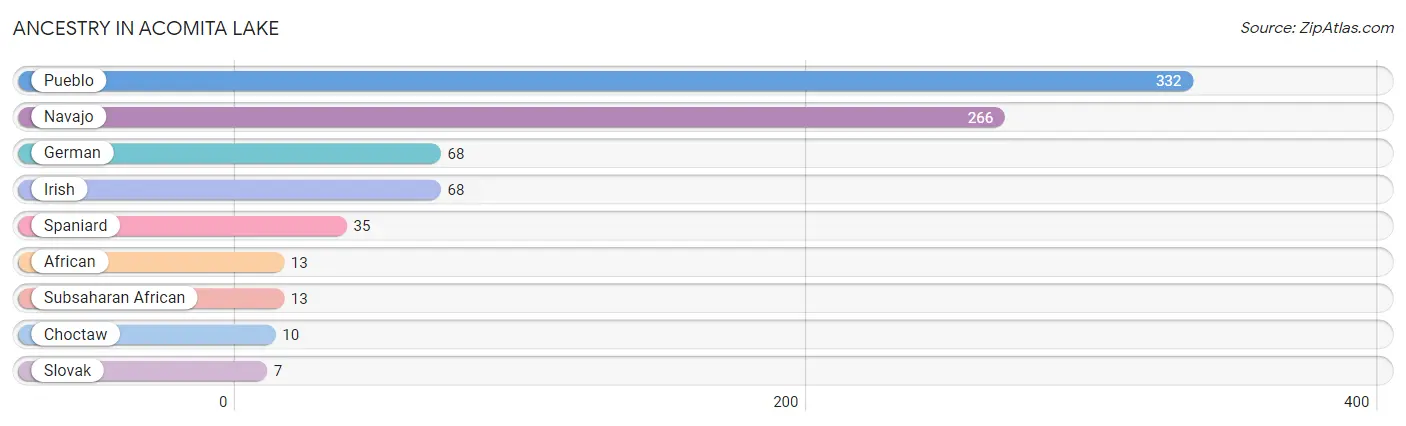
Ancestry in Acomita Lake
The most populous ancestries reported in Acomita Lake are Pueblo (332 | 45.6%), Navajo (266 | 36.5%), German (68 | 9.3%), Irish (68 | 9.3%), and Spaniard (35 | 4.8%), together accounting for 105.6% of all Acomita Lake residents.
| Ancestry | # Population | % Population |
| African | 13 | 1.8% |
| Choctaw | 10 | 1.4% |
| German | 68 | 9.3% |
| Irish | 68 | 9.3% |
| Navajo | 266 | 36.5% |
| Pueblo | 332 | 45.6% |
| Slovak | 7 | 1.0% |
| Spaniard | 35 | 4.8% |
| Subsaharan African | 13 | 1.8% | View All 9 Rows |
Immigrants in Acomita Lake
The most numerous immigrant groups reported in Acomita Lake came from , and Canada (37 | 5.1%), together accounting for 5.1% of all Acomita Lake residents.

| Immigration Origin | # Population | % Population |
| Canada | 37 | 5.1% | View All 1 Rows |
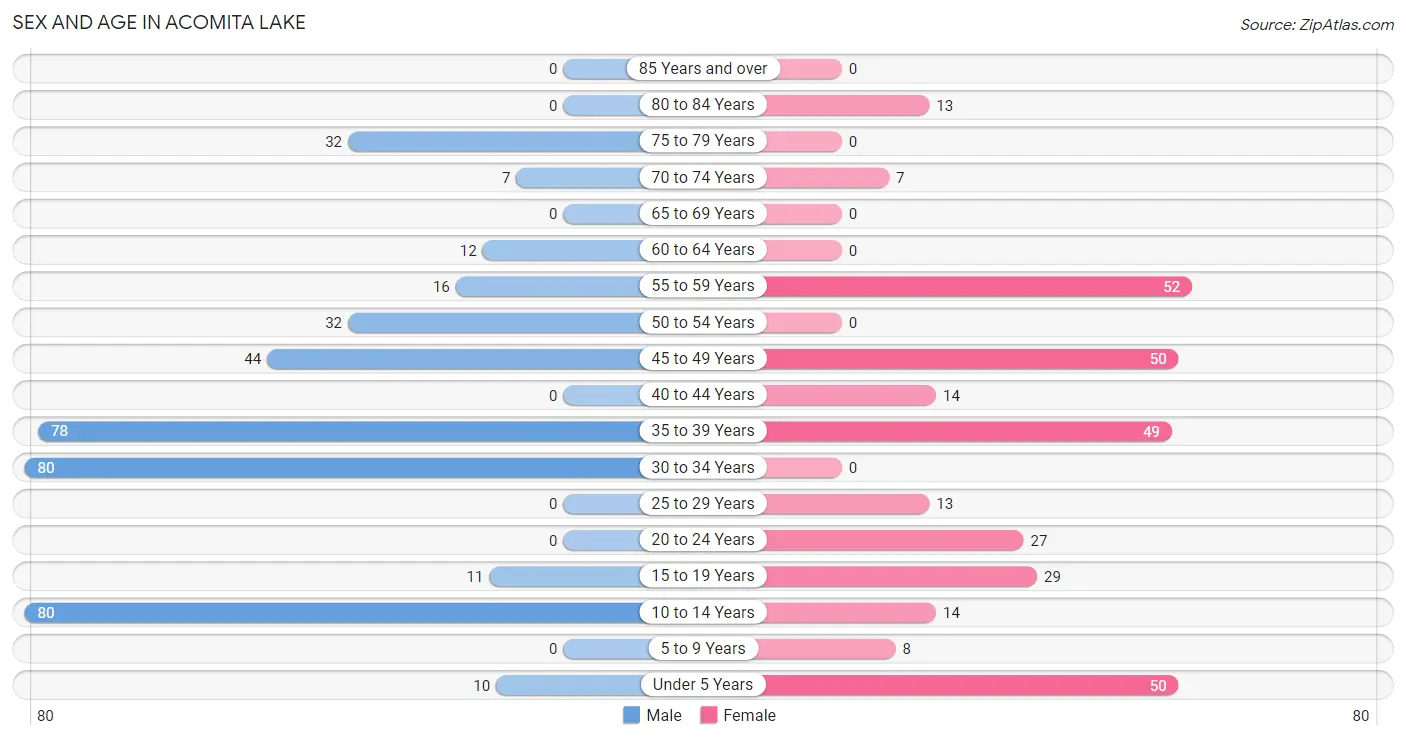
Sex and Age in Acomita Lake
Sex and Age in Acomita Lake
The most populous age groups in Acomita Lake are 10 to 14 Years (80 | 19.9%) for men and 55 to 59 Years (52 | 16.0%) for women.
| Age Bracket | Male | Female |
| Under 5 Years | 10 (2.5%) | 50 (15.3%) |
| 5 to 9 Years | 0 (0.0%) | 8 (2.5%) |
| 10 to 14 Years | 80 (19.9%) | 14 (4.3%) |
| 15 to 19 Years | 11 (2.7%) | 29 (8.9%) |
| 20 to 24 Years | 0 (0.0%) | 27 (8.3%) |
| 25 to 29 Years | 0 (0.0%) | 13 (4.0%) |
| 30 to 34 Years | 80 (19.9%) | 0 (0.0%) |
| 35 to 39 Years | 78 (19.4%) | 49 (15.0%) |
| 40 to 44 Years | 0 (0.0%) | 14 (4.3%) |
| 45 to 49 Years | 44 (11.0%) | 50 (15.3%) |
| 50 to 54 Years | 32 (8.0%) | 0 (0.0%) |
| 55 to 59 Years | 16 (4.0%) | 52 (16.0%) |
| 60 to 64 Years | 12 (3.0%) | 0 (0.0%) |
| 65 to 69 Years | 0 (0.0%) | 0 (0.0%) |
| 70 to 74 Years | 7 (1.7%) | 7 (2.1%) |
| 75 to 79 Years | 32 (8.0%) | 0 (0.0%) |
| 80 to 84 Years | 0 (0.0%) | 13 (4.0%) |
| 85 Years and over | 0 (0.0%) | 0 (0.0%) |
| Total | 402 (100.0%) | 326 (100.0%) |
Families and Households in Acomita Lake
Median Family Size in Acomita Lake
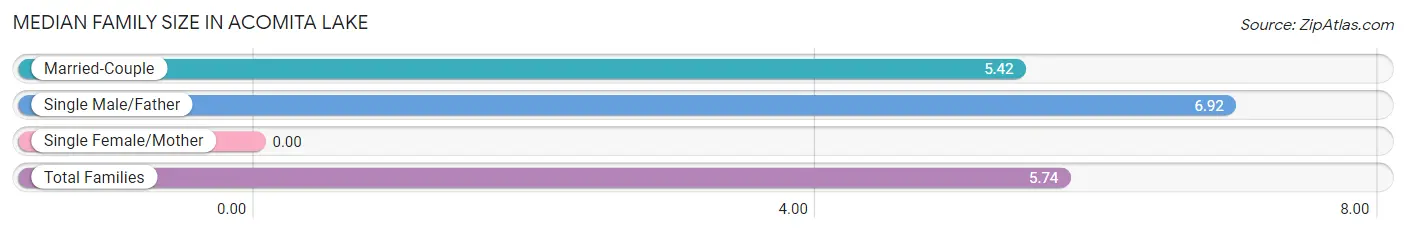
| Family Type | # Families | Family Size |
| Married-Couple | 91 (78.4%) | 5.42 |
| Single Male/Father | 25 (21.5%) | 6.92 |
| Single Female/Mother | 0 (0.0%) | - |
| Total Families | 116 (100.0%) | 5.74 |
Median Household Size in Acomita Lake
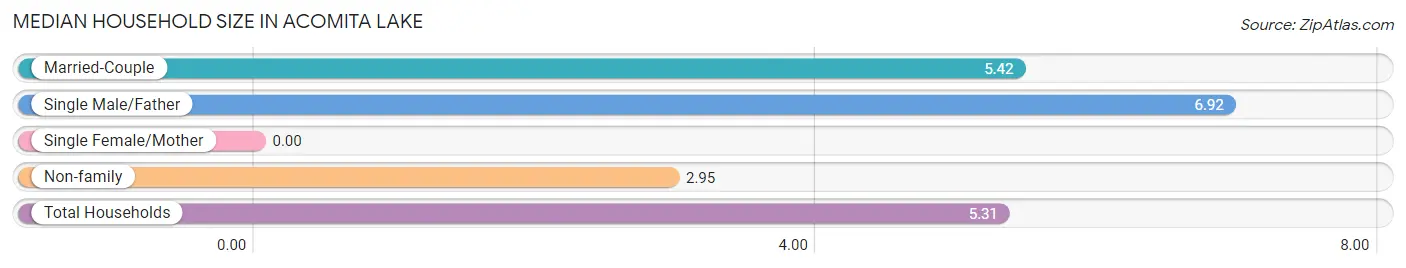
| Household Type | # Households | Household Size |
| Married-Couple | 91 (66.4%) | 5.42 |
| Single Male/Father | 25 (18.2%) | 6.92 |
| Single Female/Mother | 0 (0.0%) | - |
| Non-family | 21 (15.3%) | 2.95 |
| Total Households | 137 (100.0%) | 5.31 |
Household Size by Marriage Status in Acomita Lake
Out of a total of 137 households in Acomita Lake, 116 (84.7%) are family households, while 21 (15.3%) are nonfamily households. The most numerous type of family households are 6-person households, comprising 42, and the most common type of nonfamily households are 2-person households, comprising 13.
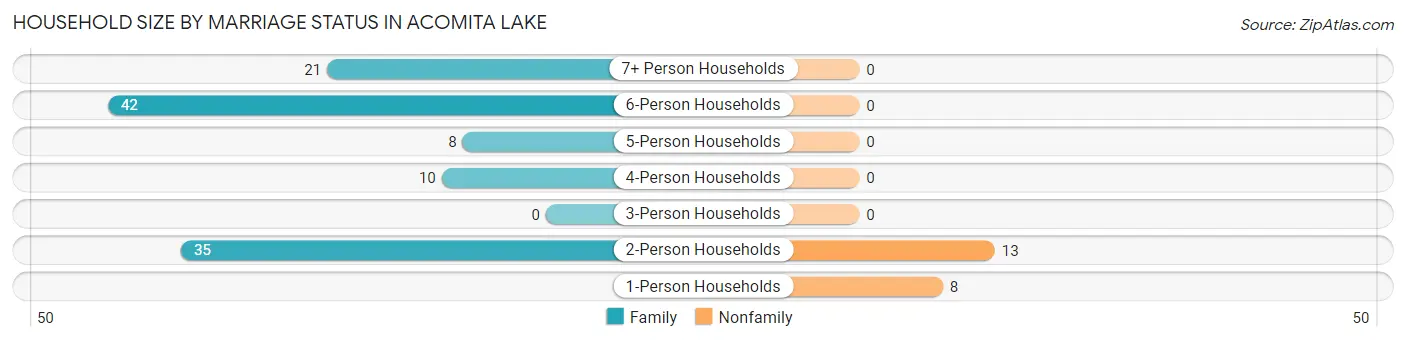
| Household Size | Family Households | Nonfamily Households |
| 1-Person Households | - | 8 (5.8%) |
| 2-Person Households | 35 (25.6%) | 13 (9.5%) |
| 3-Person Households | 0 (0.0%) | 0 (0.0%) |
| 4-Person Households | 10 (7.3%) | 0 (0.0%) |
| 5-Person Households | 8 (5.8%) | 0 (0.0%) |
| 6-Person Households | 42 (30.7%) | 0 (0.0%) |
| 7+ Person Households | 21 (15.3%) | 0 (0.0%) |
| Total | 116 (84.7%) | 21 (15.3%) |
Female Fertility in Acomita Lake
Fertility by Age in Acomita Lake
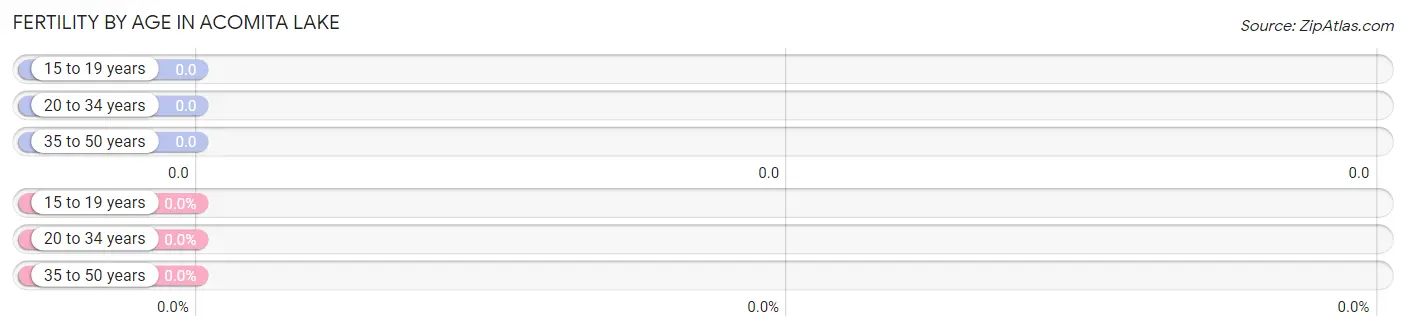
| Age Bracket | Women with Births | Births / 1,000 Women |
| 15 to 19 years | 0 (0.0%) | 0.0 |
| 20 to 34 years | 0 (0.0%) | 0.0 |
| 35 to 50 years | 0 (0.0%) | 0.0 |
| Total | 0 (0.0%) | 0.0 |
Fertility by Age by Marriage Status in Acomita Lake
| Age Bracket | Married | Unmarried |
| 15 to 19 years | 0 (0.0%) | 0 (0.0%) |
| 20 to 34 years | 0 (0.0%) | 0 (0.0%) |
| 35 to 50 years | 0 (0.0%) | 0 (0.0%) |
| Total | 0 (0.0%) | 0 (0.0%) |
Fertility by Education in Acomita Lake
| Educational Attainment | Women with Births | Births / 1,000 Women |
| Less than High School | 0 (0.0%) | 0.0 |
| High School Diploma | 0 (0.0%) | 0.0 |
| College or Associate's Degree | 0 (0.0%) | 0.0 |
| Bachelor's Degree | 0 (0.0%) | 0.0 |
| Graduate Degree | 0 (0.0%) | 0.0 |
| Total | 0 (0.0%) | 0.0 |
Fertility by Education by Marriage Status in Acomita Lake
| Educational Attainment | Married | Unmarried |
| Less than High School | 0 (0.0%) | 0 (0.0%) |
| High School Diploma | 0 (0.0%) | 0 (0.0%) |
| College or Associate's Degree | 0 (0.0%) | 0 (0.0%) |
| Bachelor's Degree | 0 (0.0%) | 0 (0.0%) |
| Graduate Degree | 0 (0.0%) | 0 (0.0%) |
| Total | 0 (0.0%) | 0 (0.0%) |
Income in Acomita Lake
Income Overview in Acomita Lake
Per Capita Income in Acomita Lake is $15,402, while median incomes of families and households are $80,060 and $78,417 respectively.
| Characteristic | Number | Measure |
| Per Capita Income | 728 | $15,402 |
| Median Family Income | 116 | $80,060 |
| Mean Family Income | 116 | $74,017 |
| Median Household Income | 137 | $78,417 |
| Mean Household Income | 137 | $67,536 |
| Income Deficit | 116 | $0 |
| Wage / Income Gap (%) | 728 | 0.00% |
| Wage / Income Gap ($) | 728 | 100.00¢ per $1 |
| Gini / Inequality Index | 728 | 0.32 |
Earnings by Sex in Acomita Lake
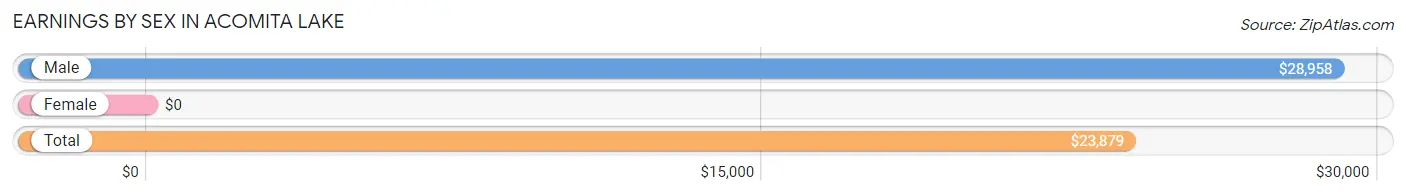
| Sex | Number | Average Earnings |
| Male | 222 (55.5%) | $28,958 |
| Female | 178 (44.5%) | $0 |
| Total | 400 (100.0%) | $23,879 |
Earnings by Sex by Income Bracket in Acomita Lake
The most common earnings brackets in Acomita Lake are $30,000 to $34,999 for men (72 | 32.4%) and $7,500 to $9,999 for women (49 | 27.5%).
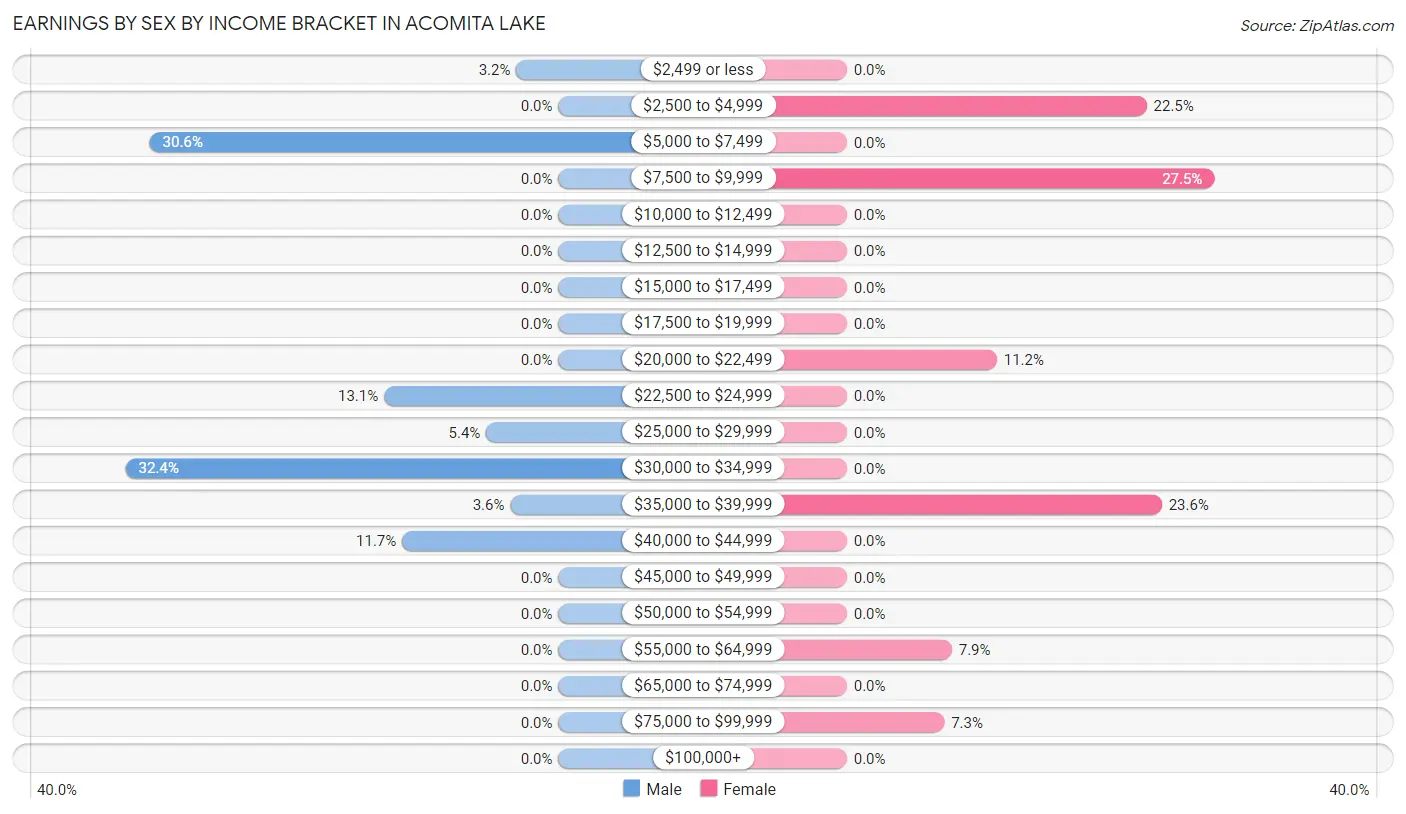
| Income | Male | Female |
| $2,499 or less | 7 (3.2%) | 0 (0.0%) |
| $2,500 to $4,999 | 0 (0.0%) | 40 (22.5%) |
| $5,000 to $7,499 | 68 (30.6%) | 0 (0.0%) |
| $7,500 to $9,999 | 0 (0.0%) | 49 (27.5%) |
| $10,000 to $12,499 | 0 (0.0%) | 0 (0.0%) |
| $12,500 to $14,999 | 0 (0.0%) | 0 (0.0%) |
| $15,000 to $17,499 | 0 (0.0%) | 0 (0.0%) |
| $17,500 to $19,999 | 0 (0.0%) | 0 (0.0%) |
| $20,000 to $22,499 | 0 (0.0%) | 20 (11.2%) |
| $22,500 to $24,999 | 29 (13.1%) | 0 (0.0%) |
| $25,000 to $29,999 | 12 (5.4%) | 0 (0.0%) |
| $30,000 to $34,999 | 72 (32.4%) | 0 (0.0%) |
| $35,000 to $39,999 | 8 (3.6%) | 42 (23.6%) |
| $40,000 to $44,999 | 26 (11.7%) | 0 (0.0%) |
| $45,000 to $49,999 | 0 (0.0%) | 0 (0.0%) |
| $50,000 to $54,999 | 0 (0.0%) | 0 (0.0%) |
| $55,000 to $64,999 | 0 (0.0%) | 14 (7.9%) |
| $65,000 to $74,999 | 0 (0.0%) | 0 (0.0%) |
| $75,000 to $99,999 | 0 (0.0%) | 13 (7.3%) |
| $100,000+ | 0 (0.0%) | 0 (0.0%) |
| Total | 222 (100.0%) | 178 (100.0%) |
Earnings by Sex by Educational Attainment in Acomita Lake
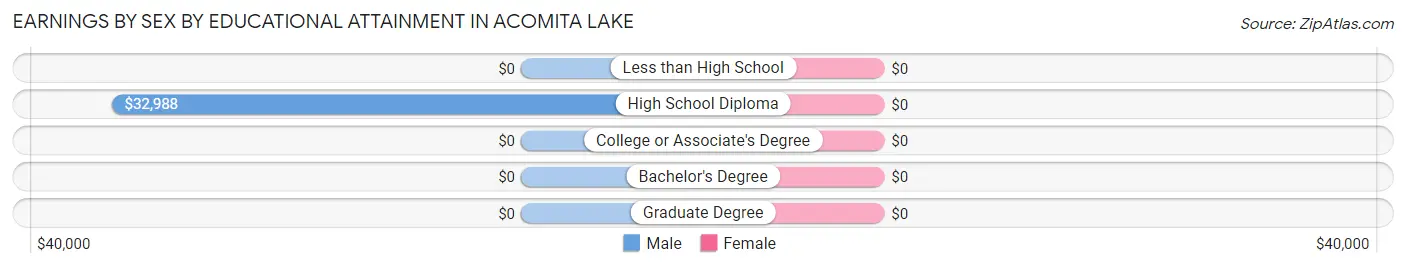
| Educational Attainment | Male Income | Female Income |
| Less than High School | - | - |
| High School Diploma | $32,988 | $0 |
| College or Associate's Degree | - | - |
| Bachelor's Degree | - | - |
| Graduate Degree | - | - |
| Total | $28,958 | $0 |
Family Income in Acomita Lake
Family Income Brackets in Acomita Lake
According to the Acomita Lake family income data, there are 57 families falling into the $75,000 to $99,999 income range, which is the most common income bracket and makes up 49.1% of all families.
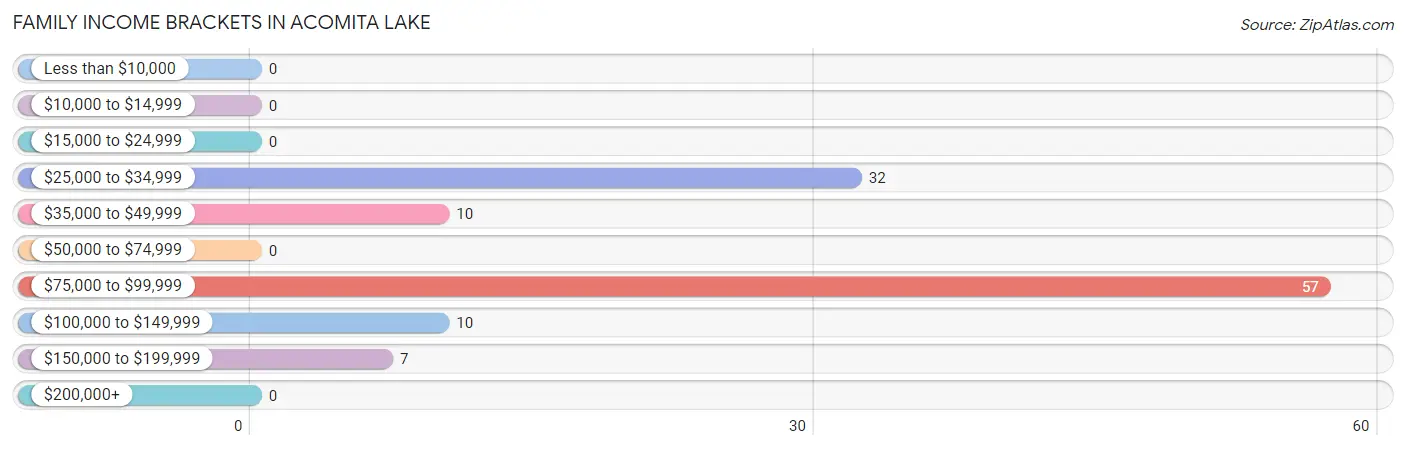
| Income Bracket | # Families | % Families |
| Less than $10,000 | 0 | 0.0% |
| $10,000 to $14,999 | 0 | 0.0% |
| $15,000 to $24,999 | 0 | 0.0% |
| $25,000 to $34,999 | 32 | 27.6% |
| $35,000 to $49,999 | 10 | 8.6% |
| $50,000 to $74,999 | 0 | 0.0% |
| $75,000 to $99,999 | 57 | 49.1% |
| $100,000 to $149,999 | 10 | 8.6% |
| $150,000 to $199,999 | 7 | 6.0% |
| $200,000+ | 0 | 0.0% |
Family Income by Famaliy Size in Acomita Lake
| Income Bracket | # Families | Median Income |
| 2-Person Families | 35 (30.2%) | $0 |
| 3-Person Families | 0 (0.0%) | $0 |
| 4-Person Families | 10 (8.6%) | $0 |
| 5-Person Families | 8 (6.9%) | $0 |
| 6-Person Families | 42 (36.2%) | $0 |
| 7+ Person Families | 21 (18.1%) | $0 |
| Total | 116 (100.0%) | $80,060 |
Family Income by Number of Earners in Acomita Lake
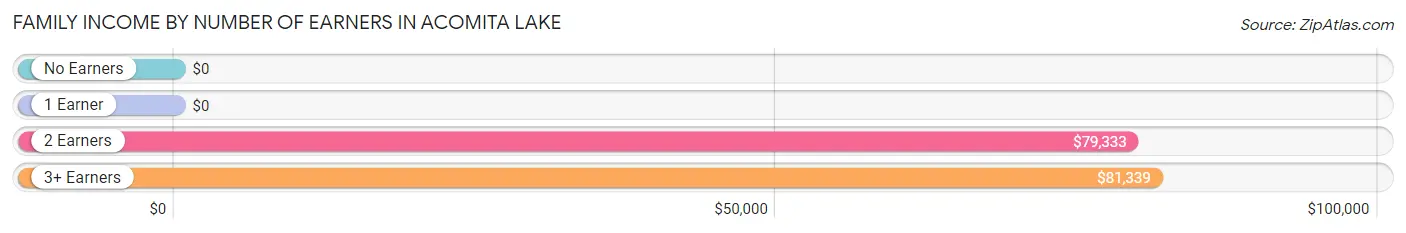
| Number of Earners | # Families | Median Income |
| No Earners | 25 (21.5%) | $0 |
| 1 Earner | 10 (8.6%) | $0 |
| 2 Earners | 22 (19.0%) | $79,333 |
| 3+ Earners | 59 (50.9%) | $81,339 |
| Total | 116 (100.0%) | $80,060 |
Household Income in Acomita Lake
Household Income Brackets in Acomita Lake
With 57 households falling in the category, the $75,000 to $99,999 income range is the most frequent in Acomita Lake, accounting for 41.6% of all households.
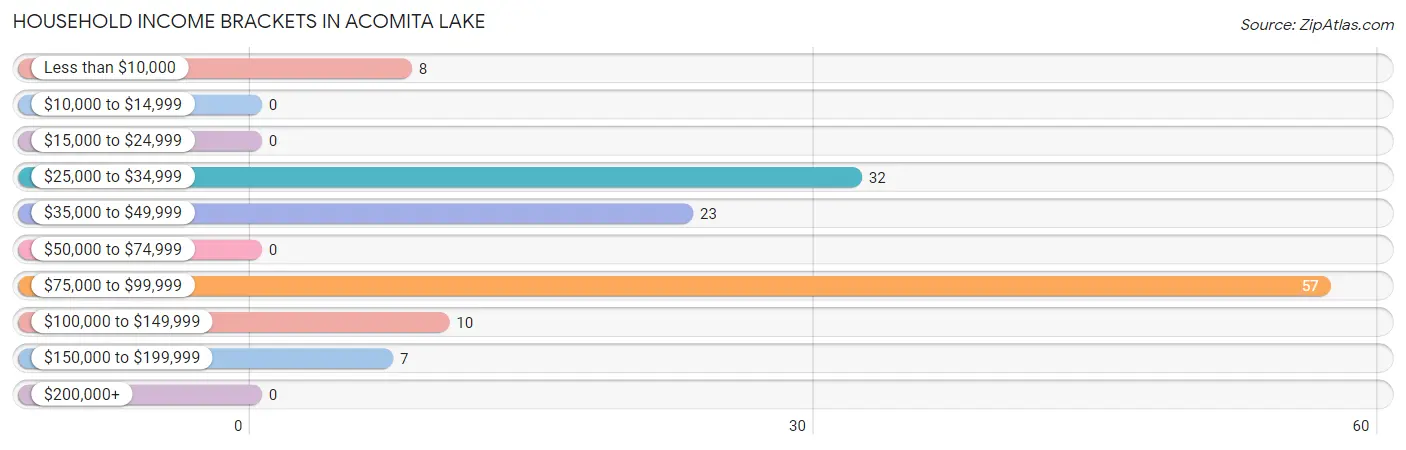
| Income Bracket | # Households | % Households |
| Less than $10,000 | 8 | 5.8% |
| $10,000 to $14,999 | 0 | 0.0% |
| $15,000 to $24,999 | 0 | 0.0% |
| $25,000 to $34,999 | 32 | 23.4% |
| $35,000 to $49,999 | 23 | 16.8% |
| $50,000 to $74,999 | 0 | 0.0% |
| $75,000 to $99,999 | 57 | 41.6% |
| $100,000 to $149,999 | 10 | 7.3% |
| $150,000 to $199,999 | 7 | 5.1% |
| $200,000+ | 0 | 0.0% |
Household Income by Householder Age in Acomita Lake
The median household income in Acomita Lake is $78,417, with the highest median household income of $80,179 found in the 45 to 64 years age bracket for the primary householder. A total of 98 households (71.5%) fall into this category.
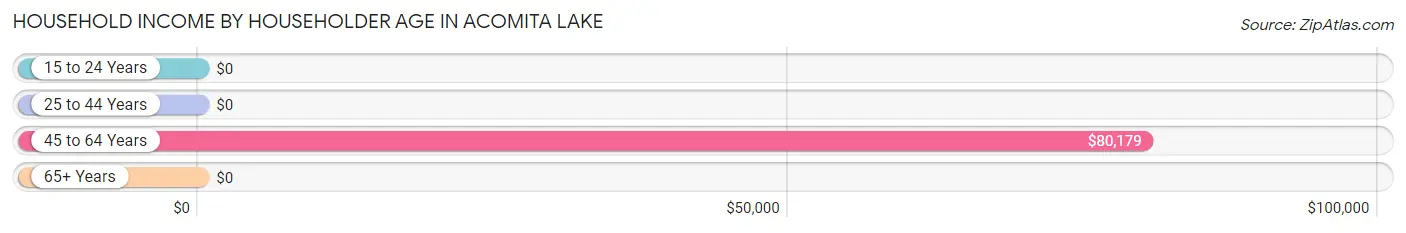
| Income Bracket | # Households | Median Income |
| 15 to 24 Years | 0 (0.0%) | $0 |
| 25 to 44 Years | 0 (0.0%) | $0 |
| 45 to 64 Years | 98 (71.5%) | $80,179 |
| 65+ Years | 39 (28.5%) | $0 |
| Total | 137 (100.0%) | $78,417 |
Poverty in Acomita Lake
Income Below Poverty by Sex and Age in Acomita Lake
With 7.7% poverty level for males and 25.8% for females among the residents of Acomita Lake, under 5 year old males and 18 to 24 year old females are the most vulnerable to poverty, with 10 males (100.0%) and 44 females (100.0%) in their respective age groups living below the poverty level.
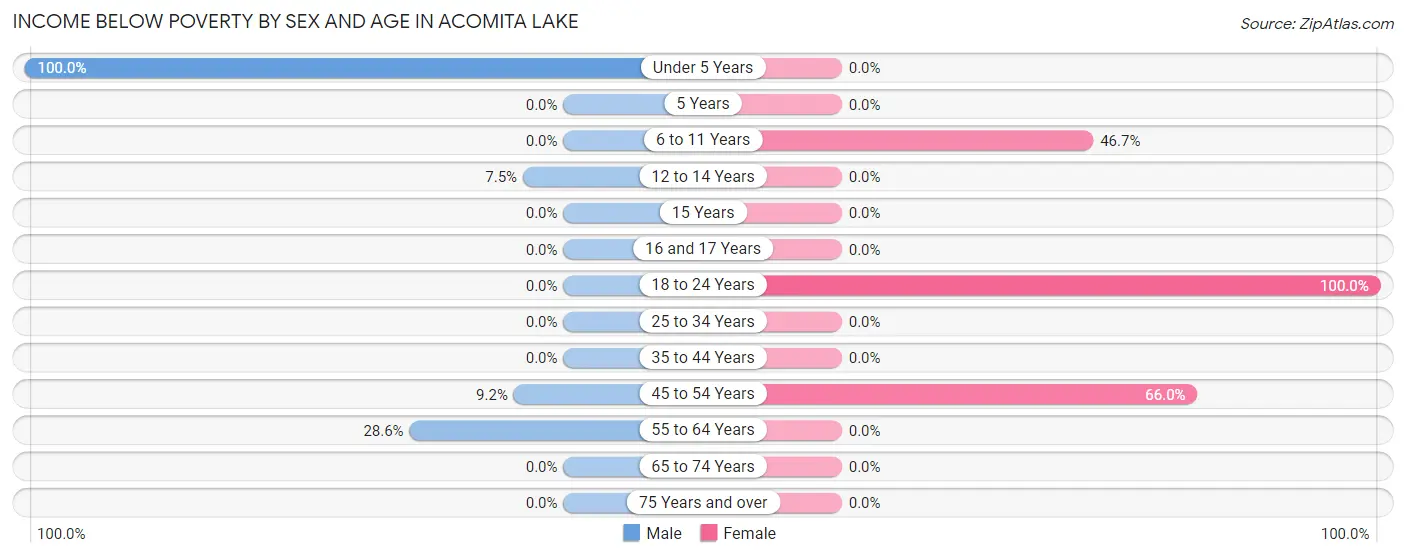
| Age Bracket | Male | Female |
| Under 5 Years | 10 (100.0%) | 0 (0.0%) |
| 5 Years | 0 (0.0%) | 0 (0.0%) |
| 6 to 11 Years | 0 (0.0%) | 7 (46.7%) |
| 12 to 14 Years | 6 (7.5%) | 0 (0.0%) |
| 15 Years | 0 (0.0%) | 0 (0.0%) |
| 16 and 17 Years | 0 (0.0%) | 0 (0.0%) |
| 18 to 24 Years | 0 (0.0%) | 44 (100.0%) |
| 25 to 34 Years | 0 (0.0%) | 0 (0.0%) |
| 35 to 44 Years | 0 (0.0%) | 0 (0.0%) |
| 45 to 54 Years | 7 (9.2%) | 33 (66.0%) |
| 55 to 64 Years | 8 (28.6%) | 0 (0.0%) |
| 65 to 74 Years | 0 (0.0%) | 0 (0.0%) |
| 75 Years and over | 0 (0.0%) | 0 (0.0%) |
| Total | 31 (7.7%) | 84 (25.8%) |
Income Above Poverty by Sex and Age in Acomita Lake
According to the poverty statistics in Acomita Lake, males aged 16 and 17 years and females aged under 5 years are the age groups that are most secure financially, with 100.0% of males and 100.0% of females in these age groups living above the poverty line.
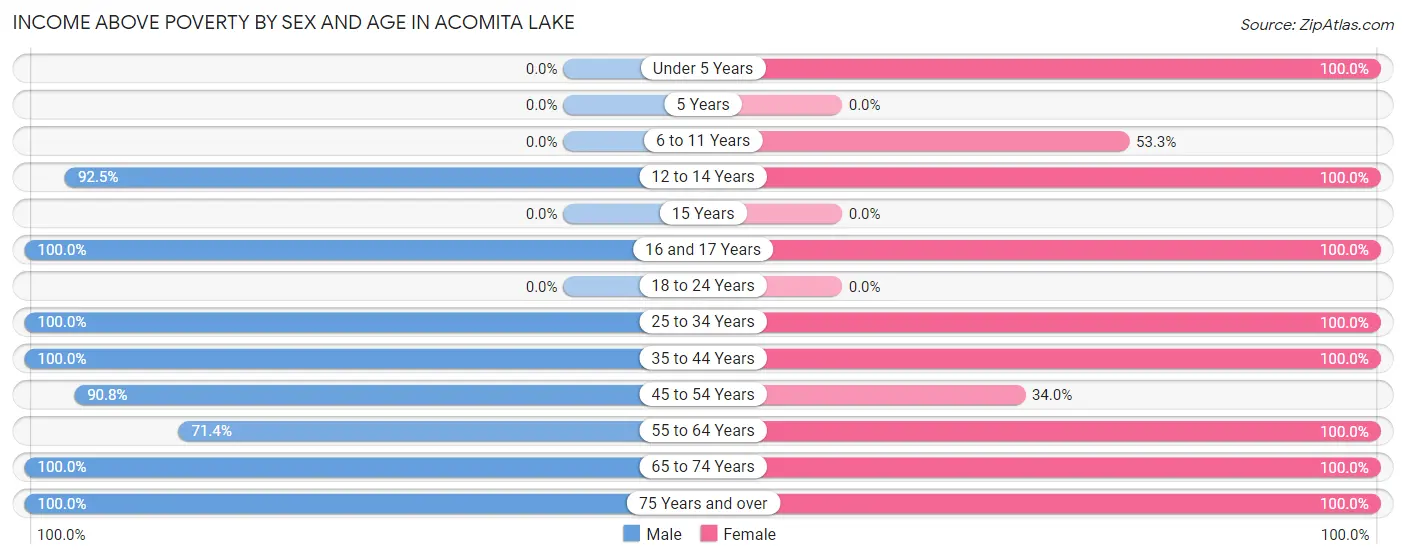
| Age Bracket | Male | Female |
| Under 5 Years | 0 (0.0%) | 50 (100.0%) |
| 5 Years | 0 (0.0%) | 0 (0.0%) |
| 6 to 11 Years | 0 (0.0%) | 8 (53.3%) |
| 12 to 14 Years | 74 (92.5%) | 7 (100.0%) |
| 15 Years | 0 (0.0%) | 0 (0.0%) |
| 16 and 17 Years | 11 (100.0%) | 12 (100.0%) |
| 18 to 24 Years | 0 (0.0%) | 0 (0.0%) |
| 25 to 34 Years | 80 (100.0%) | 13 (100.0%) |
| 35 to 44 Years | 78 (100.0%) | 63 (100.0%) |
| 45 to 54 Years | 69 (90.8%) | 17 (34.0%) |
| 55 to 64 Years | 20 (71.4%) | 52 (100.0%) |
| 65 to 74 Years | 7 (100.0%) | 7 (100.0%) |
| 75 Years and over | 32 (100.0%) | 13 (100.0%) |
| Total | 371 (92.3%) | 242 (74.2%) |
Income Below Poverty Among Married-Couple Families in Acomita Lake
The poverty statistics for married-couple families in Acomita Lake show that 7.7% or 7 of the total 91 families live below the poverty line. Families with 3 or 4 children have the highest poverty rate of 100.0%, comprising of 7 families. On the other hand, families with no children have the lowest poverty rate of 0.0%, which includes 0 families.
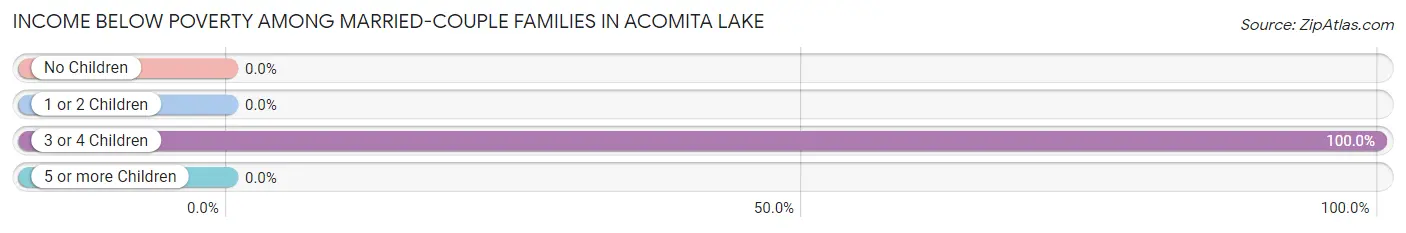
| Children | Above Poverty | Below Poverty |
| No Children | 35 (100.0%) | 0 (0.0%) |
| 1 or 2 Children | 49 (100.0%) | 0 (0.0%) |
| 3 or 4 Children | 0 (0.0%) | 7 (100.0%) |
| 5 or more Children | 0 (0.0%) | 0 (0.0%) |
| Total | 84 (92.3%) | 7 (7.7%) |
Income Below Poverty Among Single-Parent Households in Acomita Lake
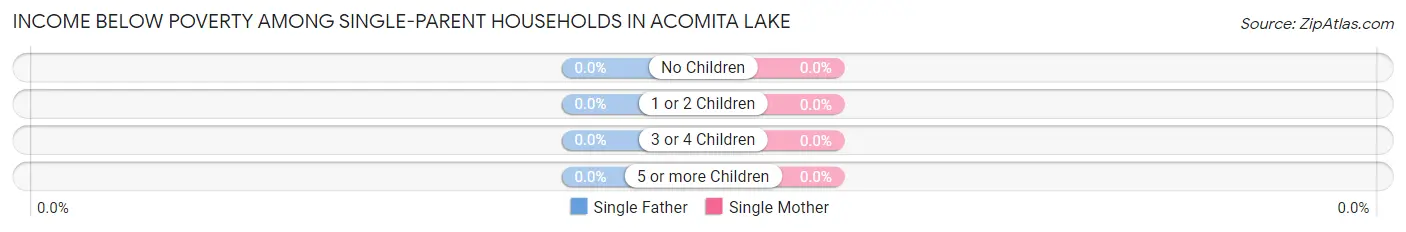
| Children | Single Father | Single Mother |
| No Children | 0 (0.0%) | 0 (0.0%) |
| 1 or 2 Children | 0 (0.0%) | 0 (0.0%) |
| 3 or 4 Children | 0 (0.0%) | 0 (0.0%) |
| 5 or more Children | 0 (0.0%) | 0 (0.0%) |
| Total | 0 (0.0%) | 0 (0.0%) |
Income Below Poverty Among Married-Couple vs Single-Parent Households in Acomita Lake
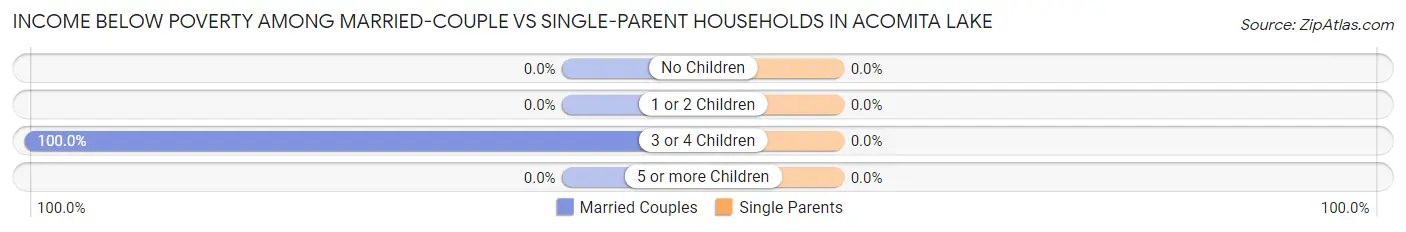
| Children | Married-Couple Families | Single-Parent Households |
| No Children | 0 (0.0%) | 0 (0.0%) |
| 1 or 2 Children | 0 (0.0%) | 0 (0.0%) |
| 3 or 4 Children | 7 (100.0%) | 0 (0.0%) |
| 5 or more Children | 0 (0.0%) | 0 (0.0%) |
| Total | 7 (7.7%) | 0 (0.0%) |
Employment Characteristics in Acomita Lake
Employment by Class of Employer in Acomita Lake
Among the 372 employed individuals in Acomita Lake, private company employees (195 | 52.4%), federal government employees (91 | 24.5%), and local government employees (35 | 9.4%) make up the most common classes of employment.
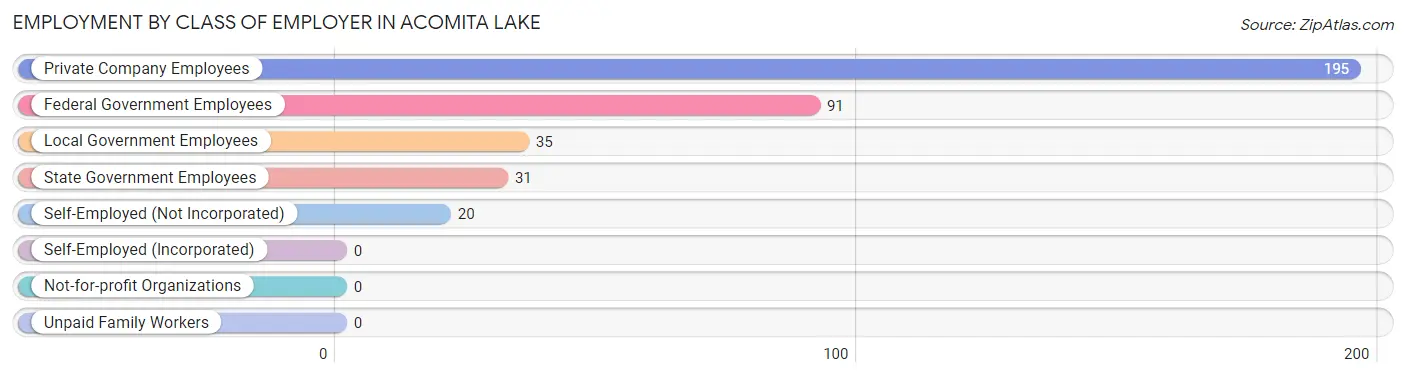
| Employer Class | # Employees | % Employees |
| Private Company Employees | 195 | 52.4% |
| Self-Employed (Incorporated) | 0 | 0.0% |
| Self-Employed (Not Incorporated) | 20 | 5.4% |
| Not-for-profit Organizations | 0 | 0.0% |
| Local Government Employees | 35 | 9.4% |
| State Government Employees | 31 | 8.3% |
| Federal Government Employees | 91 | 24.5% |
| Unpaid Family Workers | 0 | 0.0% |
| Total | 372 | 100.0% |
Employment Status by Age in Acomita Lake
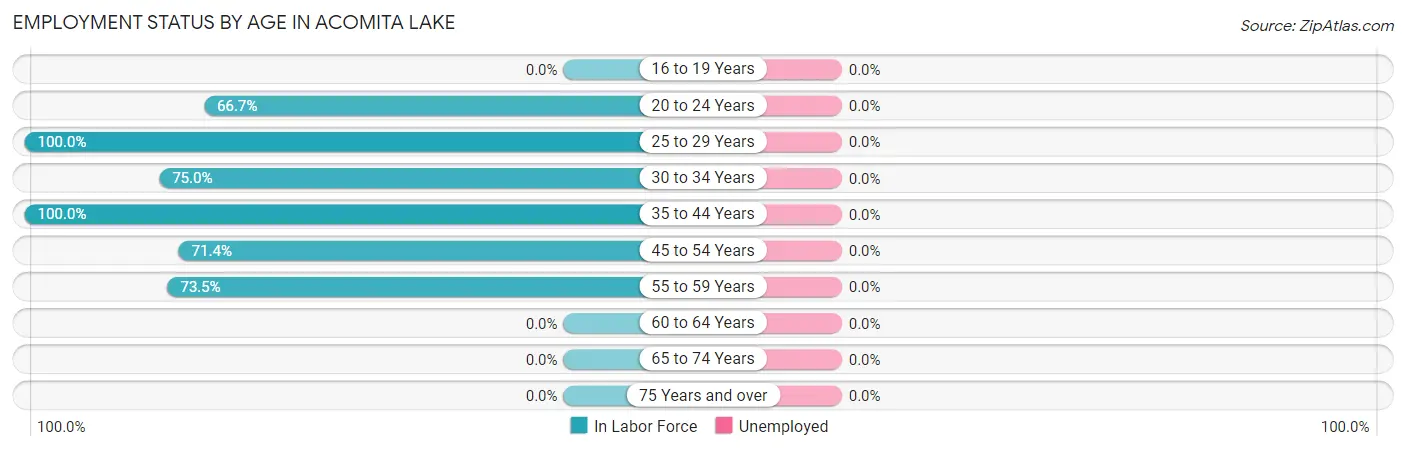
| Age Bracket | In Labor Force | Unemployed |
| 16 to 19 Years | 0 (0.0%) | 0 (0.0%) |
| 20 to 24 Years | 18 (66.7%) | 0 (0.0%) |
| 25 to 29 Years | 13 (100.0%) | 0 (0.0%) |
| 30 to 34 Years | 60 (75.0%) | 0 (0.0%) |
| 35 to 44 Years | 141 (100.0%) | 0 (0.0%) |
| 45 to 54 Years | 90 (71.4%) | 0 (0.0%) |
| 55 to 59 Years | 50 (73.5%) | 0 (0.0%) |
| 60 to 64 Years | 0 (0.0%) | 0 (0.0%) |
| 65 to 74 Years | 0 (0.0%) | 0 (0.0%) |
| 75 Years and over | 0 (0.0%) | 0 (0.0%) |
| Total | 372 (65.7%) | 0 (0.0%) |
Employment Status by Educational Attainment in Acomita Lake
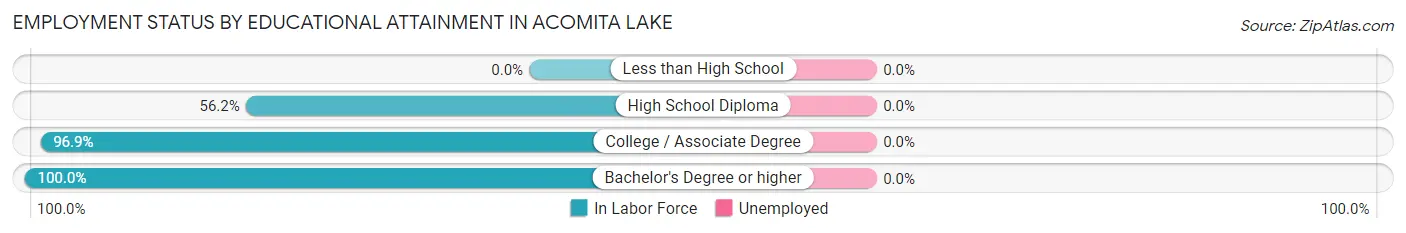
| Educational Attainment | In Labor Force | Unemployed |
| Less than High School | 0 (0.0%) | 0 (0.0%) |
| High School Diploma | 86 (56.2%) | 0 (0.0%) |
| College / Associate Degree | 219 (96.9%) | 0 (0.0%) |
| Bachelor's Degree or higher | 49 (100.0%) | 0 (0.0%) |
| Total | 354 (80.5%) | 0 (0.0%) |
Employment Occupations by Sex in Acomita Lake
Management, Business, Science and Arts Occupations
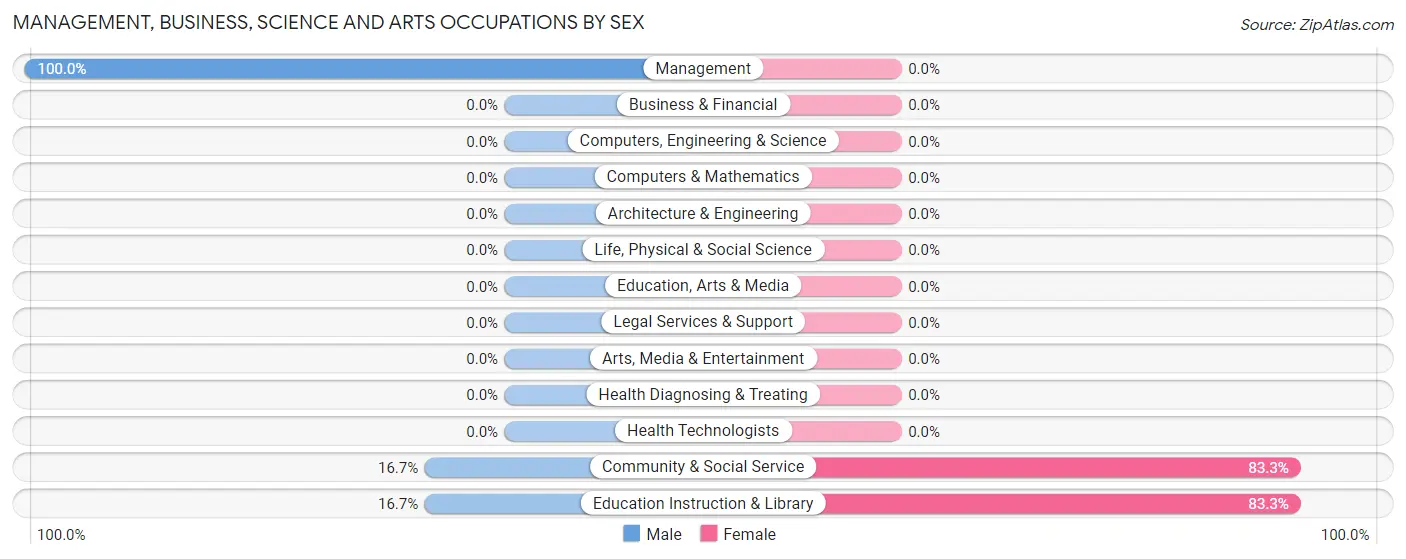
The most common Management, Business, Science and Arts occupations in Acomita Lake are Community & Social Service (72 | 19.4%), Education Instruction & Library (72 | 19.4%), and Management (10 | 2.7%).
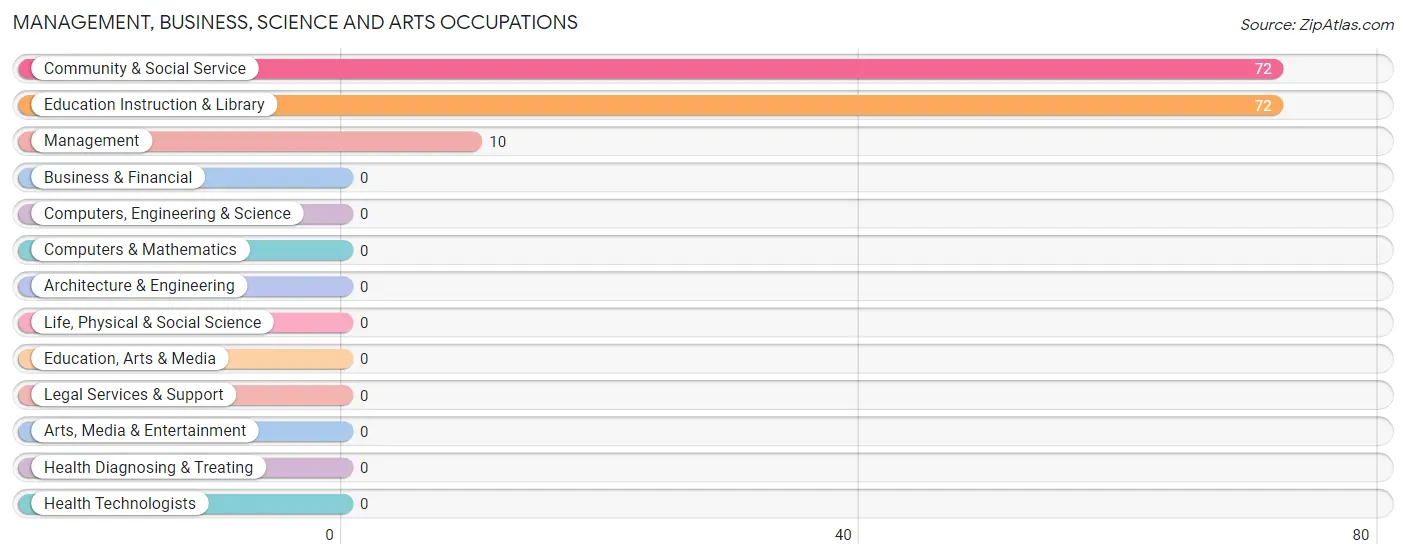
Management, Business, Science and Arts Occupations by Sex
Within the Management, Business, Science and Arts occupations in Acomita Lake, the most male-oriented occupations are Management (100.0%), Community & Social Service (16.7%), and Education Instruction & Library (16.7%), while the most female-oriented occupations are Community & Social Service (83.3%), and Education Instruction & Library (83.3%).
| Occupation | Male | Female |
| Management | 10 (100.0%) | 0 (0.0%) |
| Business & Financial | 0 (0.0%) | 0 (0.0%) |
| Computers, Engineering & Science | 0 (0.0%) | 0 (0.0%) |
| Computers & Mathematics | 0 (0.0%) | 0 (0.0%) |
| Architecture & Engineering | 0 (0.0%) | 0 (0.0%) |
| Life, Physical & Social Science | 0 (0.0%) | 0 (0.0%) |
| Community & Social Service | 12 (16.7%) | 60 (83.3%) |
| Education, Arts & Media | 0 (0.0%) | 0 (0.0%) |
| Legal Services & Support | 0 (0.0%) | 0 (0.0%) |
| Education Instruction & Library | 12 (16.7%) | 60 (83.3%) |
| Arts, Media & Entertainment | 0 (0.0%) | 0 (0.0%) |
| Health Diagnosing & Treating | 0 (0.0%) | 0 (0.0%) |
| Health Technologists | 0 (0.0%) | 0 (0.0%) |
| Total (Category) | 22 (26.8%) | 60 (73.2%) |
| Total (Overall) | 203 (54.6%) | 169 (45.4%) |
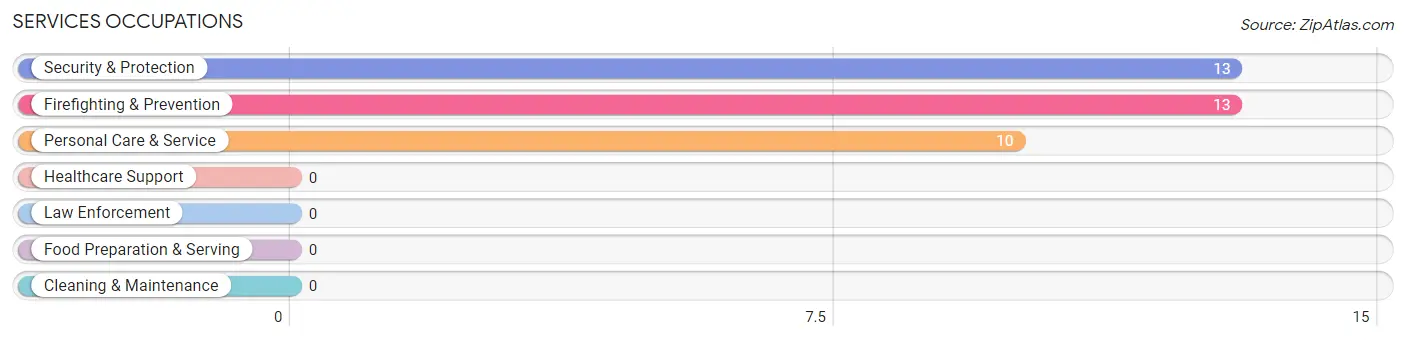
Services Occupations
The most common Services occupations in Acomita Lake are Security & Protection (13 | 3.5%), Firefighting & Prevention (13 | 3.5%), and Personal Care & Service (10 | 2.7%).
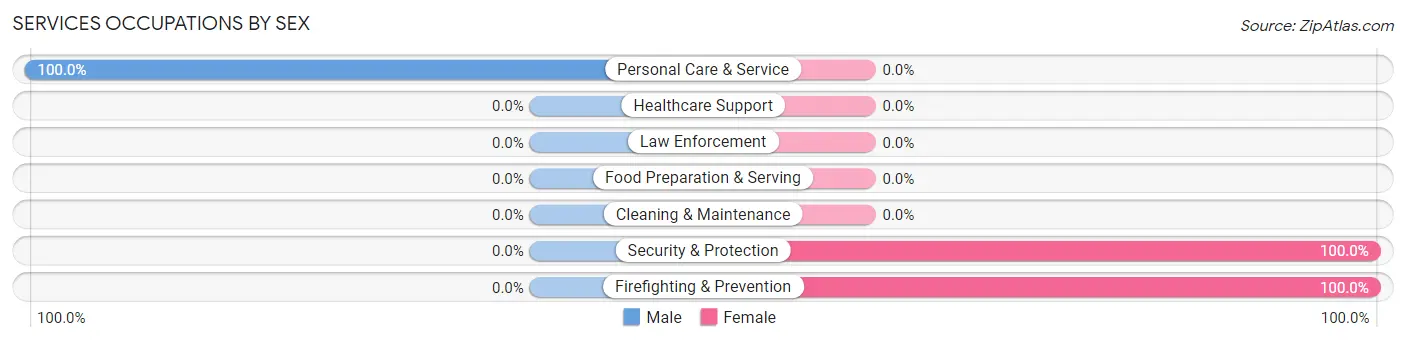
Services Occupations by Sex
| Occupation | Male | Female |
| Healthcare Support | 0 (0.0%) | 0 (0.0%) |
| Security & Protection | 0 (0.0%) | 13 (100.0%) |
| Firefighting & Prevention | 0 (0.0%) | 13 (100.0%) |
| Law Enforcement | 0 (0.0%) | 0 (0.0%) |
| Food Preparation & Serving | 0 (0.0%) | 0 (0.0%) |
| Cleaning & Maintenance | 0 (0.0%) | 0 (0.0%) |
| Personal Care & Service | 10 (100.0%) | 0 (0.0%) |
| Total (Category) | 10 (43.5%) | 13 (56.5%) |
| Total (Overall) | 203 (54.6%) | 169 (45.4%) |
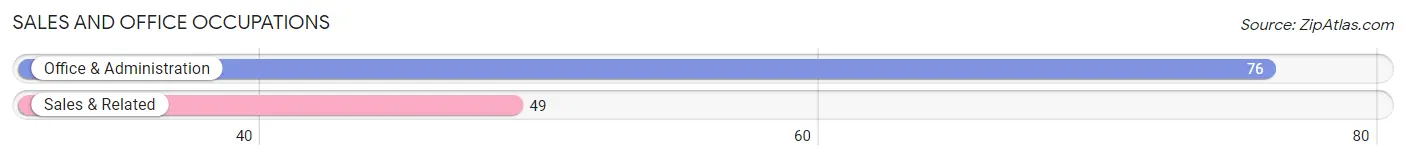
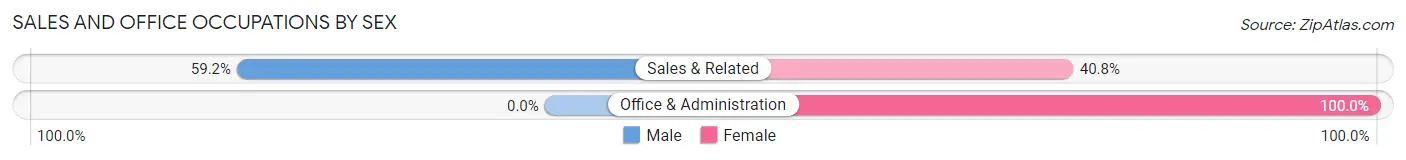
Sales and Office Occupations
The most common Sales and Office occupations in Acomita Lake are Office & Administration (76 | 20.4%), and Sales & Related (49 | 13.2%).
Sales and Office Occupations by Sex
| Occupation | Male | Female |
| Sales & Related | 29 (59.2%) | 20 (40.8%) |
| Office & Administration | 0 (0.0%) | 76 (100.0%) |
| Total (Category) | 29 (23.2%) | 96 (76.8%) |
| Total (Overall) | 203 (54.6%) | 169 (45.4%) |
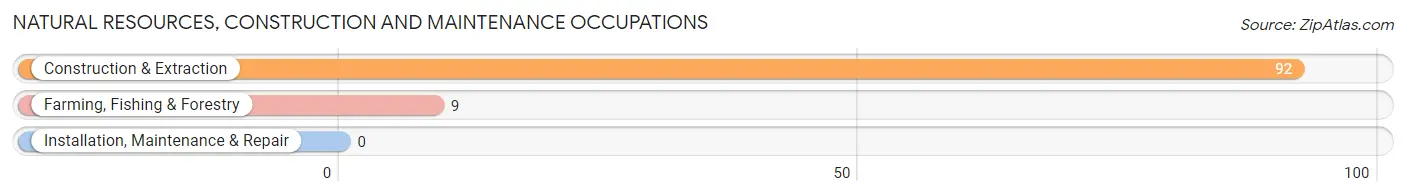
Natural Resources, Construction and Maintenance Occupations
The most common Natural Resources, Construction and Maintenance occupations in Acomita Lake are Construction & Extraction (92 | 24.7%), and Farming, Fishing & Forestry (9 | 2.4%).
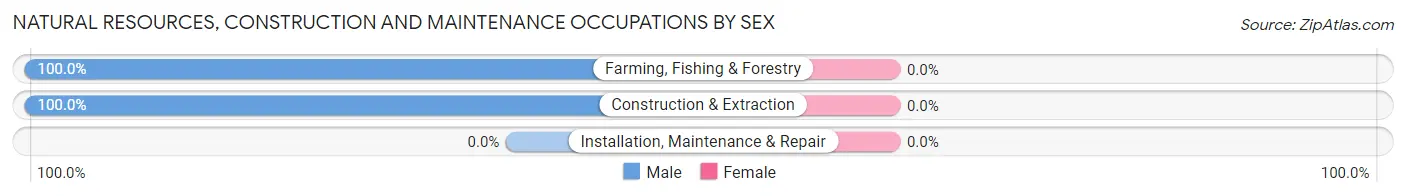
Natural Resources, Construction and Maintenance Occupations by Sex
| Occupation | Male | Female |
| Farming, Fishing & Forestry | 9 (100.0%) | 0 (0.0%) |
| Construction & Extraction | 92 (100.0%) | 0 (0.0%) |
| Installation, Maintenance & Repair | 0 (0.0%) | 0 (0.0%) |
| Total (Category) | 101 (100.0%) | 0 (0.0%) |
| Total (Overall) | 203 (54.6%) | 169 (45.4%) |
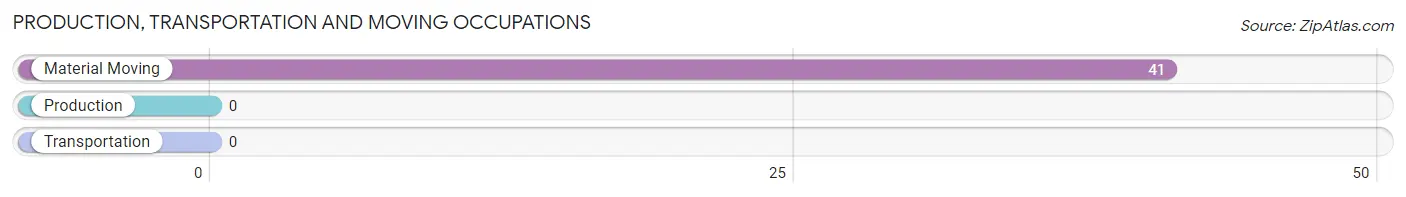
Production, Transportation and Moving Occupations
The most common Production, Transportation and Moving occupations in Acomita Lake are , and Material Moving (41 | 11.0%).
Production, Transportation and Moving Occupations by Sex
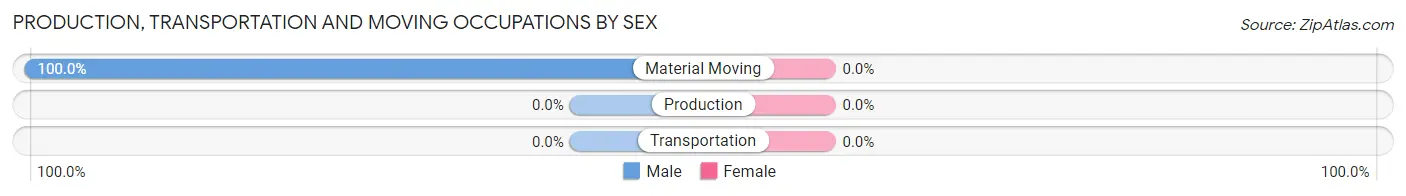
| Occupation | Male | Female |
| Production | 0 (0.0%) | 0 (0.0%) |
| Transportation | 0 (0.0%) | 0 (0.0%) |
| Material Moving | 41 (100.0%) | 0 (0.0%) |
| Total (Category) | 41 (100.0%) | 0 (0.0%) |
| Total (Overall) | 203 (54.6%) | 169 (45.4%) |
Employment Industries by Sex in Acomita Lake
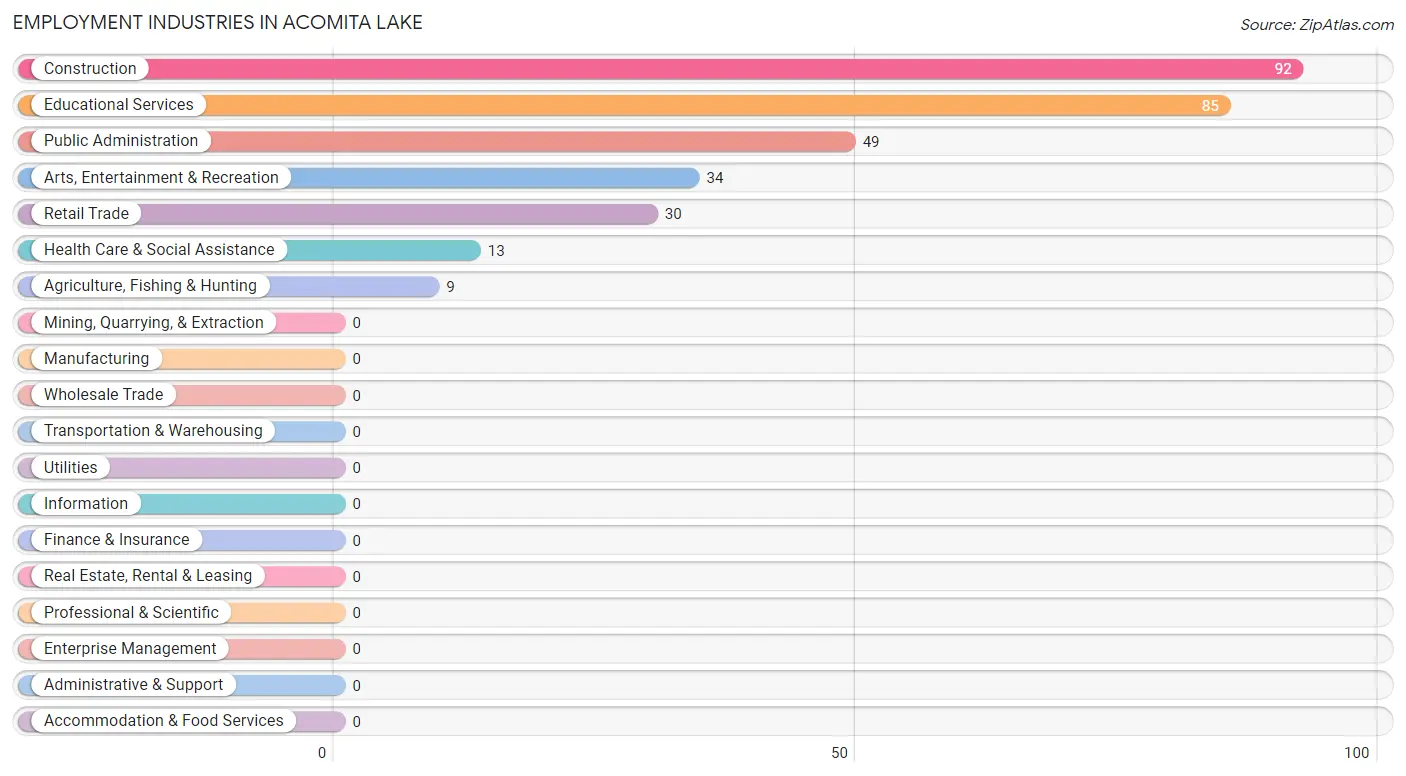
Employment Industries in Acomita Lake
The major employment industries in Acomita Lake include Construction (92 | 24.7%), Educational Services (85 | 22.9%), Public Administration (49 | 13.2%), Arts, Entertainment & Recreation (34 | 9.1%), and Retail Trade (30 | 8.1%).
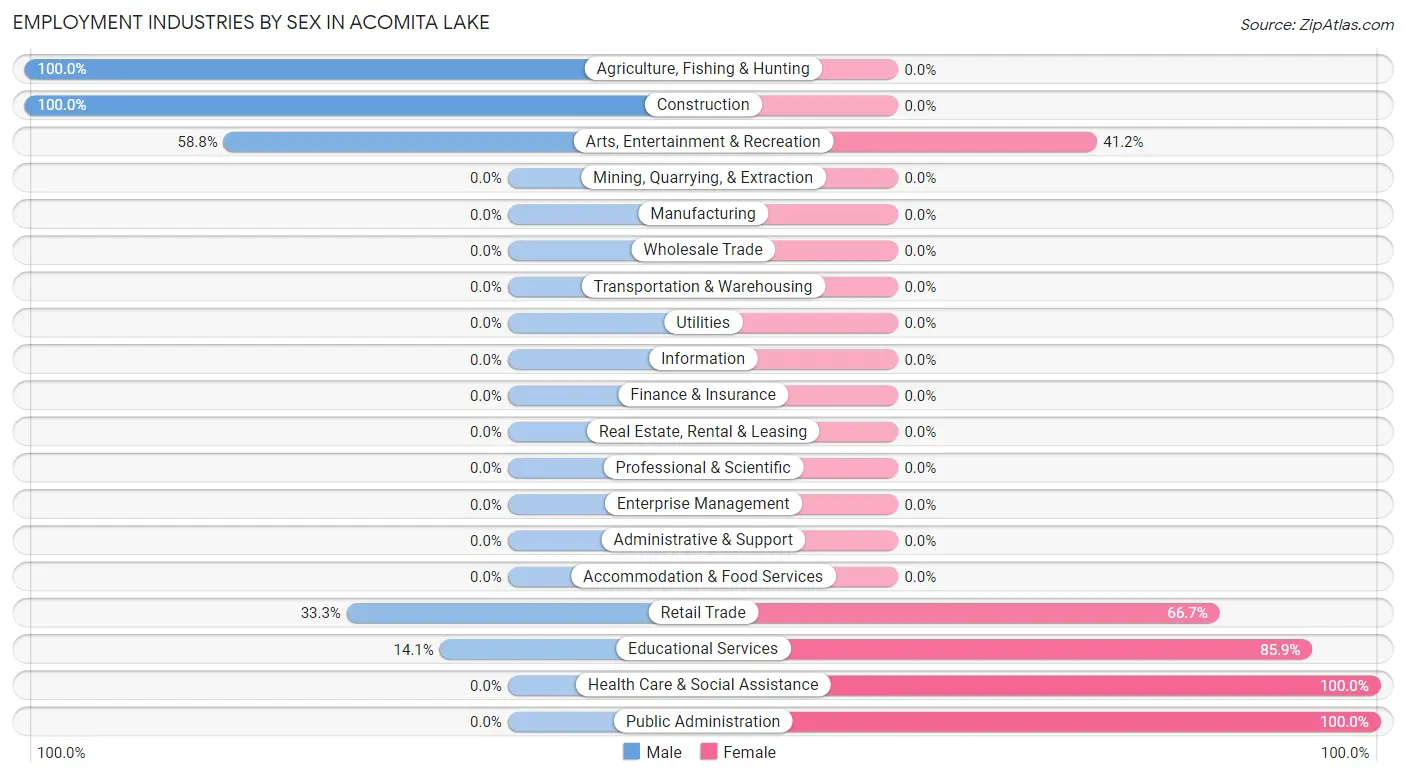
Employment Industries by Sex in Acomita Lake
The Acomita Lake industries that see more men than women are Agriculture, Fishing & Hunting (100.0%), Construction (100.0%), and Arts, Entertainment & Recreation (58.8%), whereas the industries that tend to have a higher number of women are Health Care & Social Assistance (100.0%), Public Administration (100.0%), and Educational Services (85.9%).
| Industry | Male | Female |
| Agriculture, Fishing & Hunting | 9 (100.0%) | 0 (0.0%) |
| Mining, Quarrying, & Extraction | 0 (0.0%) | 0 (0.0%) |
| Construction | 92 (100.0%) | 0 (0.0%) |
| Manufacturing | 0 (0.0%) | 0 (0.0%) |
| Wholesale Trade | 0 (0.0%) | 0 (0.0%) |
| Retail Trade | 10 (33.3%) | 20 (66.7%) |
| Transportation & Warehousing | 0 (0.0%) | 0 (0.0%) |
| Utilities | 0 (0.0%) | 0 (0.0%) |
| Information | 0 (0.0%) | 0 (0.0%) |
| Finance & Insurance | 0 (0.0%) | 0 (0.0%) |
| Real Estate, Rental & Leasing | 0 (0.0%) | 0 (0.0%) |
| Professional & Scientific | 0 (0.0%) | 0 (0.0%) |
| Enterprise Management | 0 (0.0%) | 0 (0.0%) |
| Administrative & Support | 0 (0.0%) | 0 (0.0%) |
| Educational Services | 12 (14.1%) | 73 (85.9%) |
| Health Care & Social Assistance | 0 (0.0%) | 13 (100.0%) |
| Arts, Entertainment & Recreation | 20 (58.8%) | 14 (41.2%) |
| Accommodation & Food Services | 0 (0.0%) | 0 (0.0%) |
| Public Administration | 0 (0.0%) | 49 (100.0%) |
| Total | 203 (54.6%) | 169 (45.4%) |
Education in Acomita Lake
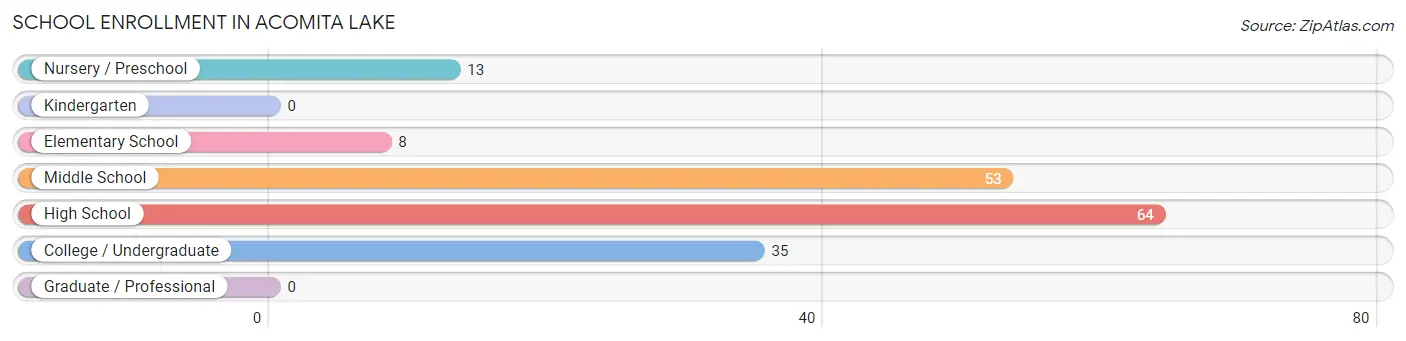
School Enrollment in Acomita Lake
The most common levels of schooling among the 173 students in Acomita Lake are high school (64 | 37.0%), middle school (53 | 30.6%), and college / undergraduate (35 | 20.2%).
| School Level | # Students | % Students |
| Nursery / Preschool | 13 | 7.5% |
| Kindergarten | 0 | 0.0% |
| Elementary School | 8 | 4.6% |
| Middle School | 53 | 30.6% |
| High School | 64 | 37.0% |
| College / Undergraduate | 35 | 20.2% |
| Graduate / Professional | 0 | 0.0% |
| Total | 173 | 100.0% |
School Enrollment by Age by Funding Source in Acomita Lake
Out of a total of 173 students who are enrolled in schools in Acomita Lake, 13 (7.5%) attend a private institution, while the remaining 160 (92.5%) are enrolled in public schools. The age group of 10 to 14 year olds has the highest likelihood of being enrolled in private schools, with 13 (13.8% in the age bracket) enrolled. Conversely, the age group of 3 to 4 year olds has the lowest likelihood of being enrolled in a private school, with 13 (100.0% in the age bracket) attending a public institution.
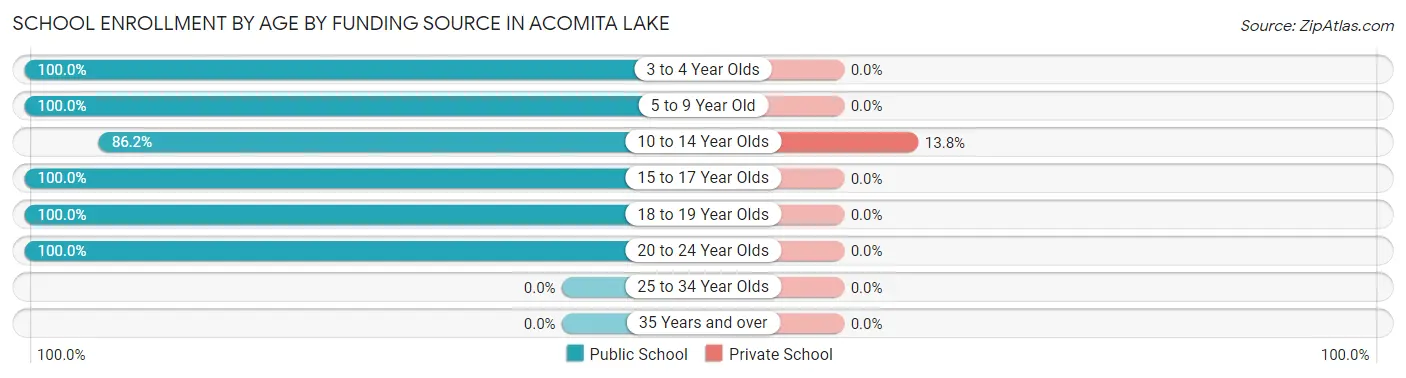
| Age Bracket | Public School | Private School |
| 3 to 4 Year Olds | 13 (100.0%) | 0 (0.0%) |
| 5 to 9 Year Old | 8 (100.0%) | 0 (0.0%) |
| 10 to 14 Year Olds | 81 (86.2%) | 13 (13.8%) |
| 15 to 17 Year Olds | 23 (100.0%) | 0 (0.0%) |
| 18 to 19 Year Olds | 17 (100.0%) | 0 (0.0%) |
| 20 to 24 Year Olds | 18 (100.0%) | 0 (0.0%) |
| 25 to 34 Year Olds | 0 (0.0%) | 0 (0.0%) |
| 35 Years and over | 0 (0.0%) | 0 (0.0%) |
| Total | 160 (92.5%) | 13 (7.5%) |
Educational Attainment by Field of Study in Acomita Lake
Education (19 | 33.9%), social sciences (14 | 25.0%), arts & humanities (13 | 23.2%), and computers & mathematics (10 | 17.9%) are the most common fields of study among 56 individuals in Acomita Lake who have obtained a bachelor's degree or higher.
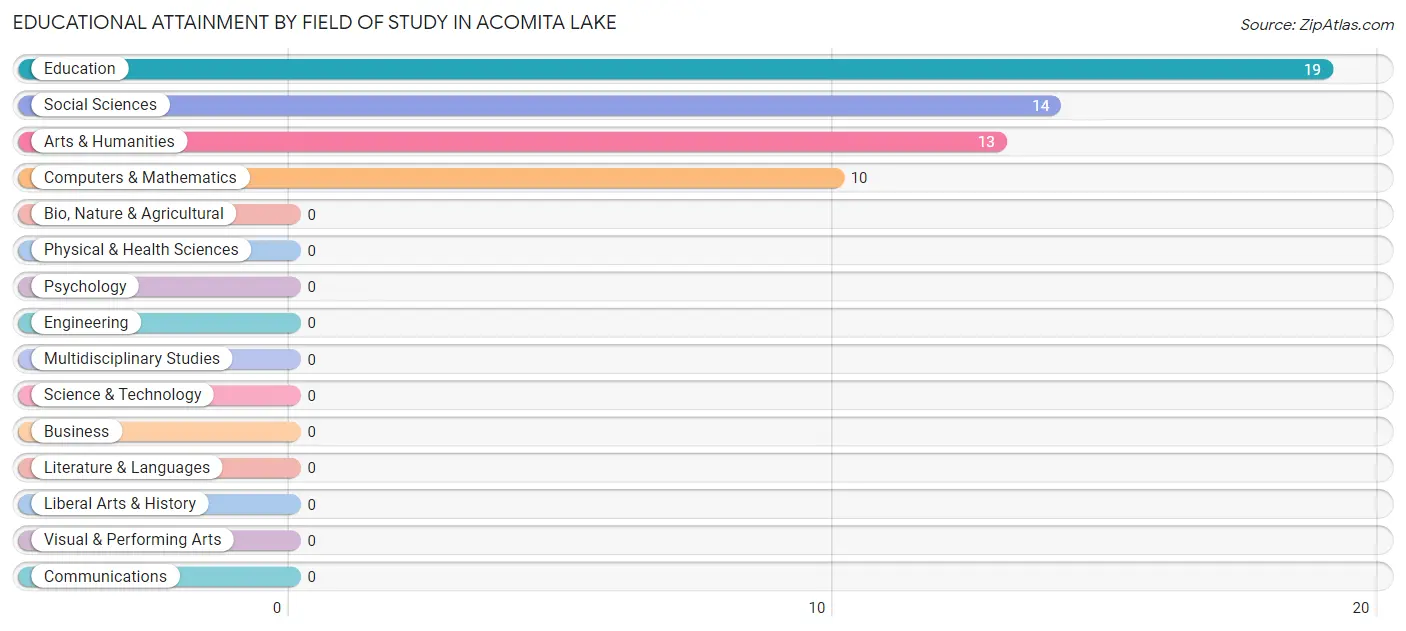
| Field of Study | # Graduates | % Graduates |
| Computers & Mathematics | 10 | 17.9% |
| Bio, Nature & Agricultural | 0 | 0.0% |
| Physical & Health Sciences | 0 | 0.0% |
| Psychology | 0 | 0.0% |
| Social Sciences | 14 | 25.0% |
| Engineering | 0 | 0.0% |
| Multidisciplinary Studies | 0 | 0.0% |
| Science & Technology | 0 | 0.0% |
| Business | 0 | 0.0% |
| Education | 19 | 33.9% |
| Literature & Languages | 0 | 0.0% |
| Liberal Arts & History | 0 | 0.0% |
| Visual & Performing Arts | 0 | 0.0% |
| Communications | 0 | 0.0% |
| Arts & Humanities | 13 | 23.2% |
| Total | 56 | 100.0% |
Transportation & Commute in Acomita Lake
Vehicle Availability by Sex in Acomita Lake
The most prevalent vehicle ownership categories in Acomita Lake are males with 3 vehicles (111, accounting for 54.7%) and females with 3 vehicles (142, making up 65.7%).
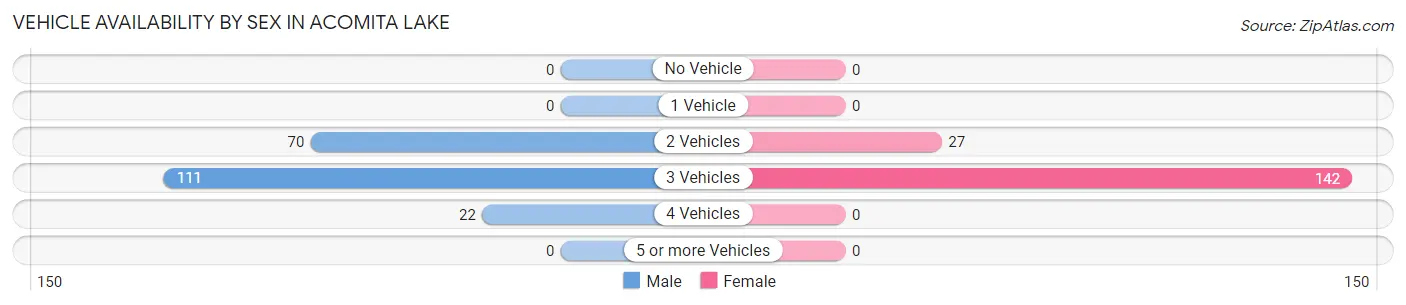
| Vehicles Available | Male | Female |
| No Vehicle | 0 (0.0%) | 0 (0.0%) |
| 1 Vehicle | 0 (0.0%) | 0 (0.0%) |
| 2 Vehicles | 70 (34.5%) | 27 (16.0%) |
| 3 Vehicles | 111 (54.7%) | 142 (84.0%) |
| 4 Vehicles | 22 (10.8%) | 0 (0.0%) |
| 5 or more Vehicles | 0 (0.0%) | 0 (0.0%) |
| Total | 203 (100.0%) | 169 (100.0%) |
Commute Time in Acomita Lake
The most frequently occuring commute durations in Acomita Lake are 30 to 34 minutes (92 commuters, 27.5%), 5 to 9 minutes (63 commuters, 18.9%), and 60 to 89 minutes (63 commuters, 18.9%).
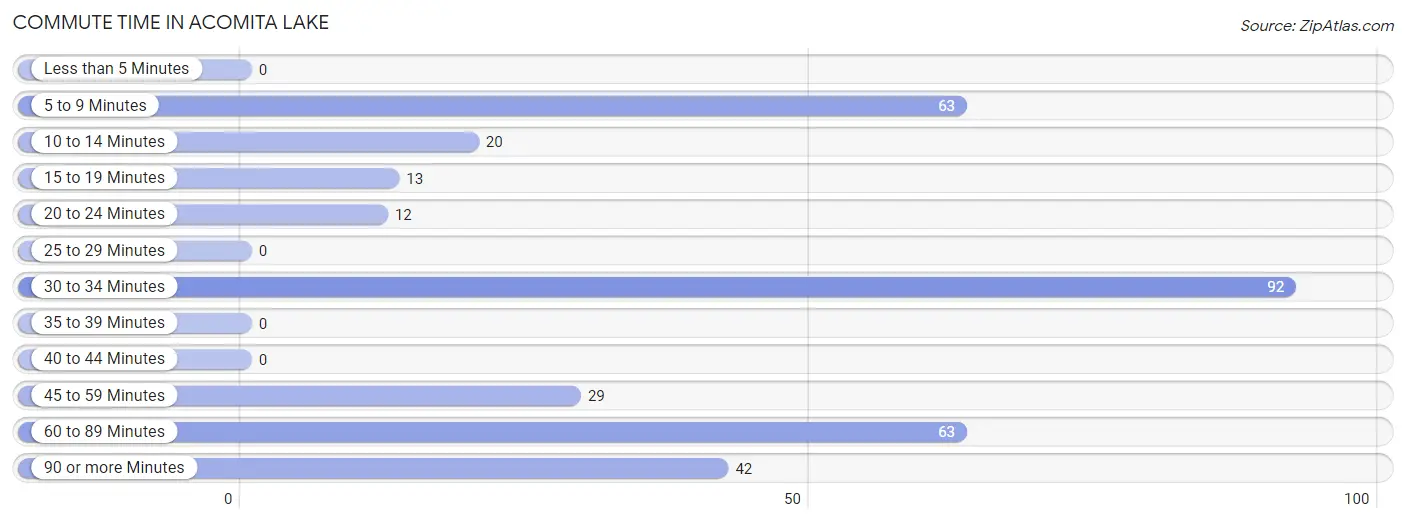
| Commute Time | # Commuters | % Commuters |
| Less than 5 Minutes | 0 | 0.0% |
| 5 to 9 Minutes | 63 | 18.9% |
| 10 to 14 Minutes | 20 | 6.0% |
| 15 to 19 Minutes | 13 | 3.9% |
| 20 to 24 Minutes | 12 | 3.6% |
| 25 to 29 Minutes | 0 | 0.0% |
| 30 to 34 Minutes | 92 | 27.5% |
| 35 to 39 Minutes | 0 | 0.0% |
| 40 to 44 Minutes | 0 | 0.0% |
| 45 to 59 Minutes | 29 | 8.7% |
| 60 to 89 Minutes | 63 | 18.9% |
| 90 or more Minutes | 42 | 12.6% |
Commute Time by Sex in Acomita Lake
The most common commute times in Acomita Lake are 30 to 34 minutes (92 commuters, 45.3%) for males and 5 to 9 minutes (63 commuters, 48.1%) for females.
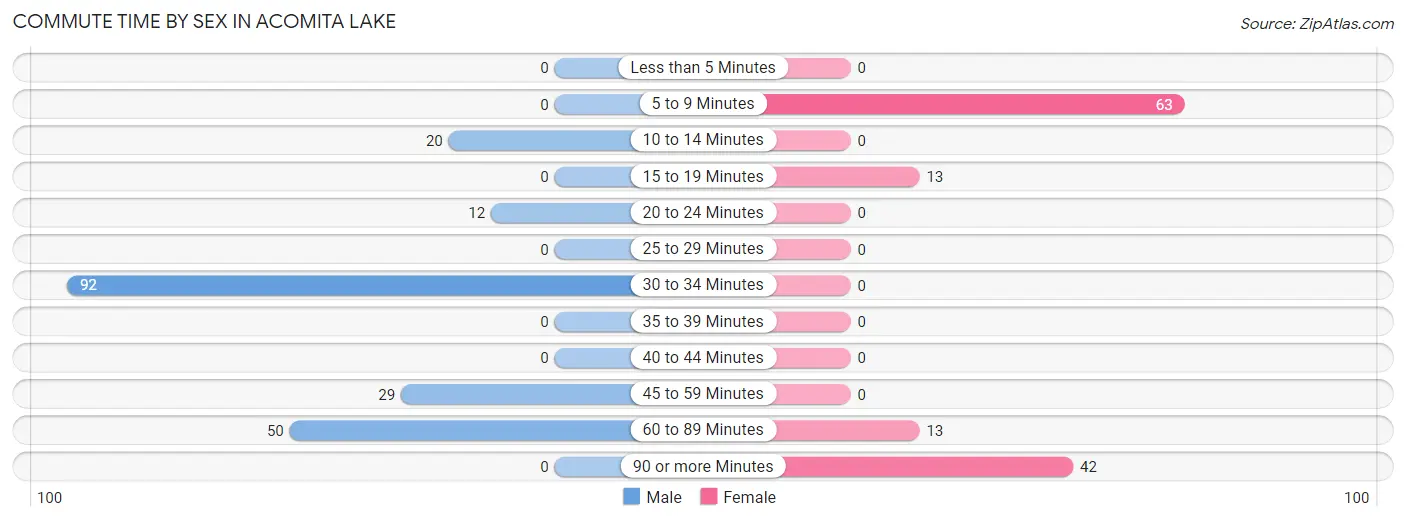
| Commute Time | Male | Female |
| Less than 5 Minutes | 0 (0.0%) | 0 (0.0%) |
| 5 to 9 Minutes | 0 (0.0%) | 63 (48.1%) |
| 10 to 14 Minutes | 20 (9.9%) | 0 (0.0%) |
| 15 to 19 Minutes | 0 (0.0%) | 13 (9.9%) |
| 20 to 24 Minutes | 12 (5.9%) | 0 (0.0%) |
| 25 to 29 Minutes | 0 (0.0%) | 0 (0.0%) |
| 30 to 34 Minutes | 92 (45.3%) | 0 (0.0%) |
| 35 to 39 Minutes | 0 (0.0%) | 0 (0.0%) |
| 40 to 44 Minutes | 0 (0.0%) | 0 (0.0%) |
| 45 to 59 Minutes | 29 (14.3%) | 0 (0.0%) |
| 60 to 89 Minutes | 50 (24.6%) | 13 (9.9%) |
| 90 or more Minutes | 0 (0.0%) | 42 (32.1%) |
Time of Departure to Work by Sex in Acomita Lake
The most frequent times of departure to work in Acomita Lake are 9:00 AM to 9:59 AM (68, 33.5%) for males and 4:00 PM to 11:59 PM (63, 48.1%) for females.
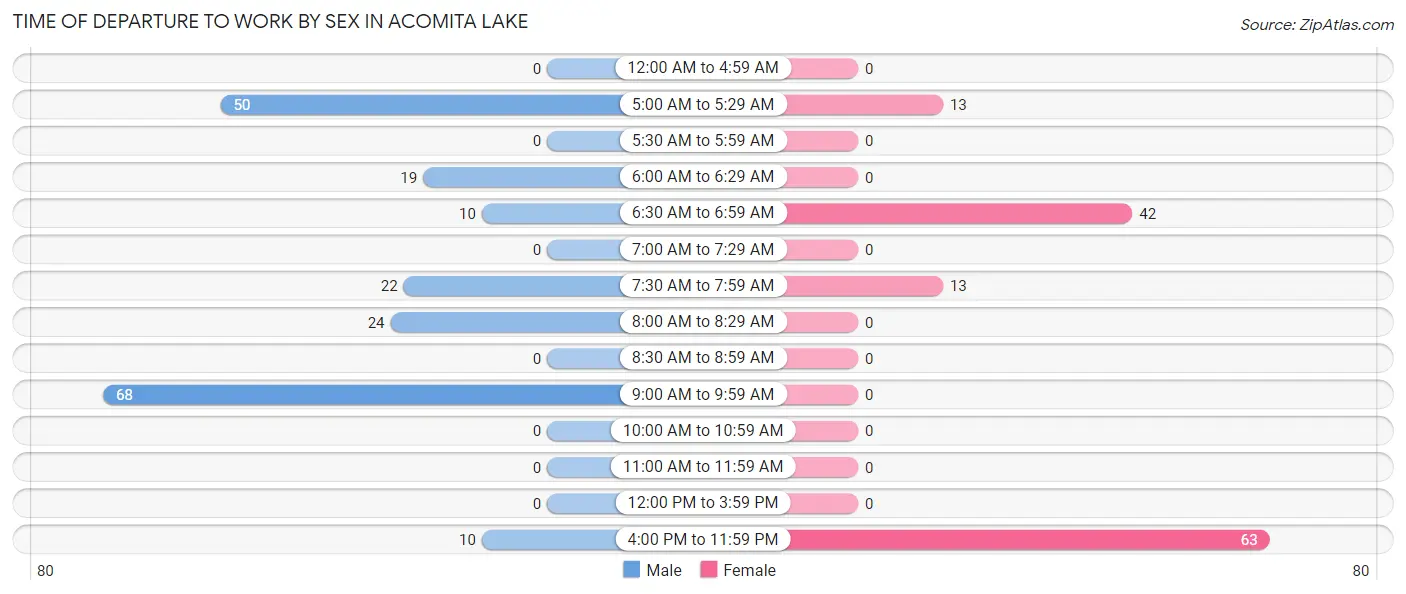
| Time of Departure | Male | Female |
| 12:00 AM to 4:59 AM | 0 (0.0%) | 0 (0.0%) |
| 5:00 AM to 5:29 AM | 50 (24.6%) | 13 (9.9%) |
| 5:30 AM to 5:59 AM | 0 (0.0%) | 0 (0.0%) |
| 6:00 AM to 6:29 AM | 19 (9.4%) | 0 (0.0%) |
| 6:30 AM to 6:59 AM | 10 (4.9%) | 42 (32.1%) |
| 7:00 AM to 7:29 AM | 0 (0.0%) | 0 (0.0%) |
| 7:30 AM to 7:59 AM | 22 (10.8%) | 13 (9.9%) |
| 8:00 AM to 8:29 AM | 24 (11.8%) | 0 (0.0%) |
| 8:30 AM to 8:59 AM | 0 (0.0%) | 0 (0.0%) |
| 9:00 AM to 9:59 AM | 68 (33.5%) | 0 (0.0%) |
| 10:00 AM to 10:59 AM | 0 (0.0%) | 0 (0.0%) |
| 11:00 AM to 11:59 AM | 0 (0.0%) | 0 (0.0%) |
| 12:00 PM to 3:59 PM | 0 (0.0%) | 0 (0.0%) |
| 4:00 PM to 11:59 PM | 10 (4.9%) | 63 (48.1%) |
| Total | 203 (100.0%) | 131 (100.0%) |
Housing Occupancy in Acomita Lake
Occupancy by Ownership in Acomita Lake
Of the total 137 dwellings in Acomita Lake, owner-occupied units account for 137 (100.0%), while renter-occupied units make up 0 (0.0%).
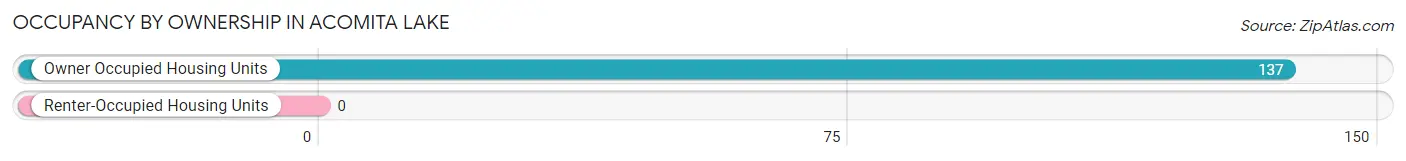
| Occupancy | # Housing Units | % Housing Units |
| Owner Occupied Housing Units | 137 | 100.0% |
| Renter-Occupied Housing Units | 0 | 0.0% |
| Total Occupied Housing Units | 137 | 100.0% |
Occupancy by Household Size in Acomita Lake
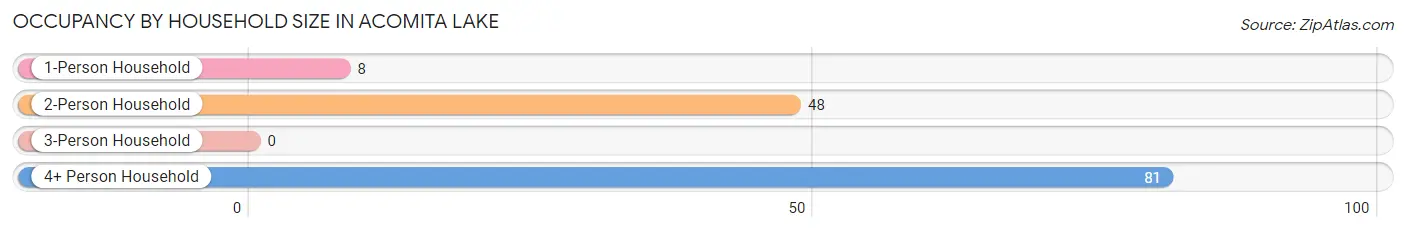
| Household Size | # Housing Units | % Housing Units |
| 1-Person Household | 8 | 5.8% |
| 2-Person Household | 48 | 35.0% |
| 3-Person Household | 0 | 0.0% |
| 4+ Person Household | 81 | 59.1% |
| Total Housing Units | 137 | 100.0% |
Occupancy by Ownership by Household Size in Acomita Lake
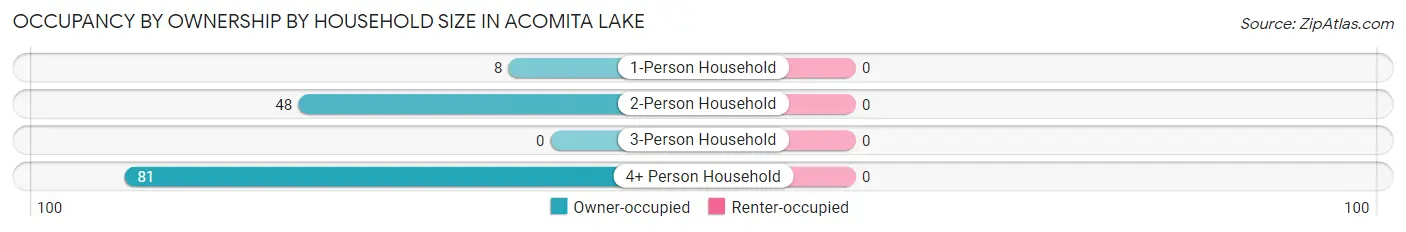
| Household Size | Owner-occupied | Renter-occupied |
| 1-Person Household | 8 (100.0%) | 0 (0.0%) |
| 2-Person Household | 48 (100.0%) | 0 (0.0%) |
| 3-Person Household | 0 (0.0%) | 0 (0.0%) |
| 4+ Person Household | 81 (100.0%) | 0 (0.0%) |
| Total Housing Units | 137 (100.0%) | 0 (0.0%) |
Occupancy by Educational Attainment in Acomita Lake
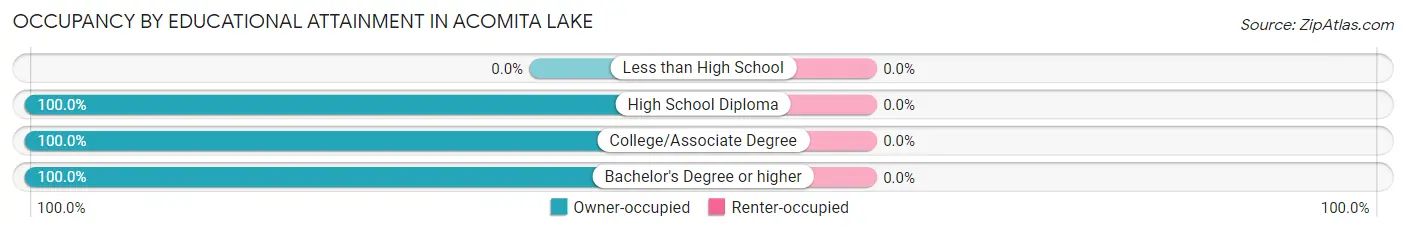
| Household Size | Owner-occupied | Renter-occupied |
| Less than High School | 0 (0.0%) | 0 (0.0%) |
| High School Diploma | 25 (100.0%) | 0 (0.0%) |
| College/Associate Degree | 95 (100.0%) | 0 (0.0%) |
| Bachelor's Degree or higher | 17 (100.0%) | 0 (0.0%) |
Occupancy by Age of Householder in Acomita Lake
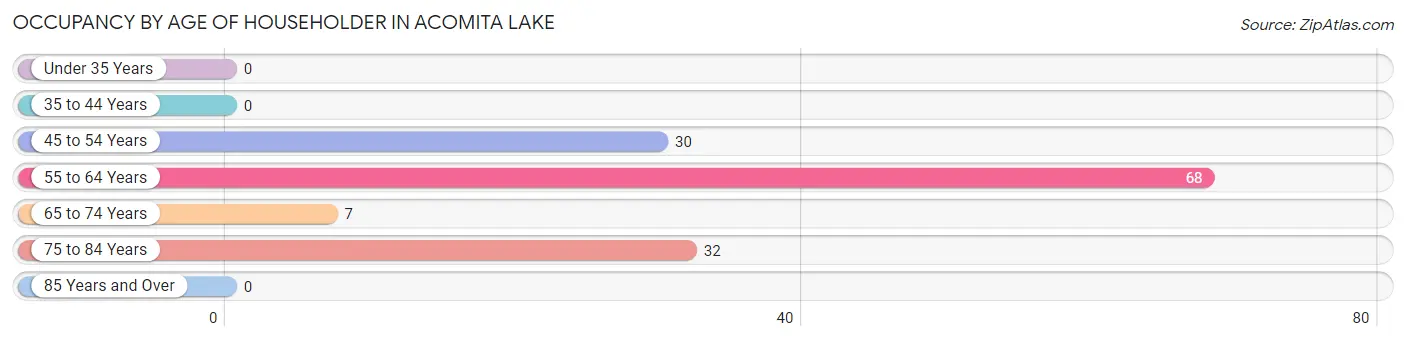
| Age Bracket | # Households | % Households |
| Under 35 Years | 0 | 0.0% |
| 35 to 44 Years | 0 | 0.0% |
| 45 to 54 Years | 30 | 21.9% |
| 55 to 64 Years | 68 | 49.6% |
| 65 to 74 Years | 7 | 5.1% |
| 75 to 84 Years | 32 | 23.4% |
| 85 Years and Over | 0 | 0.0% |
| Total | 137 | 100.0% |
Housing Finances in Acomita Lake
Median Income by Occupancy in Acomita Lake
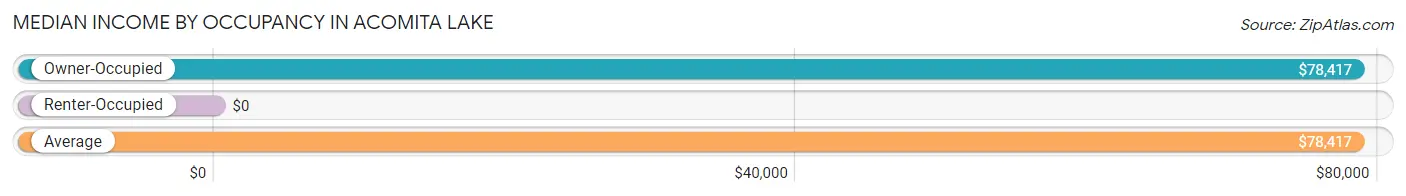
| Occupancy Type | # Households | Median Income |
| Owner-Occupied | 137 (100.0%) | $78,417 |
| Renter-Occupied | 0 (0.0%) | $0 |
| Average | 137 (100.0%) | $78,417 |
Occupancy by Householder Income Bracket in Acomita Lake
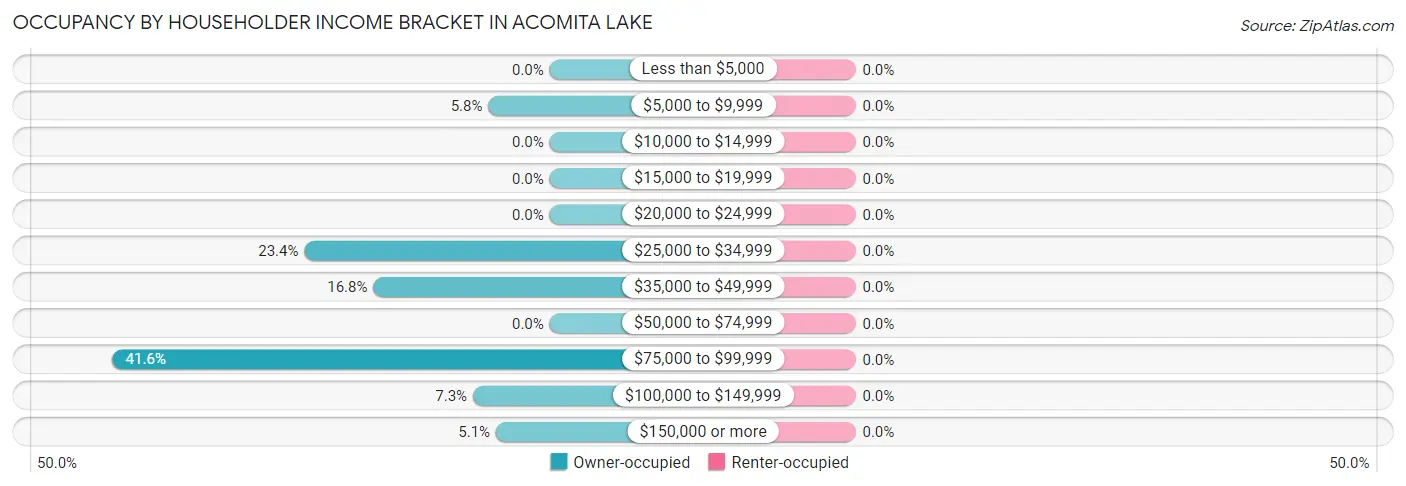
| Income Bracket | Owner-occupied | Renter-occupied |
| Less than $5,000 | 0 (0.0%) | 0 (0.0%) |
| $5,000 to $9,999 | 8 (5.8%) | 0 (0.0%) |
| $10,000 to $14,999 | 0 (0.0%) | 0 (0.0%) |
| $15,000 to $19,999 | 0 (0.0%) | 0 (0.0%) |
| $20,000 to $24,999 | 0 (0.0%) | 0 (0.0%) |
| $25,000 to $34,999 | 32 (23.4%) | 0 (0.0%) |
| $35,000 to $49,999 | 23 (16.8%) | 0 (0.0%) |
| $50,000 to $74,999 | 0 (0.0%) | 0 (0.0%) |
| $75,000 to $99,999 | 57 (41.6%) | 0 (0.0%) |
| $100,000 to $149,999 | 10 (7.3%) | 0 (0.0%) |
| $150,000 or more | 7 (5.1%) | 0 (0.0%) |
| Total | 137 (100.0%) | 0 (0.0%) |
Monthly Housing Cost Tiers in Acomita Lake
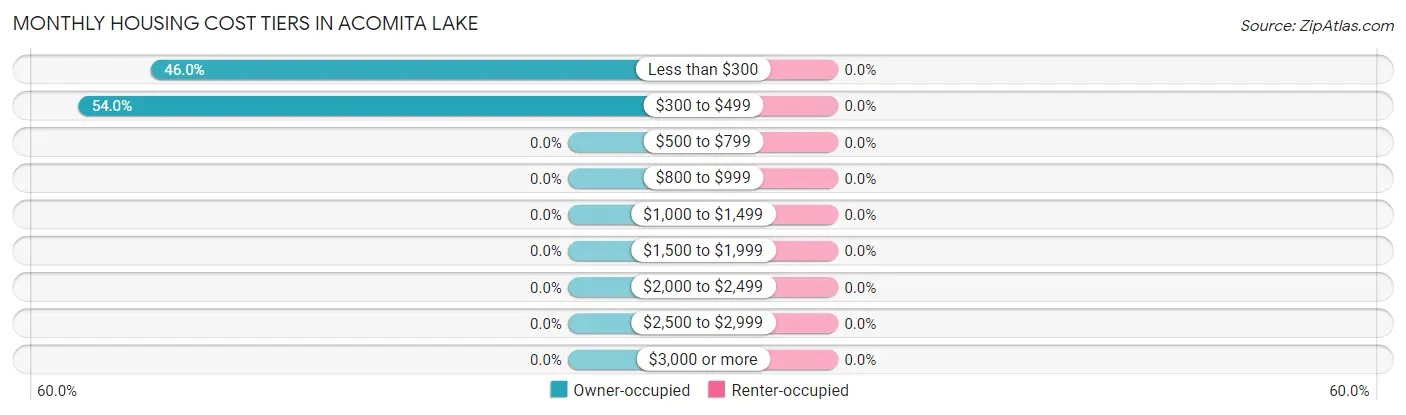
| Monthly Cost | Owner-occupied | Renter-occupied |
| Less than $300 | 63 (46.0%) | 0 (0.0%) |
| $300 to $499 | 74 (54.0%) | 0 (0.0%) |
| $500 to $799 | 0 (0.0%) | 0 (0.0%) |
| $800 to $999 | 0 (0.0%) | 0 (0.0%) |
| $1,000 to $1,499 | 0 (0.0%) | 0 (0.0%) |
| $1,500 to $1,999 | 0 (0.0%) | 0 (0.0%) |
| $2,000 to $2,499 | 0 (0.0%) | 0 (0.0%) |
| $2,500 to $2,999 | 0 (0.0%) | 0 (0.0%) |
| $3,000 or more | 0 (0.0%) | 0 (0.0%) |
| Total | 137 (100.0%) | 0 (0.0%) |
Physical Housing Characteristics in Acomita Lake
Housing Structures in Acomita Lake
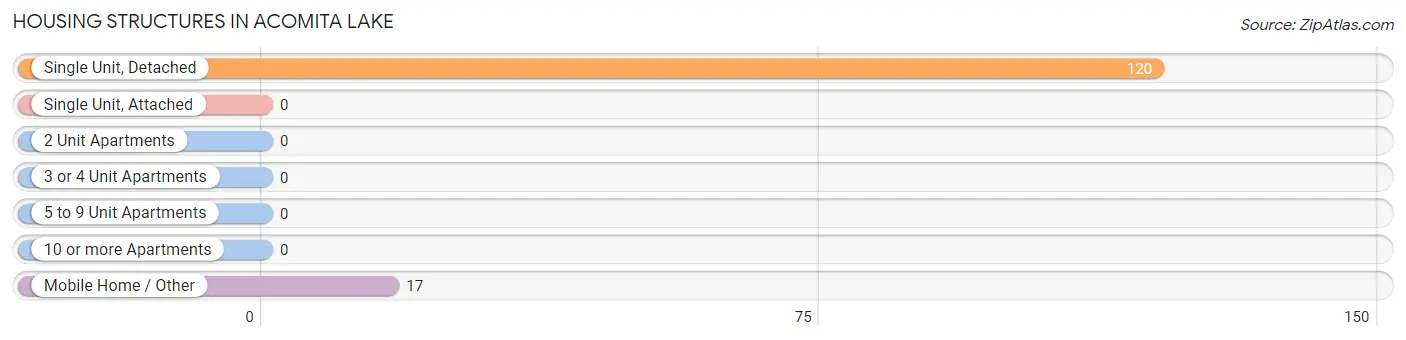
| Structure Type | # Housing Units | % Housing Units |
| Single Unit, Detached | 120 | 87.6% |
| Single Unit, Attached | 0 | 0.0% |
| 2 Unit Apartments | 0 | 0.0% |
| 3 or 4 Unit Apartments | 0 | 0.0% |
| 5 to 9 Unit Apartments | 0 | 0.0% |
| 10 or more Apartments | 0 | 0.0% |
| Mobile Home / Other | 17 | 12.4% |
| Total | 137 | 100.0% |
Housing Structures by Occupancy in Acomita Lake
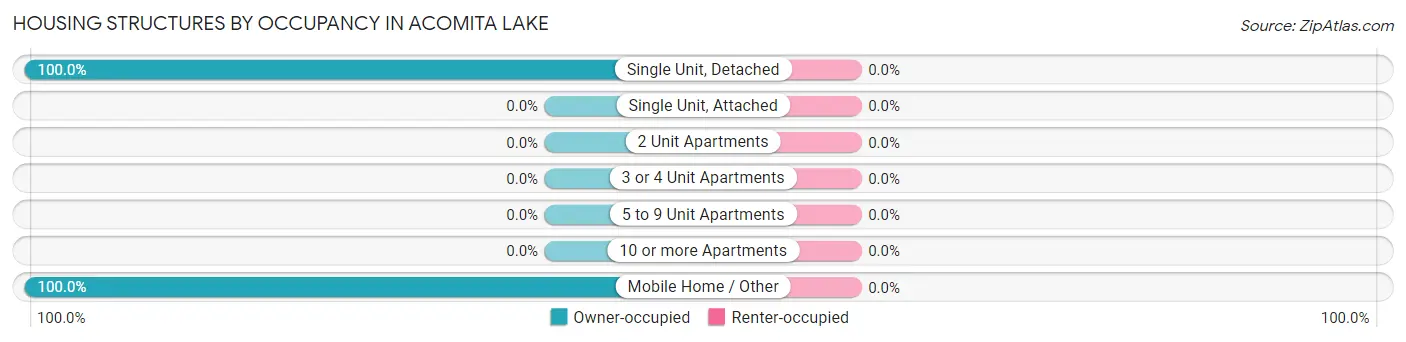
| Structure Type | Owner-occupied | Renter-occupied |
| Single Unit, Detached | 120 (100.0%) | 0 (0.0%) |
| Single Unit, Attached | 0 (0.0%) | 0 (0.0%) |
| 2 Unit Apartments | 0 (0.0%) | 0 (0.0%) |
| 3 or 4 Unit Apartments | 0 (0.0%) | 0 (0.0%) |
| 5 to 9 Unit Apartments | 0 (0.0%) | 0 (0.0%) |
| 10 or more Apartments | 0 (0.0%) | 0 (0.0%) |
| Mobile Home / Other | 17 (100.0%) | 0 (0.0%) |
| Total | 137 (100.0%) | 0 (0.0%) |
Housing Structures by Number of Rooms in Acomita Lake
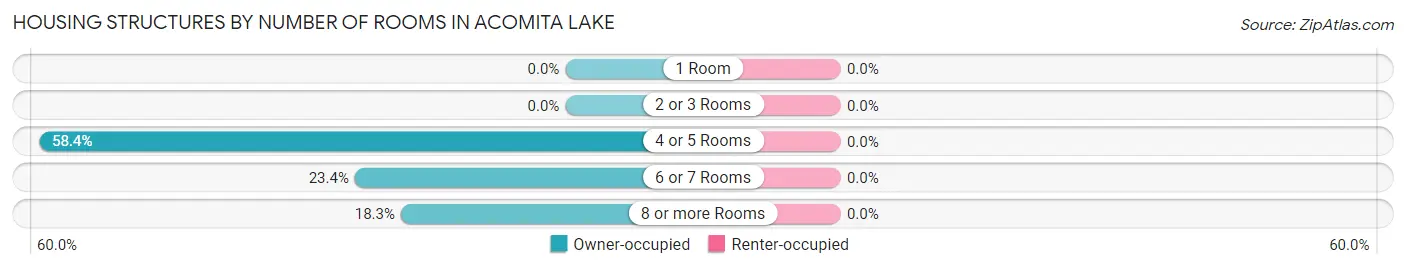
| Number of Rooms | Owner-occupied | Renter-occupied |
| 1 Room | 0 (0.0%) | 0 (0.0%) |
| 2 or 3 Rooms | 0 (0.0%) | 0 (0.0%) |
| 4 or 5 Rooms | 80 (58.4%) | 0 (0.0%) |
| 6 or 7 Rooms | 32 (23.4%) | 0 (0.0%) |
| 8 or more Rooms | 25 (18.2%) | 0 (0.0%) |
| Total | 137 (100.0%) | 0 (0.0%) |
Housing Structure by Heating Type in Acomita Lake
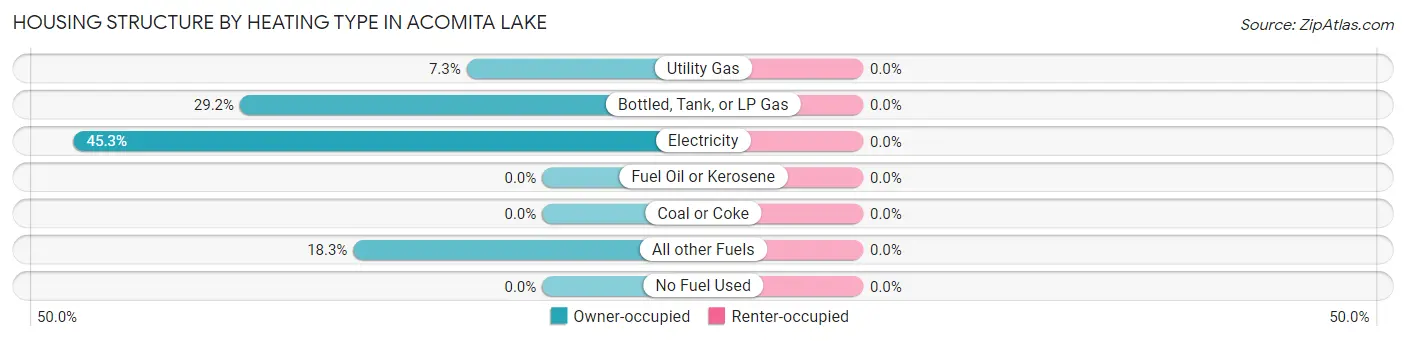
| Heating Type | Owner-occupied | Renter-occupied |
| Utility Gas | 10 (7.3%) | 0 (0.0%) |
| Bottled, Tank, or LP Gas | 40 (29.2%) | 0 (0.0%) |
| Electricity | 62 (45.3%) | 0 (0.0%) |
| Fuel Oil or Kerosene | 0 (0.0%) | 0 (0.0%) |
| Coal or Coke | 0 (0.0%) | 0 (0.0%) |
| All other Fuels | 25 (18.2%) | 0 (0.0%) |
| No Fuel Used | 0 (0.0%) | 0 (0.0%) |
| Total | 137 (100.0%) | 0 (0.0%) |
Household Vehicle Usage in Acomita Lake
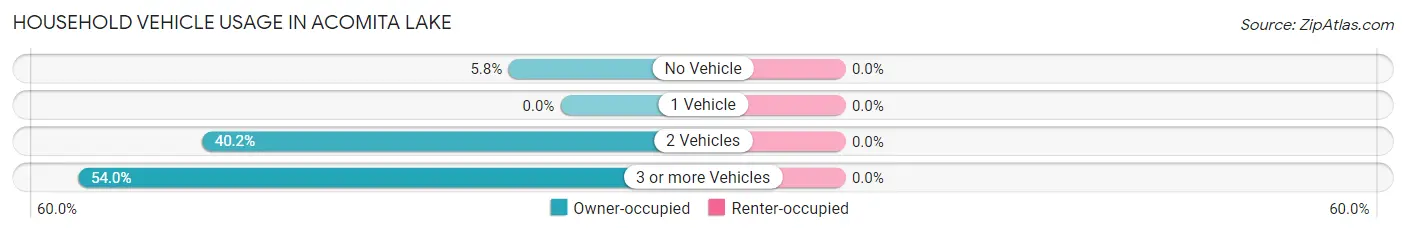
| Vehicles per Household | Owner-occupied | Renter-occupied |
| No Vehicle | 8 (5.8%) | 0 (0.0%) |
| 1 Vehicle | 0 (0.0%) | 0 (0.0%) |
| 2 Vehicles | 55 (40.2%) | 0 (0.0%) |
| 3 or more Vehicles | 74 (54.0%) | 0 (0.0%) |
| Total | 137 (100.0%) | 0 (0.0%) |
Real Estate & Mortgages in Acomita Lake
Real Estate and Mortgage Overview in Acomita Lake
| Characteristic | Without Mortgage | With Mortgage |
| Housing Units | 137 | 0 |
| Median Property Value | - | - |
| Median Household Income | $78,417 | $0 |
| Monthly Housing Costs | $309 | $0 |
| Real Estate Taxes | - | - |
Property Value by Mortgage Status in Acomita Lake

| Property Value | Without Mortgage | With Mortgage |
| Less than $50,000 | 75 (54.7%) | 0 (0.0%) |
| $50,000 to $99,999 | 0 (0.0%) | 0 (0.0%) |
| $100,000 to $299,999 | 62 (45.3%) | 0 (0.0%) |
| $300,000 to $499,999 | 0 (0.0%) | 0 (0.0%) |
| $500,000 to $749,999 | 0 (0.0%) | 0 (0.0%) |
| $750,000 to $999,999 | 0 (0.0%) | 0 (0.0%) |
| $1,000,000 or more | 0 (0.0%) | 0 (0.0%) |
| Total | 137 (100.0%) | 0 (0.0%) |
Household Income by Mortgage Status in Acomita Lake
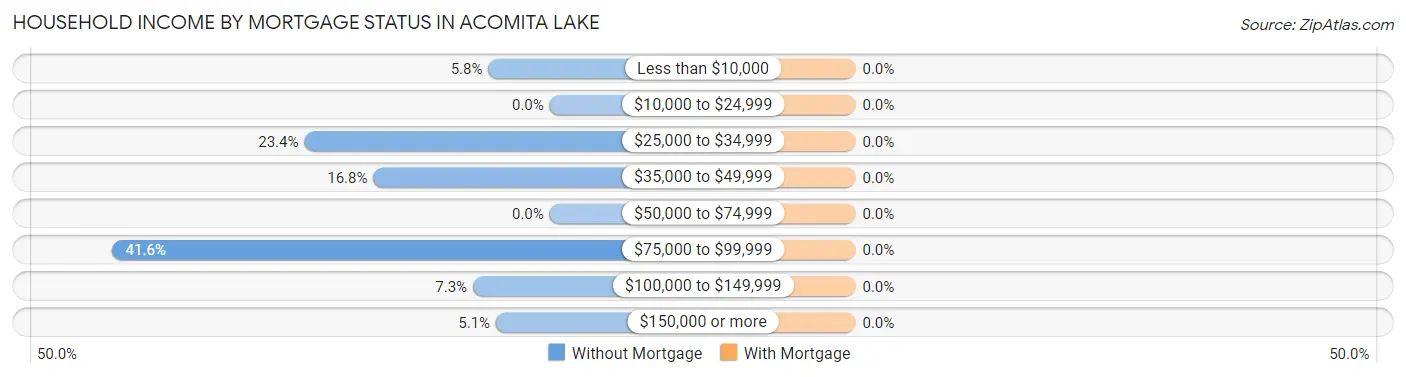
| Household Income | Without Mortgage | With Mortgage |
| Less than $10,000 | 8 (5.8%) | 0 (0.0%) |
| $10,000 to $24,999 | 0 (0.0%) | 0 (0.0%) |
| $25,000 to $34,999 | 32 (23.4%) | 0 (0.0%) |
| $35,000 to $49,999 | 23 (16.8%) | 0 (0.0%) |
| $50,000 to $74,999 | 0 (0.0%) | 0 (0.0%) |
| $75,000 to $99,999 | 57 (41.6%) | 0 (0.0%) |
| $100,000 to $149,999 | 10 (7.3%) | 0 (0.0%) |
| $150,000 or more | 7 (5.1%) | 0 (0.0%) |
| Total | 137 (100.0%) | 0 (0.0%) |
Property Value to Household Income Ratio in Acomita Lake
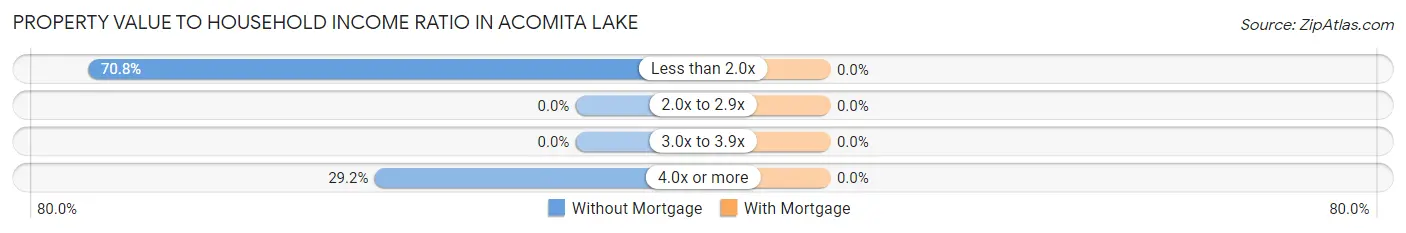
| Value-to-Income Ratio | Without Mortgage | With Mortgage |
| Less than 2.0x | 97 (70.8%) | 0 (0.0%) |
| 2.0x to 2.9x | 0 (0.0%) | 0 (0.0%) |
| 3.0x to 3.9x | 0 (0.0%) | 0 (0.0%) |
| 4.0x or more | 40 (29.2%) | 0 (0.0%) |
| Total | 137 (100.0%) | 0 (0.0%) |
Real Estate Taxes by Mortgage Status in Acomita Lake
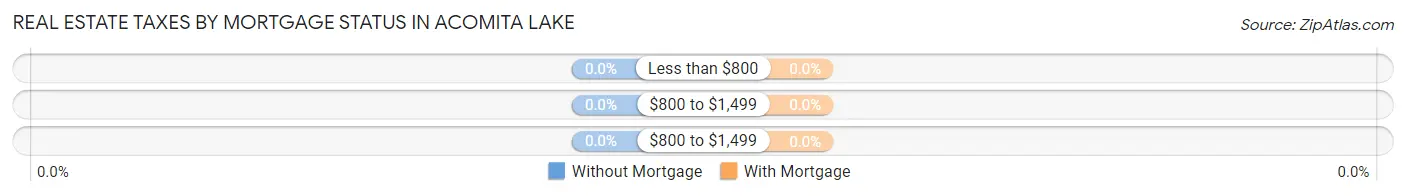
| Property Taxes | Without Mortgage | With Mortgage |
| Less than $800 | 0 (0.0%) | 0 (0.0%) |
| $800 to $1,499 | 0 (0.0%) | 0 (0.0%) |
| $800 to $1,499 | 0 (0.0%) | 0 (0.0%) |
| Total | 137 (100.0%) | 0 (0.0%) |
Health & Disability in Acomita Lake
Health Insurance Coverage by Age in Acomita Lake
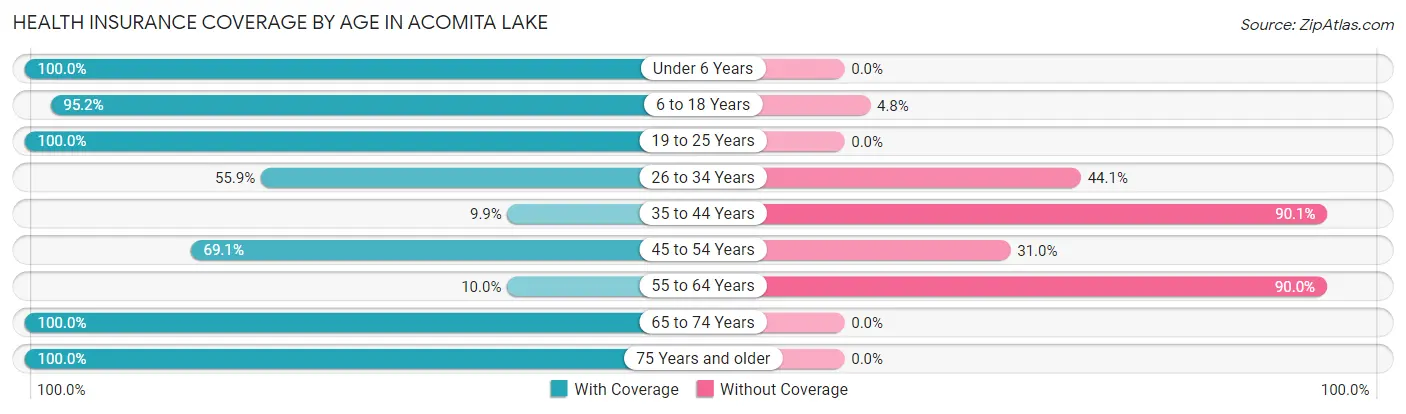
| Age Bracket | With Coverage | Without Coverage |
| Under 6 Years | 60 (100.0%) | 0 (0.0%) |
| 6 to 18 Years | 119 (95.2%) | 6 (4.8%) |
| 19 to 25 Years | 44 (100.0%) | 0 (0.0%) |
| 26 to 34 Years | 52 (55.9%) | 41 (44.1%) |
| 35 to 44 Years | 14 (9.9%) | 127 (90.1%) |
| 45 to 54 Years | 87 (69.1%) | 39 (30.9%) |
| 55 to 64 Years | 8 (10.0%) | 72 (90.0%) |
| 65 to 74 Years | 14 (100.0%) | 0 (0.0%) |
| 75 Years and older | 45 (100.0%) | 0 (0.0%) |
| Total | 443 (60.9%) | 285 (39.2%) |
Health Insurance Coverage by Citizenship Status in Acomita Lake
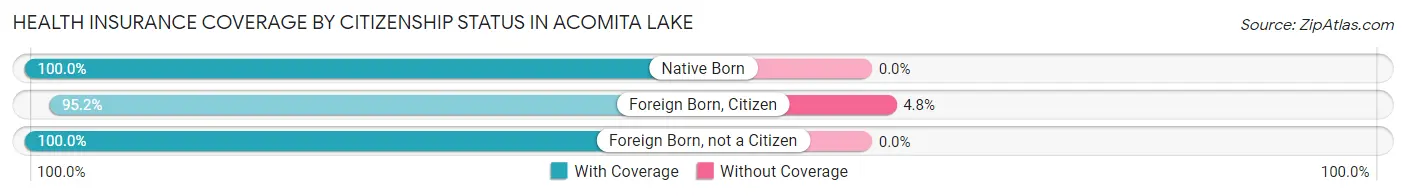
| Citizenship Status | With Coverage | Without Coverage |
| Native Born | 60 (100.0%) | 0 (0.0%) |
| Foreign Born, Citizen | 119 (95.2%) | 6 (4.8%) |
| Foreign Born, not a Citizen | 44 (100.0%) | 0 (0.0%) |
Health Insurance Coverage by Household Income in Acomita Lake

| Household Income | With Coverage | Without Coverage |
| Under $25,000 | 0 (0.0%) | 8 (100.0%) |
| $25,000 to $49,999 | 179 (76.8%) | 54 (23.2%) |
| $50,000 to $74,999 | 0 (0.0%) | 0 (0.0%) |
| $75,000 to $99,999 | 171 (46.9%) | 194 (53.1%) |
| $100,000 and over | 93 (76.2%) | 29 (23.8%) |
Public vs Private Health Insurance Coverage by Age in Acomita Lake
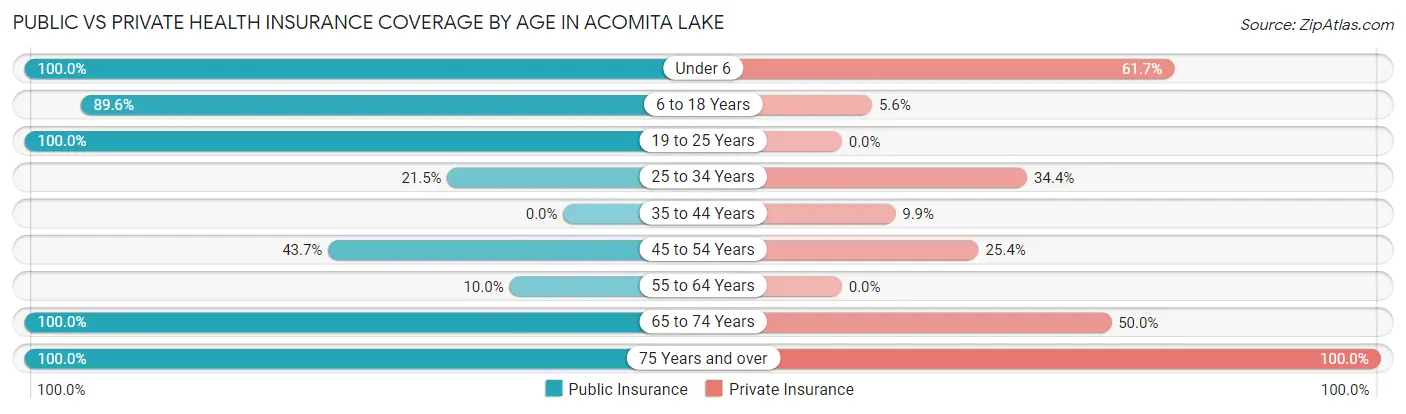
| Age Bracket | Public Insurance | Private Insurance |
| Under 6 | 60 (100.0%) | 37 (61.7%) |
| 6 to 18 Years | 112 (89.6%) | 7 (5.6%) |
| 19 to 25 Years | 44 (100.0%) | 0 (0.0%) |
| 25 to 34 Years | 20 (21.5%) | 32 (34.4%) |
| 35 to 44 Years | 0 (0.0%) | 14 (9.9%) |
| 45 to 54 Years | 55 (43.6%) | 32 (25.4%) |
| 55 to 64 Years | 8 (10.0%) | 0 (0.0%) |
| 65 to 74 Years | 14 (100.0%) | 7 (50.0%) |
| 75 Years and over | 45 (100.0%) | 45 (100.0%) |
| Total | 358 (49.2%) | 174 (23.9%) |
Disability Status by Sex by Age in Acomita Lake
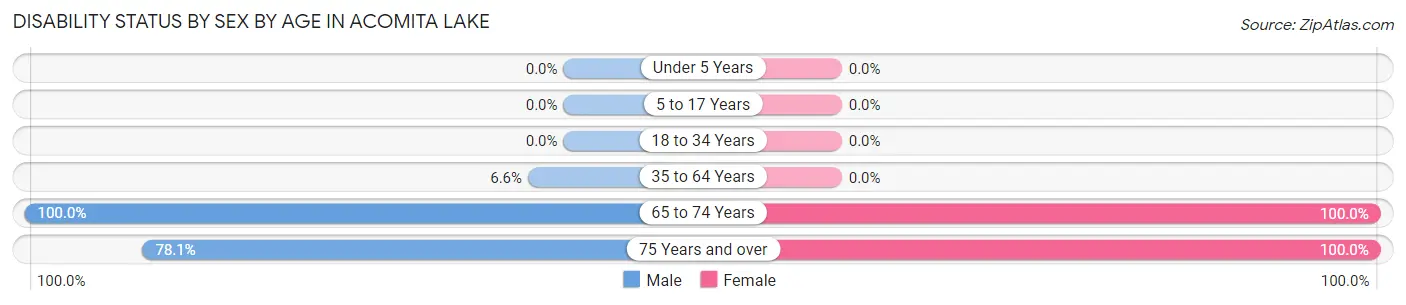
| Age Bracket | Male | Female |
| Under 5 Years | 0 (0.0%) | 0 (0.0%) |
| 5 to 17 Years | 0 (0.0%) | 0 (0.0%) |
| 18 to 34 Years | 0 (0.0%) | 0 (0.0%) |
| 35 to 64 Years | 12 (6.6%) | 0 (0.0%) |
| 65 to 74 Years | 7 (100.0%) | 7 (100.0%) |
| 75 Years and over | 25 (78.1%) | 13 (100.0%) |
Disability Class by Sex by Age in Acomita Lake
Disability Class: Hearing Difficulty
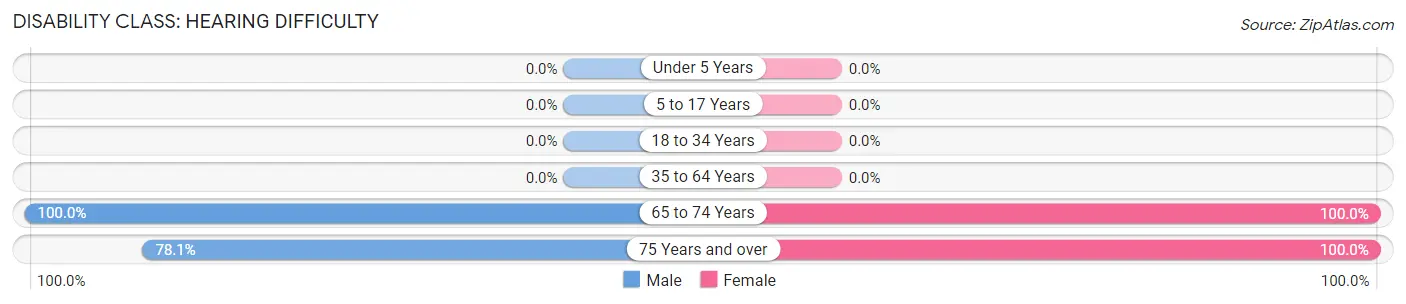
| Age Bracket | Male | Female |
| Under 5 Years | 0 (0.0%) | 0 (0.0%) |
| 5 to 17 Years | 0 (0.0%) | 0 (0.0%) |
| 18 to 34 Years | 0 (0.0%) | 0 (0.0%) |
| 35 to 64 Years | 0 (0.0%) | 0 (0.0%) |
| 65 to 74 Years | 7 (100.0%) | 7 (100.0%) |
| 75 Years and over | 25 (78.1%) | 13 (100.0%) |
Disability Class: Vision Difficulty
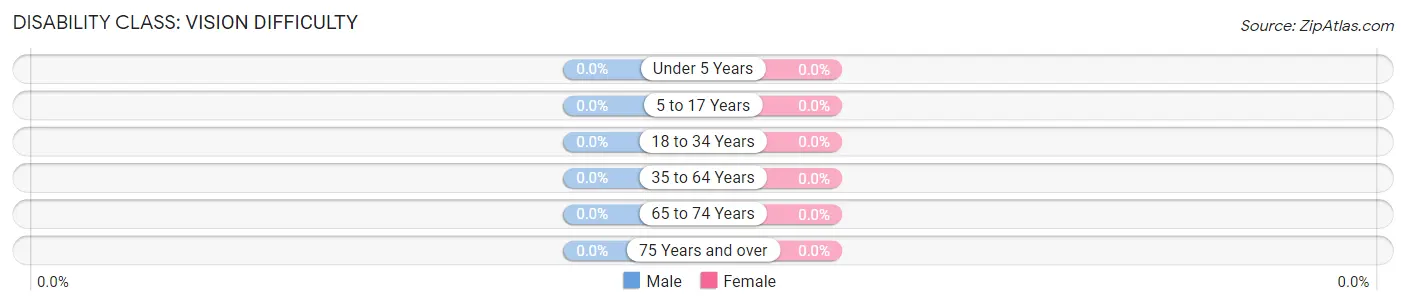
| Age Bracket | Male | Female |
| Under 5 Years | 0 (0.0%) | 0 (0.0%) |
| 5 to 17 Years | 0 (0.0%) | 0 (0.0%) |
| 18 to 34 Years | 0 (0.0%) | 0 (0.0%) |
| 35 to 64 Years | 0 (0.0%) | 0 (0.0%) |
| 65 to 74 Years | 0 (0.0%) | 0 (0.0%) |
| 75 Years and over | 0 (0.0%) | 0 (0.0%) |
Disability Class: Cognitive Difficulty
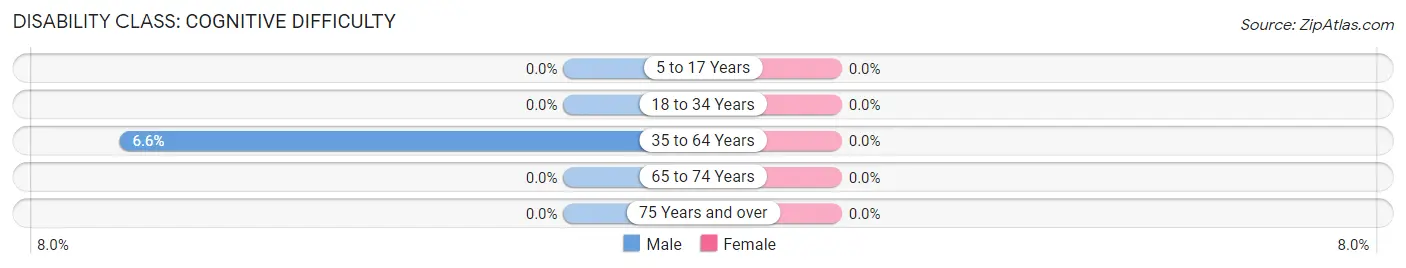
| Age Bracket | Male | Female |
| 5 to 17 Years | 0 (0.0%) | 0 (0.0%) |
| 18 to 34 Years | 0 (0.0%) | 0 (0.0%) |
| 35 to 64 Years | 12 (6.6%) | 0 (0.0%) |
| 65 to 74 Years | 0 (0.0%) | 0 (0.0%) |
| 75 Years and over | 0 (0.0%) | 0 (0.0%) |
Disability Class: Ambulatory Difficulty
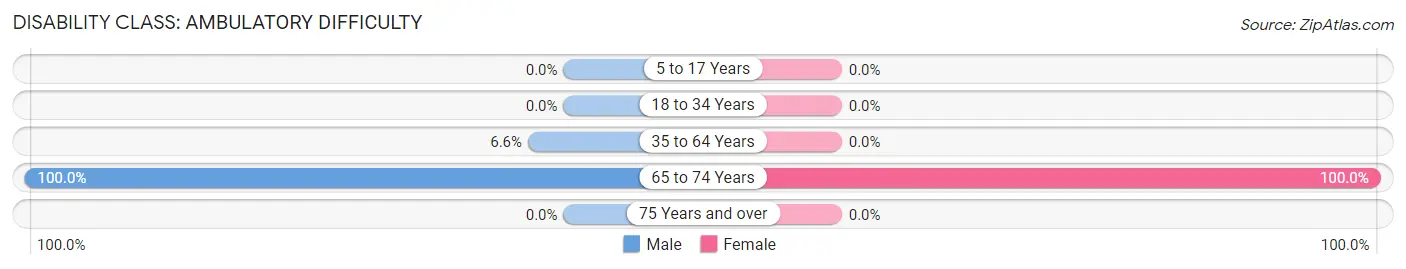
| Age Bracket | Male | Female |
| 5 to 17 Years | 0 (0.0%) | 0 (0.0%) |
| 18 to 34 Years | 0 (0.0%) | 0 (0.0%) |
| 35 to 64 Years | 12 (6.6%) | 0 (0.0%) |
| 65 to 74 Years | 7 (100.0%) | 7 (100.0%) |
| 75 Years and over | 0 (0.0%) | 0 (0.0%) |
Disability Class: Self-Care Difficulty
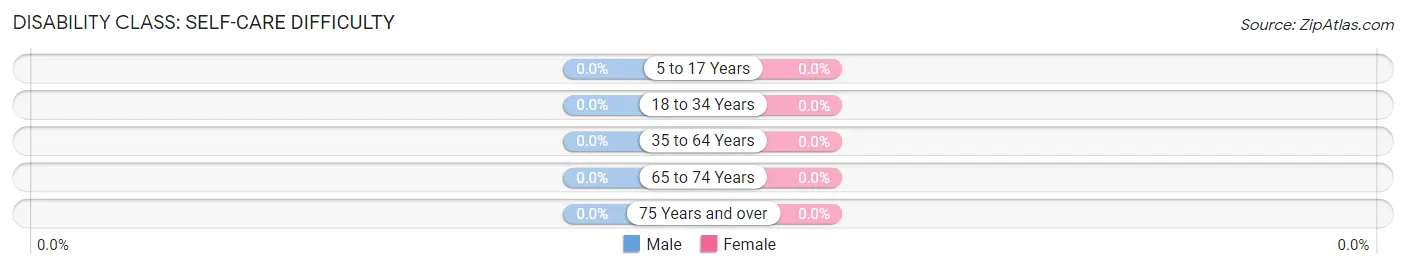
| Age Bracket | Male | Female |
| 5 to 17 Years | 0 (0.0%) | 0 (0.0%) |
| 18 to 34 Years | 0 (0.0%) | 0 (0.0%) |
| 35 to 64 Years | 0 (0.0%) | 0 (0.0%) |
| 65 to 74 Years | 0 (0.0%) | 0 (0.0%) |
| 75 Years and over | 0 (0.0%) | 0 (0.0%) |
Technology Access in Acomita Lake
Computing Device Access in Acomita Lake
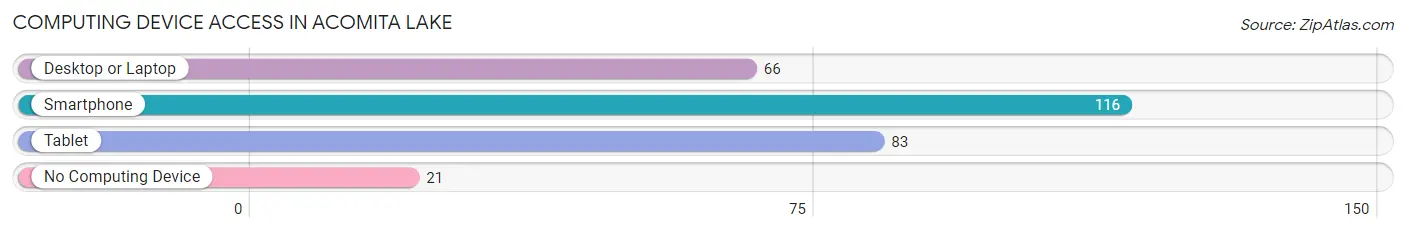
| Device Type | # Households | % Households |
| Desktop or Laptop | 66 | 48.2% |
| Smartphone | 116 | 84.7% |
| Tablet | 83 | 60.6% |
| No Computing Device | 21 | 15.3% |
| Total | 137 | 100.0% |
Internet Access in Acomita Lake
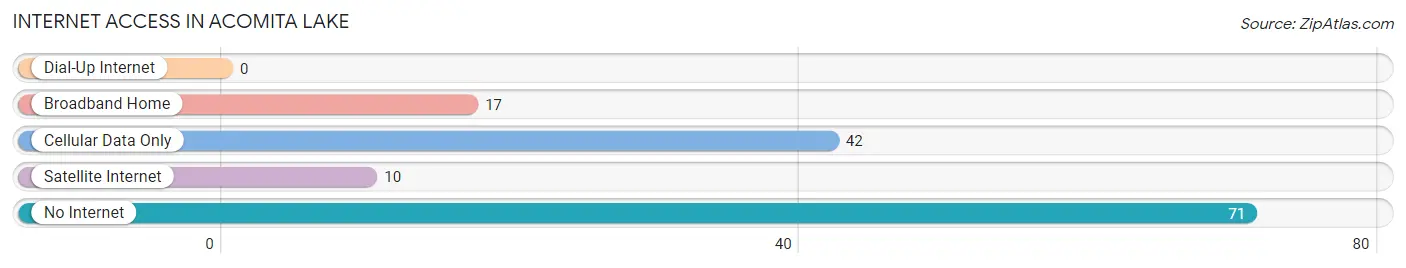
| Internet Type | # Households | % Households |
| Dial-Up Internet | 0 | 0.0% |
| Broadband Home | 17 | 12.4% |
| Cellular Data Only | 42 | 30.7% |
| Satellite Internet | 10 | 7.3% |
| No Internet | 71 | 51.8% |
| Total | 137 | 100.0% |
Acomita Lake Summary
Acomita Lake is a small lake located in the Cibola National Forest in New Mexico. It is situated in the western part of the state, about 25 miles east of Grants. The lake is a popular destination for fishing, camping, and other outdoor activities.
Geography
Acomita Lake is located in the Cibola National Forest in western New Mexico. The lake is situated at an elevation of 6,400 feet and is surrounded by the Zuni Mountains. The lake is approximately 1.5 miles long and 0.5 miles wide. The lake is fed by several small streams and springs, and is drained by the Acomita Creek. The lake is surrounded by a variety of vegetation, including ponderosa pine, juniper, and oak.
Economy
Acomita Lake is a popular destination for fishing, camping, and other outdoor activities. The lake is stocked with a variety of fish, including rainbow trout, brown trout, and largemouth bass. The lake is also a popular destination for bird watching, as it is home to a variety of species, including bald eagles, ospreys, and great blue herons. The lake is also a popular destination for boating, canoeing, and kayaking.
Demographics
The population of Acomita Lake is small, with only a few hundred people living in the area. The majority of the population is Native American, with the largest tribe being the Zuni. The population is also diverse, with a mix of Hispanic, Anglo, and African American residents.
History
Acomita Lake has been a popular destination for centuries. The lake was originally inhabited by the Zuni tribe, who used the lake for fishing and other activities. The lake was also a popular destination for early settlers, who used the lake for recreation and fishing. In the early 1900s, the lake was developed for recreational use, with the construction of a dam and the creation of a fishing resort. The lake has remained a popular destination for fishing, camping, and other outdoor activities ever since.
Conclusion
Acomita Lake is a small lake located in the Cibola National Forest in western New Mexico. The lake is a popular destination for fishing, camping, and other outdoor activities. The lake is surrounded by a variety of vegetation, including ponderosa pine, juniper, and oak. The population of Acomita Lake is small, with the majority of the population being Native American. The lake has been a popular destination for centuries, and continues to be a popular destination for fishing, camping, and other outdoor activities.
Common Questions
What is the Total Population of Acomita Lake?
Total Population of Acomita Lake is 728.
What is the Total Male Population of Acomita Lake?
Total Male Population of Acomita Lake is 402.
What is the Total Female Population of Acomita Lake?
Total Female Population of Acomita Lake is 326.
What is the Ratio of Males per 100 Females in Acomita Lake?
There are 123.31 Males per 100 Females in Acomita Lake.
What is the Ratio of Females per 100 Males in Acomita Lake?
There are 81.09 Females per 100 Males in Acomita Lake.
What is the Median Population Age in Acomita Lake?
Median Population Age in Acomita Lake is 37.7 Years.
What is the Average Family Size in Acomita Lake
Average Family Size in Acomita Lake is 5.7 People.
What is the Average Household Size in Acomita Lake
Average Household Size in Acomita Lake is 5.3 People.
What is Per Capita Income in Acomita Lake?
Per Capita income in Acomita Lake is $15,402.
What is the Median Family Income in Acomita Lake?
Median Family Income in Acomita Lake is $80,060.
What is the Median Household income in Acomita Lake?
Median Household Income in Acomita Lake is $78,417.
What is Inequality or Gini Index in Acomita Lake?
Inequality or Gini Index in Acomita Lake is 0.32.
How Large is the Labor Force in Acomita Lake?
There are 372 People in the Labor Forcein in Acomita Lake.
What is the Percentage of People in the Labor Force in Acomita Lake?
65.7% of People are in the Labor Force in Acomita Lake.