Picuris Pueblo, NM
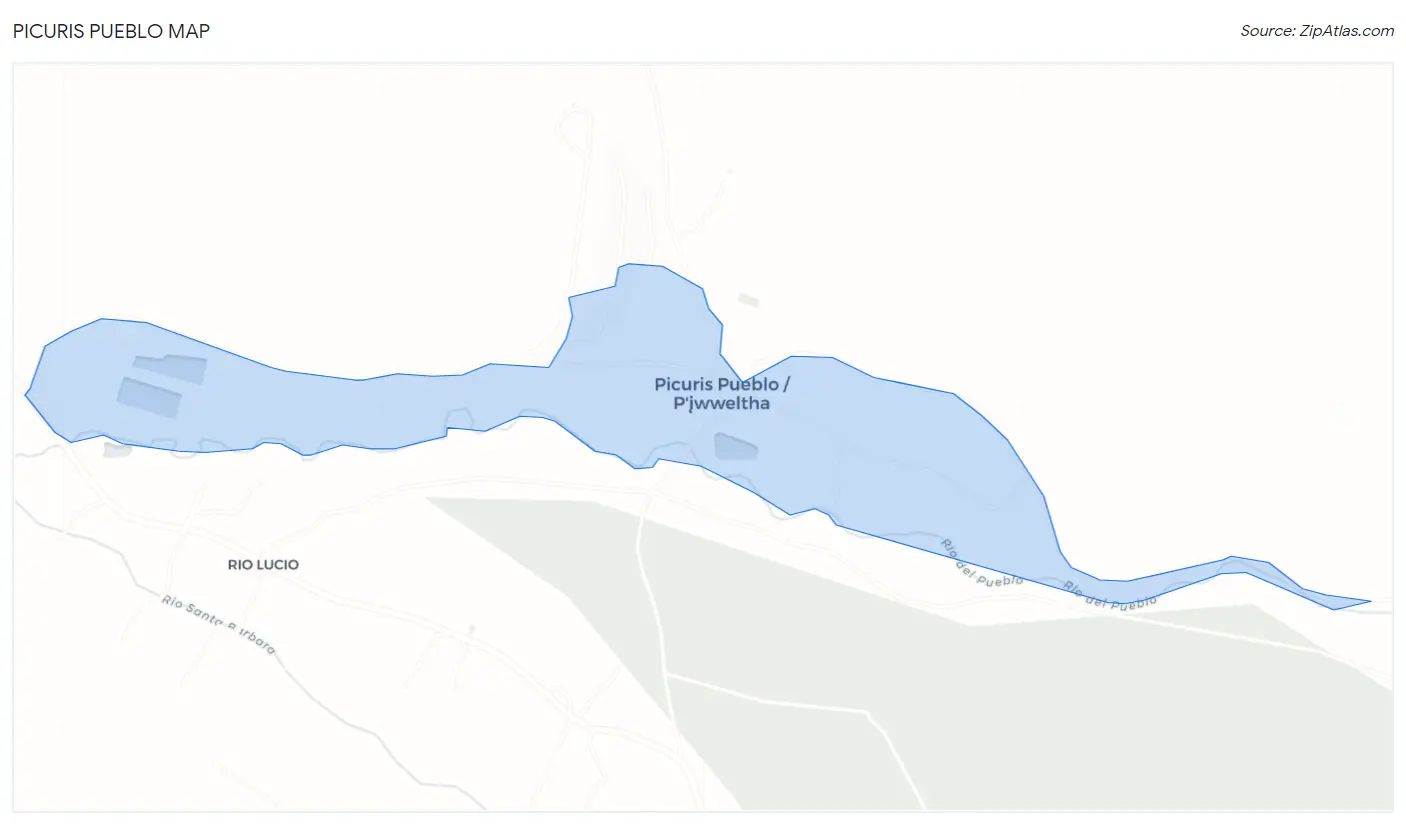
Picuris Pueblo Map
Picuris Pueblo Overview
75
TOTAL POPULATION
31
MALE POPULATION
44
FEMALE POPULATION
70.45
MALES / 100 FEMALES
141.94
FEMALES / 100 MALES
62.3
MEDIAN AGE
5.5
AVG FAMILY SIZE
3.3
AVG HOUSEHOLD SIZE
$21,853
PER CAPITA INCOME
$28,125
AVG HOUSEHOLD INCOME
73.2%
WAGE / INCOME GAP [ % ]
26.8¢/ $1
WAGE / INCOME GAP [ $ ]
0.50
INEQUALITY / GINI INDEX
31
LABOR FORCE [ PEOPLE ]
43.7%
PERCENT IN LABOR FORCE
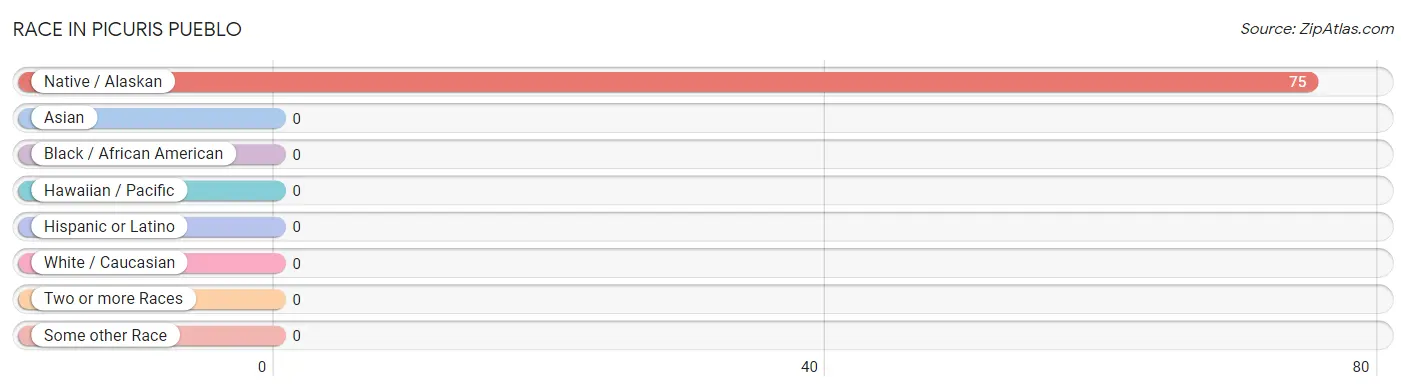
Race in Picuris Pueblo
The most populous races in Picuris Pueblo are , and Native / Alaskan (75 | 100.0%).
| Race | # Population | % Population |
| Asian | 0 | 0.0% |
| Black / African American | 0 | 0.0% |
| Hawaiian / Pacific | 0 | 0.0% |
| Hispanic or Latino | 0 | 0.0% |
| Native / Alaskan | 75 | 100.0% |
| White / Caucasian | 0 | 0.0% |
| Two or more Races | 0 | 0.0% |
| Some other Race | 0 | 0.0% |
| Total | 75 | 100.0% |
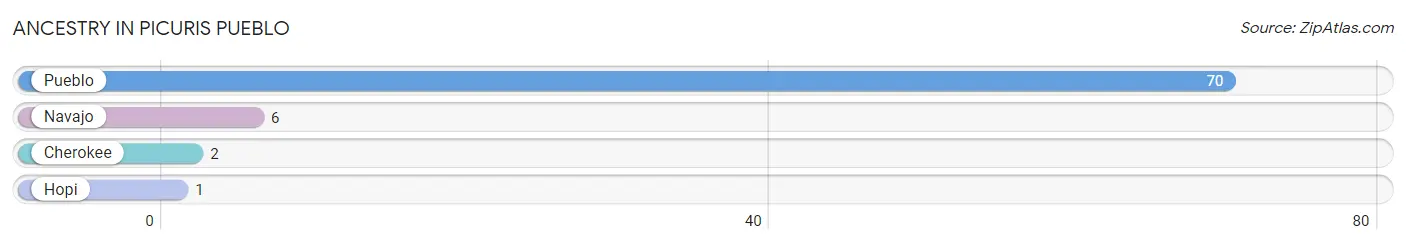
Ancestry in Picuris Pueblo
The most populous ancestries reported in Picuris Pueblo are Pueblo (70 | 93.3%), Navajo (6 | 8.0%), Cherokee (2 | 2.7%), and Hopi (1 | 1.3%), together accounting for 105.3% of all Picuris Pueblo residents.
| Ancestry | # Population | % Population |
| Cherokee | 2 | 2.7% |
| Hopi | 1 | 1.3% |
| Navajo | 6 | 8.0% |
| Pueblo | 70 | 93.3% | View All 4 Rows |
Immigrants in Picuris Pueblo

| Immigration Origin | # Population | % Population | View All 0 Rows |
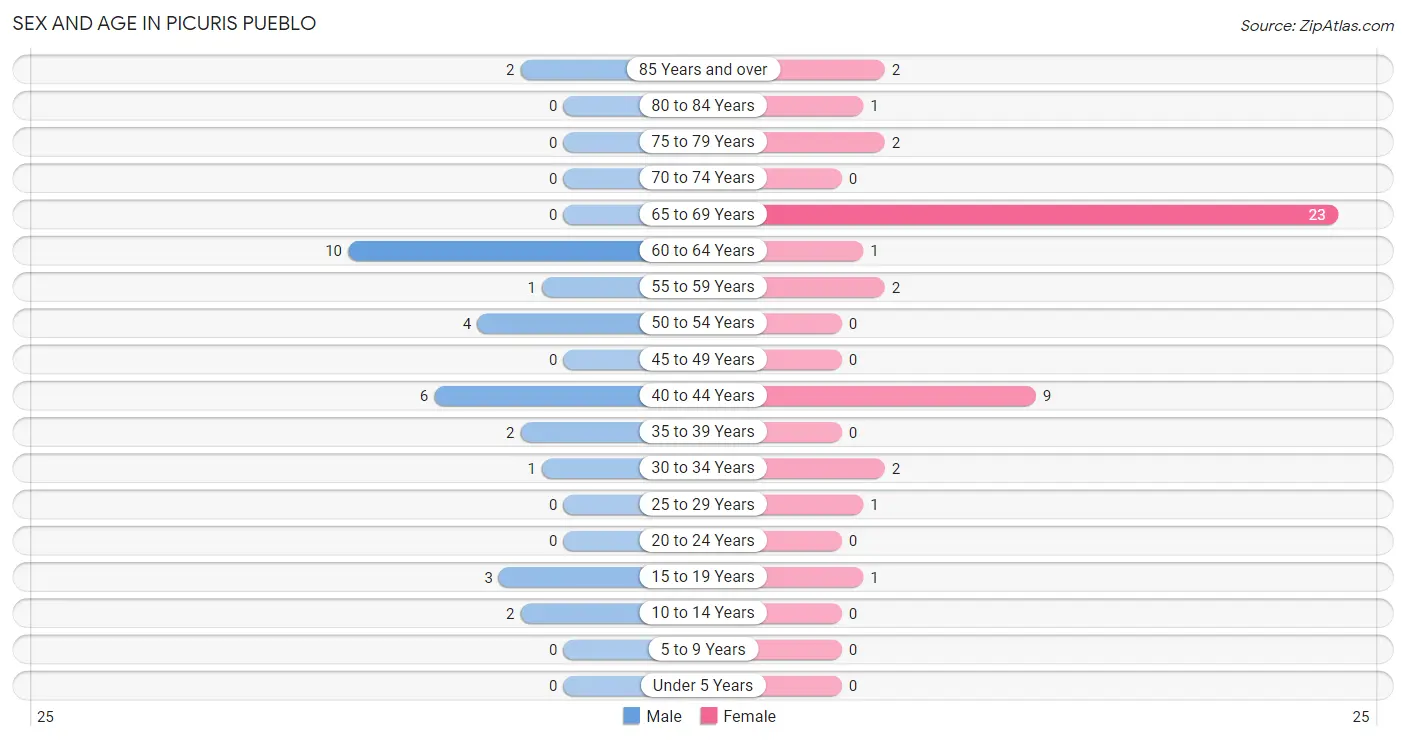
Sex and Age in Picuris Pueblo
Sex and Age in Picuris Pueblo
The most populous age groups in Picuris Pueblo are 60 to 64 Years (10 | 32.3%) for men and 65 to 69 Years (23 | 52.3%) for women.
| Age Bracket | Male | Female |
| Under 5 Years | 0 (0.0%) | 0 (0.0%) |
| 5 to 9 Years | 0 (0.0%) | 0 (0.0%) |
| 10 to 14 Years | 2 (6.5%) | 0 (0.0%) |
| 15 to 19 Years | 3 (9.7%) | 1 (2.3%) |
| 20 to 24 Years | 0 (0.0%) | 0 (0.0%) |
| 25 to 29 Years | 0 (0.0%) | 1 (2.3%) |
| 30 to 34 Years | 1 (3.2%) | 2 (4.5%) |
| 35 to 39 Years | 2 (6.5%) | 0 (0.0%) |
| 40 to 44 Years | 6 (19.4%) | 9 (20.4%) |
| 45 to 49 Years | 0 (0.0%) | 0 (0.0%) |
| 50 to 54 Years | 4 (12.9%) | 0 (0.0%) |
| 55 to 59 Years | 1 (3.2%) | 2 (4.5%) |
| 60 to 64 Years | 10 (32.3%) | 1 (2.3%) |
| 65 to 69 Years | 0 (0.0%) | 23 (52.3%) |
| 70 to 74 Years | 0 (0.0%) | 0 (0.0%) |
| 75 to 79 Years | 0 (0.0%) | 2 (4.5%) |
| 80 to 84 Years | 0 (0.0%) | 1 (2.3%) |
| 85 Years and over | 2 (6.5%) | 2 (4.5%) |
| Total | 31 (100.0%) | 44 (100.0%) |
Families and Households in Picuris Pueblo
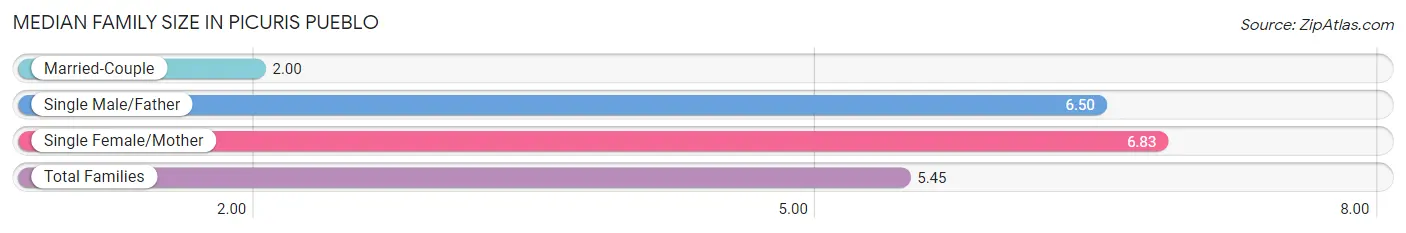
Median Family Size in Picuris Pueblo
The median family size in Picuris Pueblo is 5.45 persons per family, with single female/mother families (6 | 54.5%) accounting for the largest median family size of 6.83 persons per family. On the other hand, married-couple families (3 | 27.3%) represent the smallest median family size with 2.00 persons per family.
| Family Type | # Families | Family Size |
| Married-Couple | 3 (27.3%) | 2.00 |
| Single Male/Father | 2 (18.2%) | 6.50 |
| Single Female/Mother | 6 (54.5%) | 6.83 |
| Total Families | 11 (100.0%) | 5.45 |
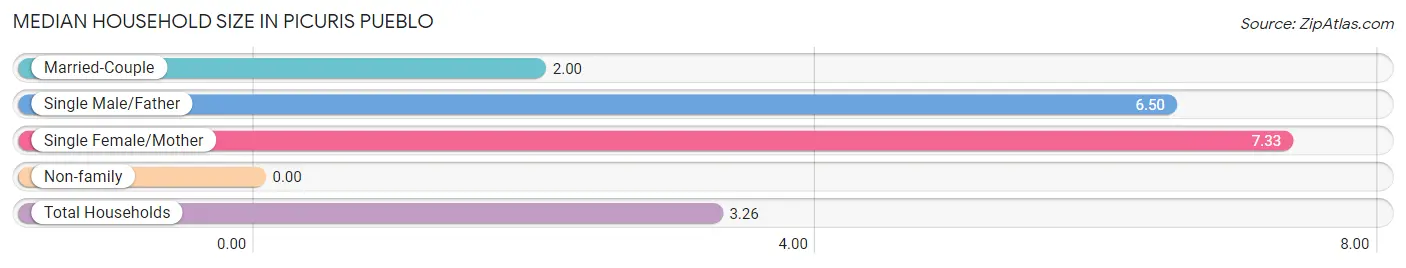
Median Household Size in Picuris Pueblo
| Household Type | # Households | Household Size |
| Married-Couple | 3 (13.0%) | 2.00 |
| Single Male/Father | 2 (8.7%) | 6.50 |
| Single Female/Mother | 6 (26.1%) | 7.33 |
| Non-family | 12 (52.2%) | - |
| Total Households | 23 (100.0%) | 3.26 |
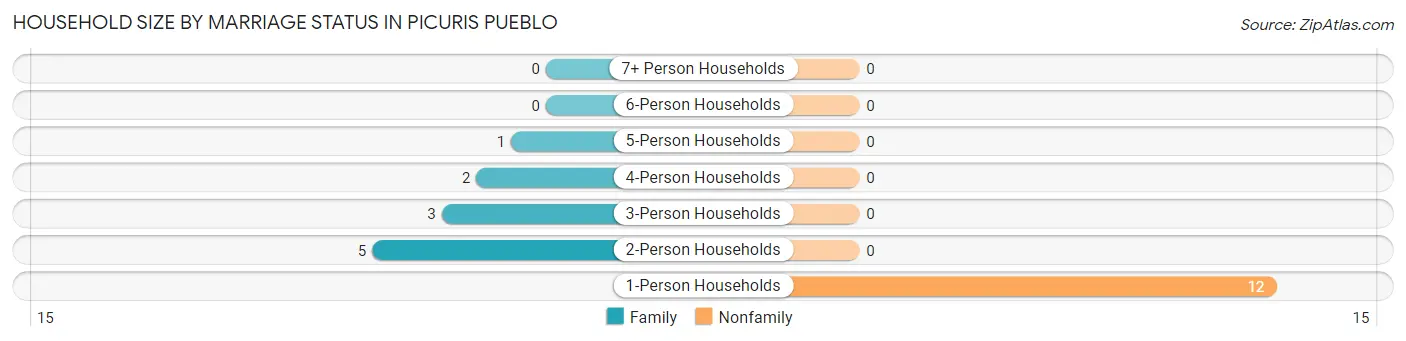
Household Size by Marriage Status in Picuris Pueblo
Out of a total of 23 households in Picuris Pueblo, 11 (47.8%) are family households, while 12 (52.2%) are nonfamily households. The most numerous type of family households are 2-person households, comprising 5, and the most common type of nonfamily households are 1-person households, comprising 12.
| Household Size | Family Households | Nonfamily Households |
| 1-Person Households | - | 12 (52.2%) |
| 2-Person Households | 5 (21.7%) | 0 (0.0%) |
| 3-Person Households | 3 (13.0%) | 0 (0.0%) |
| 4-Person Households | 2 (8.7%) | 0 (0.0%) |
| 5-Person Households | 1 (4.3%) | 0 (0.0%) |
| 6-Person Households | 0 (0.0%) | 0 (0.0%) |
| 7+ Person Households | 0 (0.0%) | 0 (0.0%) |
| Total | 11 (47.8%) | 12 (52.2%) |
Female Fertility in Picuris Pueblo
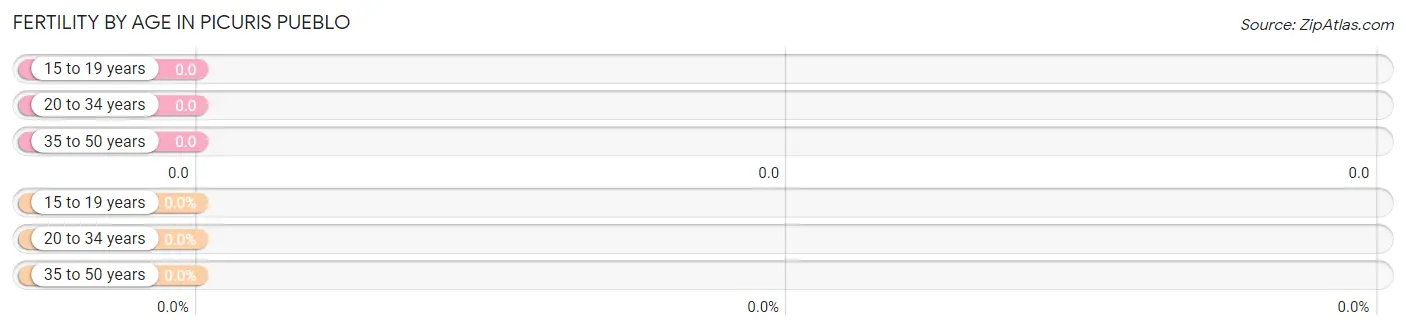
Fertility by Age in Picuris Pueblo
| Age Bracket | Women with Births | Births / 1,000 Women |
| 15 to 19 years | 0 (0.0%) | 0.0 |
| 20 to 34 years | 0 (0.0%) | 0.0 |
| 35 to 50 years | 0 (0.0%) | 0.0 |
| Total | 0 (0.0%) | 0.0 |
Fertility by Age by Marriage Status in Picuris Pueblo
| Age Bracket | Married | Unmarried |
| 15 to 19 years | 0 (0.0%) | 0 (0.0%) |
| 20 to 34 years | 0 (0.0%) | 0 (0.0%) |
| 35 to 50 years | 0 (0.0%) | 0 (0.0%) |
| Total | 0 (0.0%) | 0 (0.0%) |
Fertility by Education in Picuris Pueblo
| Educational Attainment | Women with Births | Births / 1,000 Women |
| Less than High School | 0 (0.0%) | 0.0 |
| High School Diploma | 0 (0.0%) | 0.0 |
| College or Associate's Degree | 0 (0.0%) | 0.0 |
| Bachelor's Degree | 0 (0.0%) | 0.0 |
| Graduate Degree | 0 (0.0%) | 0.0 |
| Total | 0 (0.0%) | 0.0 |
Fertility by Education by Marriage Status in Picuris Pueblo
| Educational Attainment | Married | Unmarried |
| Less than High School | 0 (0.0%) | 0 (0.0%) |
| High School Diploma | 0 (0.0%) | 0 (0.0%) |
| College or Associate's Degree | 0 (0.0%) | 0 (0.0%) |
| Bachelor's Degree | 0 (0.0%) | 0 (0.0%) |
| Graduate Degree | 0 (0.0%) | 0 (0.0%) |
| Total | 0 (0.0%) | 0 (0.0%) |
Income in Picuris Pueblo
Income Overview in Picuris Pueblo
| Characteristic | Number | Measure |
| Per Capita Income | 75 | $21,853 |
| Median Family Income | 11 | $0 |
| Mean Family Income | 11 | $45,882 |
| Median Household Income | 23 | $28,125 |
| Mean Household Income | 23 | $35,530 |
| Income Deficit | 11 | $0 |
| Wage / Income Gap (%) | 75 | 73.18% |
| Wage / Income Gap ($) | 75 | 26.82¢ per $1 |
| Gini / Inequality Index | 75 | 0.50 |
Earnings by Sex in Picuris Pueblo
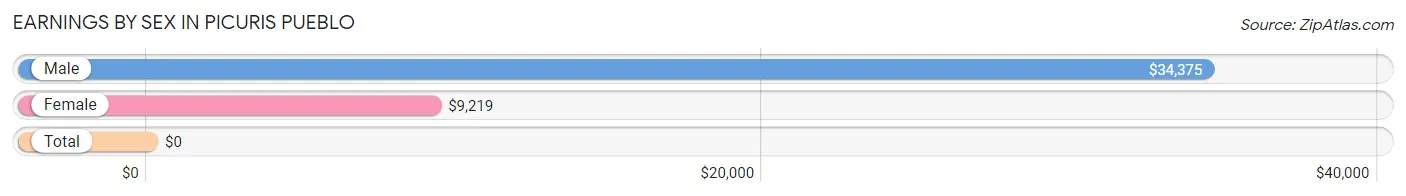
| Sex | Number | Average Earnings |
| Male | 17 (53.1%) | $34,375 |
| Female | 15 (46.9%) | $9,219 |
| Total | 32 (100.0%) | $0 |
Earnings by Sex by Income Bracket in Picuris Pueblo
The most common earnings brackets in Picuris Pueblo are $30,000 to $34,999 for men (6 | 35.3%) and $7,500 to $9,999 for women (8 | 53.3%).
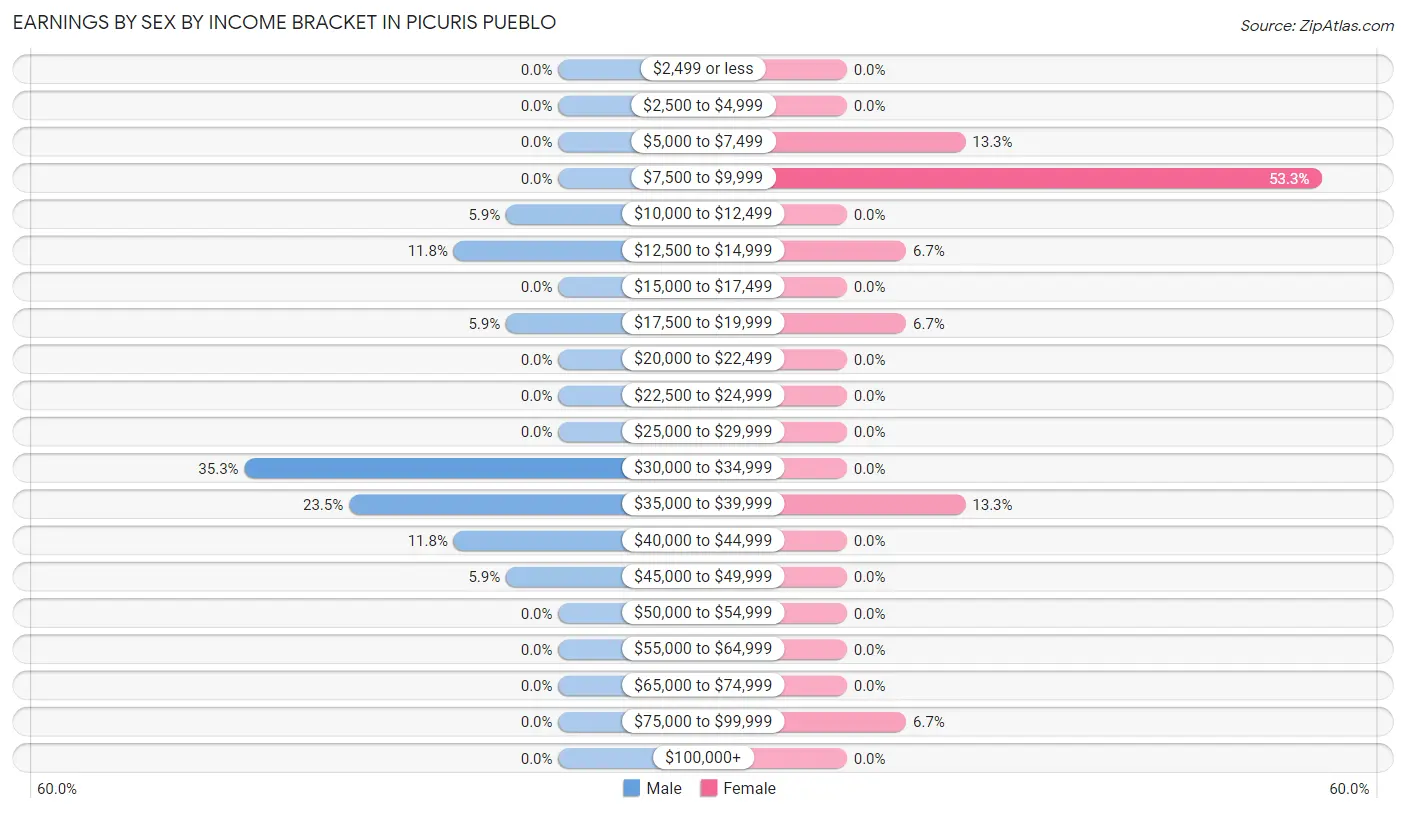
| Income | Male | Female |
| $2,499 or less | 0 (0.0%) | 0 (0.0%) |
| $2,500 to $4,999 | 0 (0.0%) | 0 (0.0%) |
| $5,000 to $7,499 | 0 (0.0%) | 2 (13.3%) |
| $7,500 to $9,999 | 0 (0.0%) | 8 (53.3%) |
| $10,000 to $12,499 | 1 (5.9%) | 0 (0.0%) |
| $12,500 to $14,999 | 2 (11.8%) | 1 (6.7%) |
| $15,000 to $17,499 | 0 (0.0%) | 0 (0.0%) |
| $17,500 to $19,999 | 1 (5.9%) | 1 (6.7%) |
| $20,000 to $22,499 | 0 (0.0%) | 0 (0.0%) |
| $22,500 to $24,999 | 0 (0.0%) | 0 (0.0%) |
| $25,000 to $29,999 | 0 (0.0%) | 0 (0.0%) |
| $30,000 to $34,999 | 6 (35.3%) | 0 (0.0%) |
| $35,000 to $39,999 | 4 (23.5%) | 2 (13.3%) |
| $40,000 to $44,999 | 2 (11.8%) | 0 (0.0%) |
| $45,000 to $49,999 | 1 (5.9%) | 0 (0.0%) |
| $50,000 to $54,999 | 0 (0.0%) | 0 (0.0%) |
| $55,000 to $64,999 | 0 (0.0%) | 0 (0.0%) |
| $65,000 to $74,999 | 0 (0.0%) | 0 (0.0%) |
| $75,000 to $99,999 | 0 (0.0%) | 1 (6.7%) |
| $100,000+ | 0 (0.0%) | 0 (0.0%) |
| Total | 17 (100.0%) | 15 (100.0%) |
Earnings by Sex by Educational Attainment in Picuris Pueblo
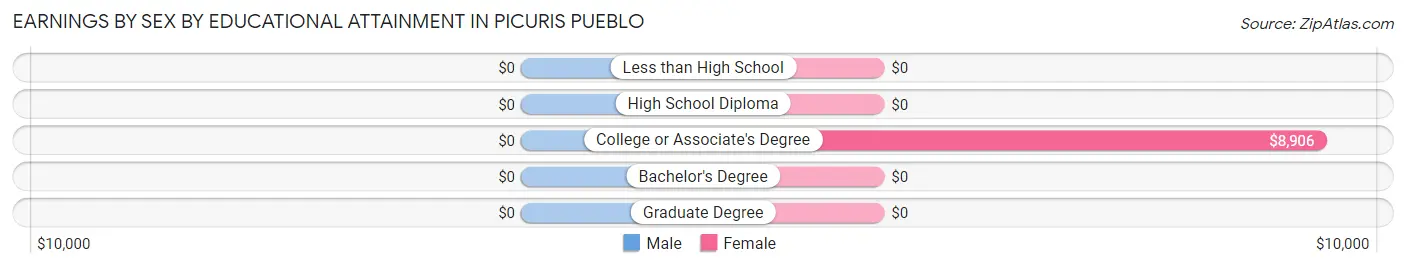
| Educational Attainment | Male Income | Female Income |
| Less than High School | - | - |
| High School Diploma | - | - |
| College or Associate's Degree | - | - |
| Bachelor's Degree | - | - |
| Graduate Degree | - | - |
| Total | $34,583 | $9,219 |
Family Income in Picuris Pueblo
Family Income Brackets in Picuris Pueblo
According to the Picuris Pueblo family income data, there are 3 families falling into the $50,000 to $74,999 income range, which is the most common income bracket and makes up 27.3% of all families.
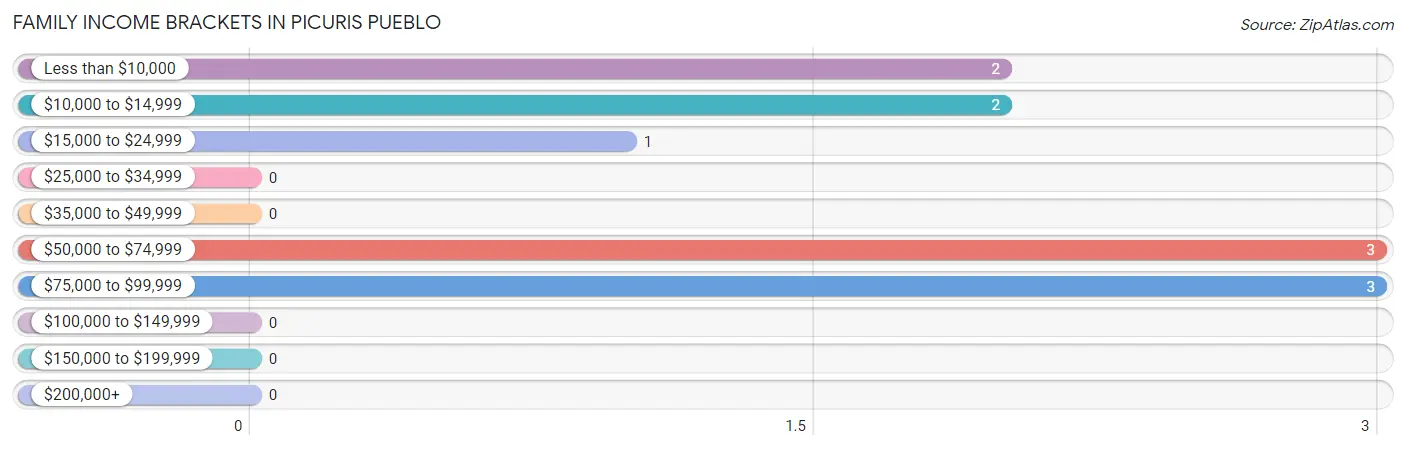
| Income Bracket | # Families | % Families |
| Less than $10,000 | 2 | 18.2% |
| $10,000 to $14,999 | 2 | 18.2% |
| $15,000 to $24,999 | 1 | 9.1% |
| $25,000 to $34,999 | 0 | 0.0% |
| $35,000 to $49,999 | 0 | 0.0% |
| $50,000 to $74,999 | 3 | 27.3% |
| $75,000 to $99,999 | 3 | 27.3% |
| $100,000 to $149,999 | 0 | 0.0% |
| $150,000 to $199,999 | 0 | 0.0% |
| $200,000+ | 0 | 0.0% |
Family Income by Famaliy Size in Picuris Pueblo
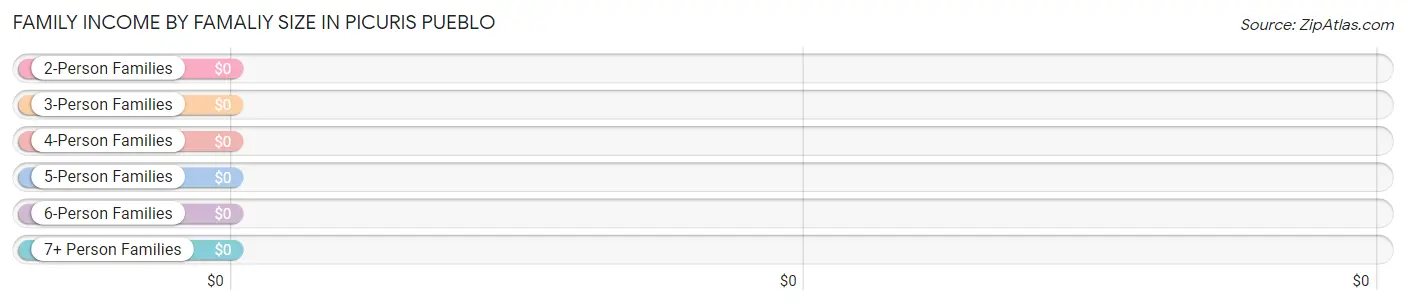
| Income Bracket | # Families | Median Income |
| 2-Person Families | 5 (45.5%) | $0 |
| 3-Person Families | 5 (45.5%) | $0 |
| 4-Person Families | 1 (9.1%) | $0 |
| 5-Person Families | 0 (0.0%) | $0 |
| 6-Person Families | 0 (0.0%) | $0 |
| 7+ Person Families | 0 (0.0%) | $0 |
| Total | 11 (100.0%) | $0 |
Family Income by Number of Earners in Picuris Pueblo
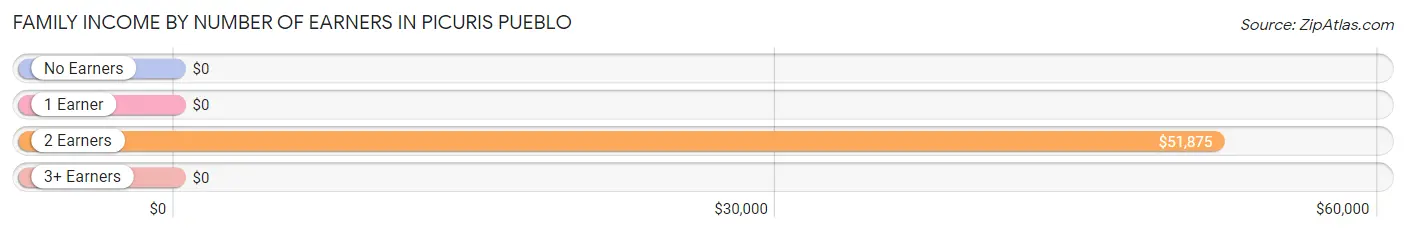
| Number of Earners | # Families | Median Income |
| No Earners | 4 (36.4%) | $0 |
| 1 Earner | 3 (27.3%) | $0 |
| 2 Earners | 3 (27.3%) | $51,875 |
| 3+ Earners | 1 (9.1%) | $0 |
| Total | 11 (100.0%) | $0 |
Household Income in Picuris Pueblo
Household Income Brackets in Picuris Pueblo
With 6 households falling in the category, the $10,000 to $14,999 income range is the most frequent in Picuris Pueblo, accounting for 26.1% of all households.
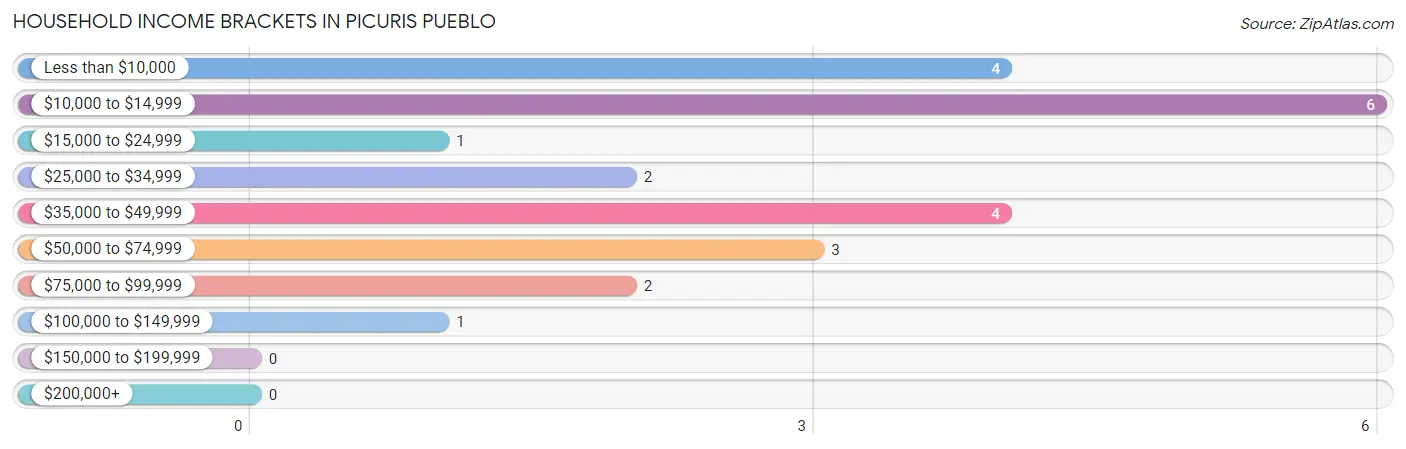
| Income Bracket | # Households | % Households |
| Less than $10,000 | 4 | 17.4% |
| $10,000 to $14,999 | 6 | 26.1% |
| $15,000 to $24,999 | 1 | 4.3% |
| $25,000 to $34,999 | 2 | 8.7% |
| $35,000 to $49,999 | 4 | 17.4% |
| $50,000 to $74,999 | 3 | 13.0% |
| $75,000 to $99,999 | 2 | 8.7% |
| $100,000 to $149,999 | 1 | 4.3% |
| $150,000 to $199,999 | 0 | 0.0% |
| $200,000+ | 0 | 0.0% |
Household Income by Householder Age in Picuris Pueblo
The median household income in Picuris Pueblo is $28,125, with the highest median household income of $60,000 found in the 25 to 44 years age bracket for the primary householder. A total of 4 households (17.4%) fall into this category.
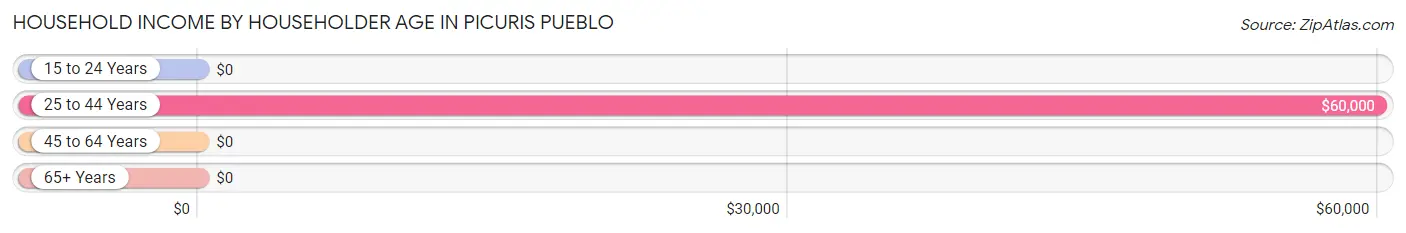
| Income Bracket | # Households | Median Income |
| 15 to 24 Years | 0 (0.0%) | $0 |
| 25 to 44 Years | 4 (17.4%) | $60,000 |
| 45 to 64 Years | 12 (52.2%) | $0 |
| 65+ Years | 7 (30.4%) | $0 |
| Total | 23 (100.0%) | $28,125 |
Poverty in Picuris Pueblo
Income Below Poverty by Sex and Age in Picuris Pueblo
With 38.7% poverty level for males and 9.1% for females among the residents of Picuris Pueblo, 6 to 11 year old males and 25 to 34 year old females are the most vulnerable to poverty, with 1 males (100.0%) and 2 females (66.7%) in their respective age groups living below the poverty level.
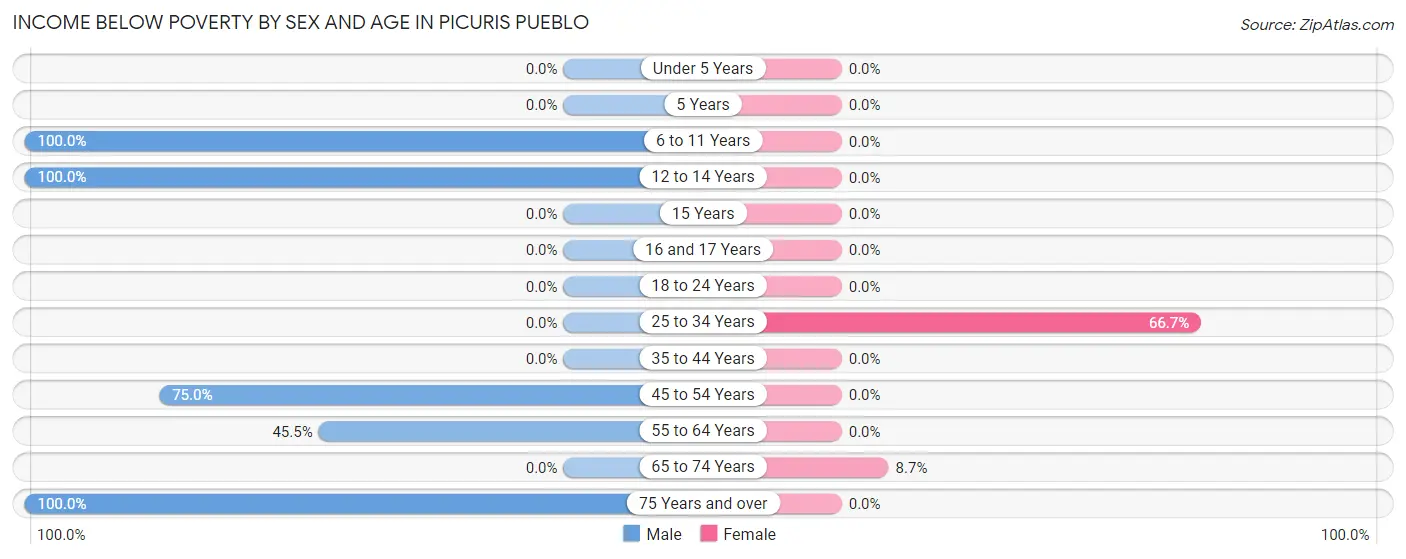
| Age Bracket | Male | Female |
| Under 5 Years | 0 (0.0%) | 0 (0.0%) |
| 5 Years | 0 (0.0%) | 0 (0.0%) |
| 6 to 11 Years | 1 (100.0%) | 0 (0.0%) |
| 12 to 14 Years | 1 (100.0%) | 0 (0.0%) |
| 15 Years | 0 (0.0%) | 0 (0.0%) |
| 16 and 17 Years | 0 (0.0%) | 0 (0.0%) |
| 18 to 24 Years | 0 (0.0%) | 0 (0.0%) |
| 25 to 34 Years | 0 (0.0%) | 2 (66.7%) |
| 35 to 44 Years | 0 (0.0%) | 0 (0.0%) |
| 45 to 54 Years | 3 (75.0%) | 0 (0.0%) |
| 55 to 64 Years | 5 (45.5%) | 0 (0.0%) |
| 65 to 74 Years | 0 (0.0%) | 2 (8.7%) |
| 75 Years and over | 2 (100.0%) | 0 (0.0%) |
| Total | 12 (38.7%) | 4 (9.1%) |
Income Above Poverty by Sex and Age in Picuris Pueblo
According to the poverty statistics in Picuris Pueblo, males aged 15 years and females aged 16 and 17 years are the age groups that are most secure financially, with 100.0% of males and 100.0% of females in these age groups living above the poverty line.
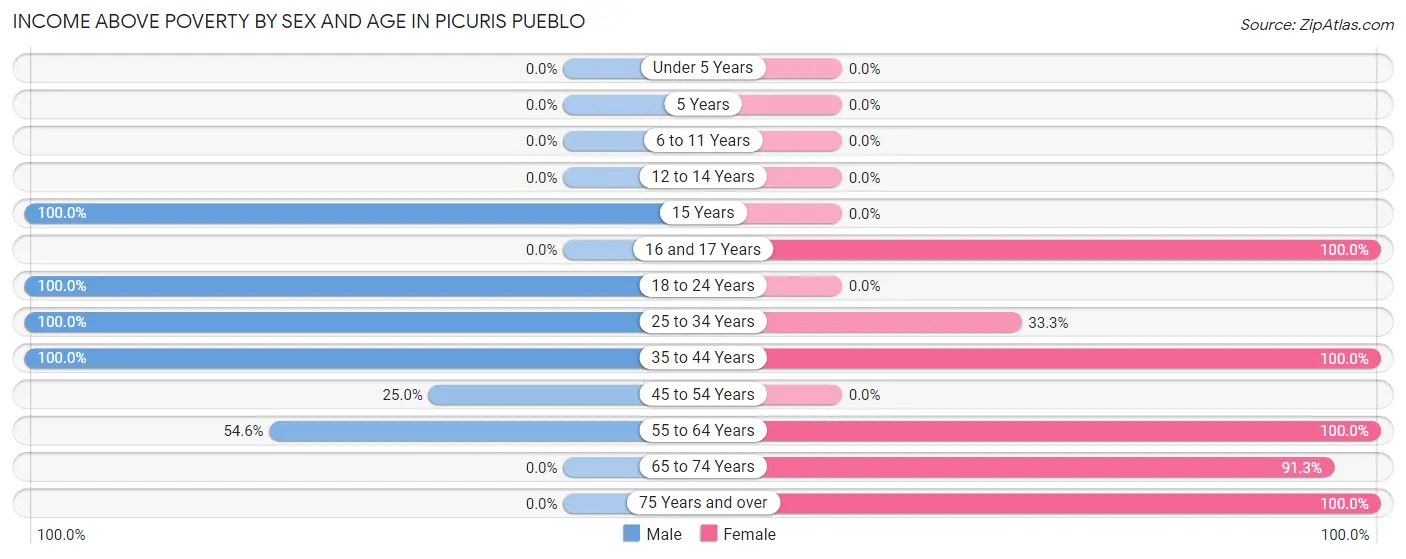
| Age Bracket | Male | Female |
| Under 5 Years | 0 (0.0%) | 0 (0.0%) |
| 5 Years | 0 (0.0%) | 0 (0.0%) |
| 6 to 11 Years | 0 (0.0%) | 0 (0.0%) |
| 12 to 14 Years | 0 (0.0%) | 0 (0.0%) |
| 15 Years | 2 (100.0%) | 0 (0.0%) |
| 16 and 17 Years | 0 (0.0%) | 1 (100.0%) |
| 18 to 24 Years | 1 (100.0%) | 0 (0.0%) |
| 25 to 34 Years | 1 (100.0%) | 1 (33.3%) |
| 35 to 44 Years | 8 (100.0%) | 9 (100.0%) |
| 45 to 54 Years | 1 (25.0%) | 0 (0.0%) |
| 55 to 64 Years | 6 (54.5%) | 3 (100.0%) |
| 65 to 74 Years | 0 (0.0%) | 21 (91.3%) |
| 75 Years and over | 0 (0.0%) | 5 (100.0%) |
| Total | 19 (61.3%) | 40 (90.9%) |
Income Below Poverty Among Married-Couple Families in Picuris Pueblo
The poverty statistics for married-couple families in Picuris Pueblo show that 66.7% or 2 of the total 3 families live below the poverty line. Families with no children have the highest poverty rate of 66.7%, comprising of 2 families. On the other hand, families with no children have the lowest poverty rate of 66.7%, which includes 2 families.
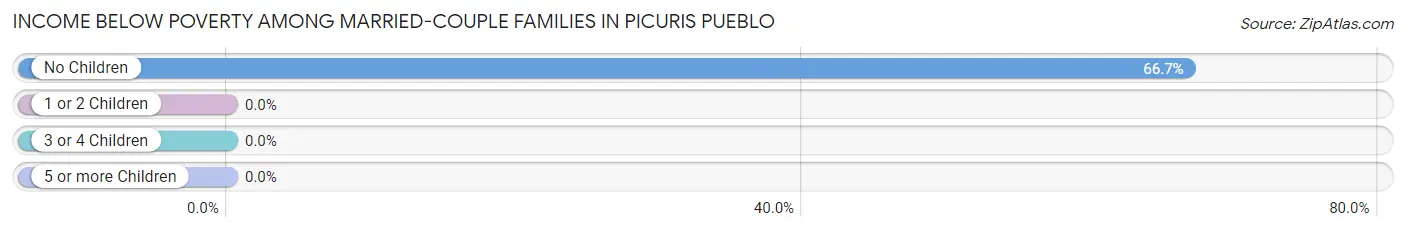
| Children | Above Poverty | Below Poverty |
| No Children | 1 (33.3%) | 2 (66.7%) |
| 1 or 2 Children | 0 (0.0%) | 0 (0.0%) |
| 3 or 4 Children | 0 (0.0%) | 0 (0.0%) |
| 5 or more Children | 0 (0.0%) | 0 (0.0%) |
| Total | 1 (33.3%) | 2 (66.7%) |
Income Below Poverty Among Single-Parent Households in Picuris Pueblo
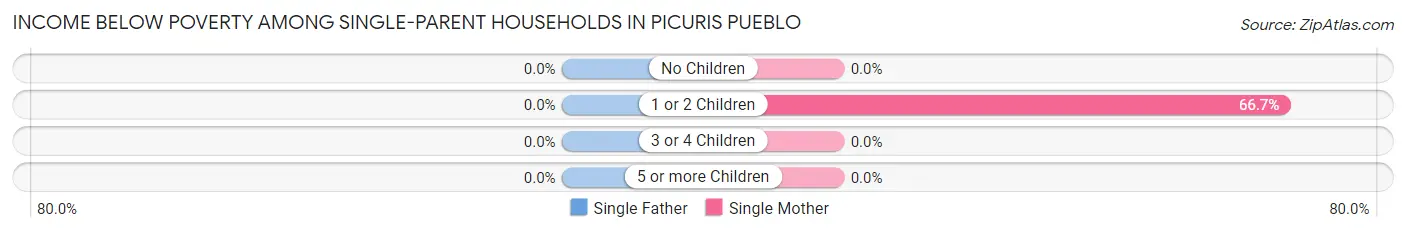
| Children | Single Father | Single Mother |
| No Children | 0 (0.0%) | 0 (0.0%) |
| 1 or 2 Children | 0 (0.0%) | 2 (66.7%) |
| 3 or 4 Children | 0 (0.0%) | 0 (0.0%) |
| 5 or more Children | 0 (0.0%) | 0 (0.0%) |
| Total | 0 (0.0%) | 2 (33.3%) |
Income Below Poverty Among Married-Couple vs Single-Parent Households in Picuris Pueblo
The poverty data for Picuris Pueblo shows that 2 of the married-couple family households (66.7%) and 2 of the single-parent households (25.0%) are living below the poverty level. Within the married-couple family households, those with no children have the highest poverty rate, with 2 households (66.7%) falling below the poverty line. Among the single-parent households, those with 1 or 2 children have the highest poverty rate, with 2 household (66.7%) living below poverty.
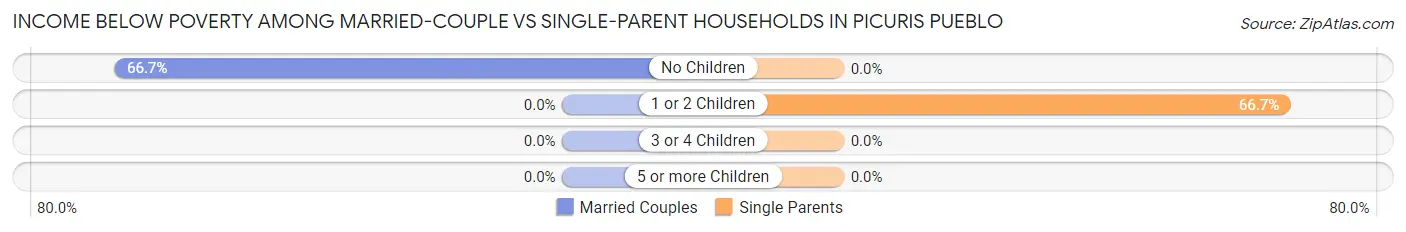
| Children | Married-Couple Families | Single-Parent Households |
| No Children | 2 (66.7%) | 0 (0.0%) |
| 1 or 2 Children | 0 (0.0%) | 2 (66.7%) |
| 3 or 4 Children | 0 (0.0%) | 0 (0.0%) |
| 5 or more Children | 0 (0.0%) | 0 (0.0%) |
| Total | 2 (66.7%) | 2 (25.0%) |
Employment Characteristics in Picuris Pueblo
Employment by Class of Employer in Picuris Pueblo
Among the 31 employed individuals in Picuris Pueblo, local government employees (29 | 93.5%), and private company employees (2 | 6.5%) make up the most common classes of employment.
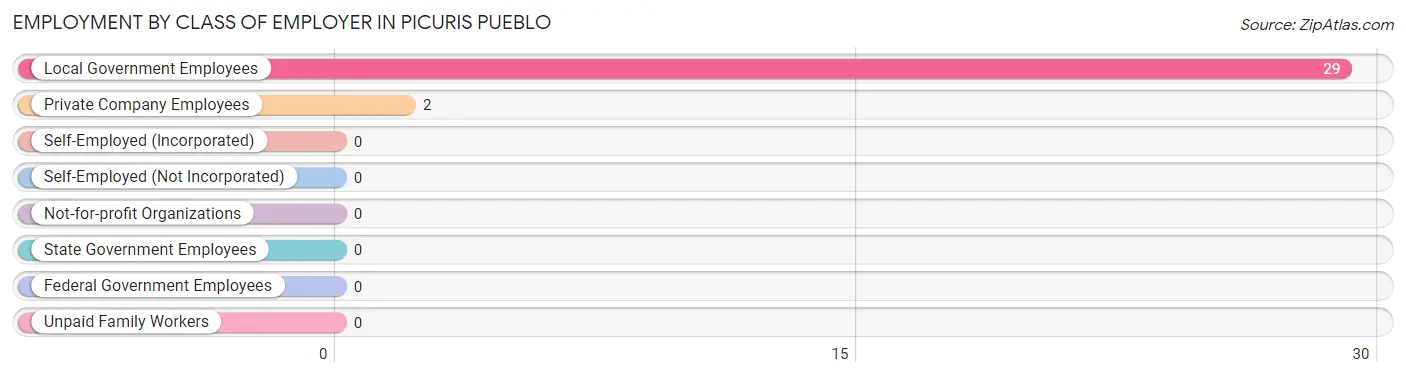
| Employer Class | # Employees | % Employees |
| Private Company Employees | 2 | 6.5% |
| Self-Employed (Incorporated) | 0 | 0.0% |
| Self-Employed (Not Incorporated) | 0 | 0.0% |
| Not-for-profit Organizations | 0 | 0.0% |
| Local Government Employees | 29 | 93.5% |
| State Government Employees | 0 | 0.0% |
| Federal Government Employees | 0 | 0.0% |
| Unpaid Family Workers | 0 | 0.0% |
| Total | 31 | 100.0% |
Employment Status by Age in Picuris Pueblo
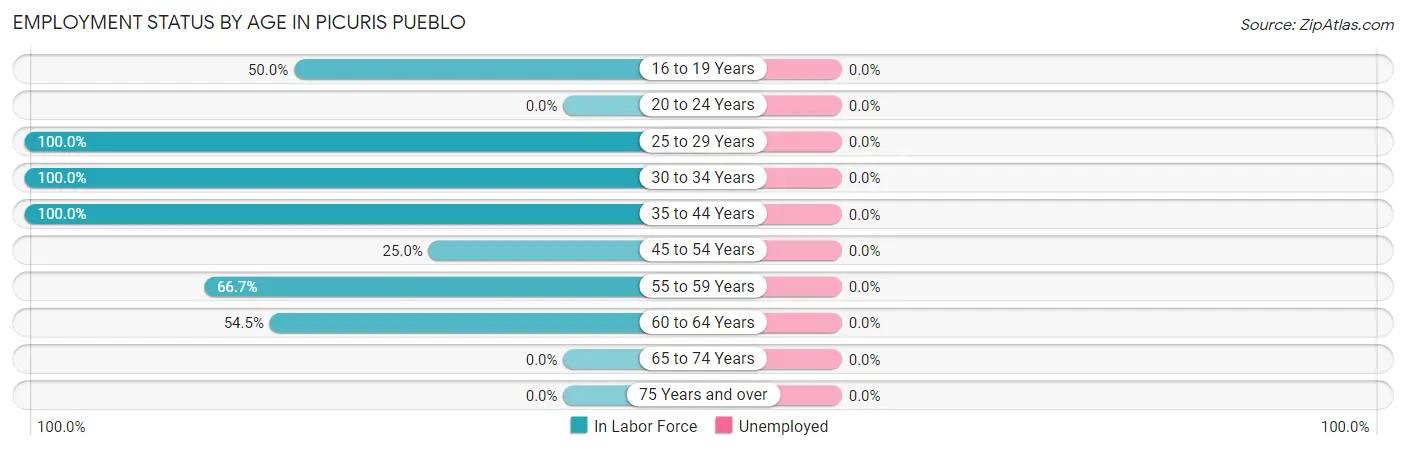
| Age Bracket | In Labor Force | Unemployed |
| 16 to 19 Years | 1 (50.0%) | 0 (0.0%) |
| 20 to 24 Years | 0 (0.0%) | 0 (0.0%) |
| 25 to 29 Years | 1 (100.0%) | 0 (0.0%) |
| 30 to 34 Years | 3 (100.0%) | 0 (0.0%) |
| 35 to 44 Years | 17 (100.0%) | 0 (0.0%) |
| 45 to 54 Years | 1 (25.0%) | 0 (0.0%) |
| 55 to 59 Years | 2 (66.7%) | 0 (0.0%) |
| 60 to 64 Years | 6 (54.5%) | 0 (0.0%) |
| 65 to 74 Years | 0 (0.0%) | 0 (0.0%) |
| 75 Years and over | 0 (0.0%) | 0 (0.0%) |
| Total | 31 (43.7%) | 0 (0.0%) |
Employment Status by Educational Attainment in Picuris Pueblo
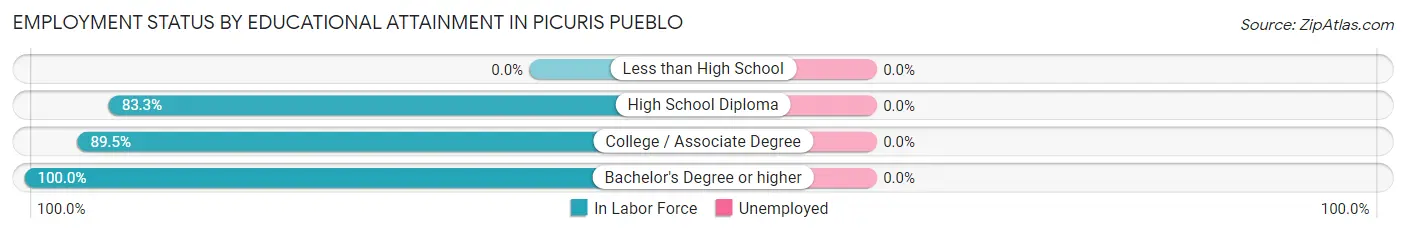
| Educational Attainment | In Labor Force | Unemployed |
| Less than High School | 0 (0.0%) | 0 (0.0%) |
| High School Diploma | 10 (83.3%) | 0 (0.0%) |
| College / Associate Degree | 17 (89.5%) | 0 (0.0%) |
| Bachelor's Degree or higher | 3 (100.0%) | 0 (0.0%) |
| Total | 30 (76.9%) | 0 (0.0%) |
Employment Occupations by Sex in Picuris Pueblo
Management, Business, Science and Arts Occupations
The most common Management, Business, Science and Arts occupations in Picuris Pueblo are Management (3 | 9.7%), and Business & Financial (1 | 3.2%).
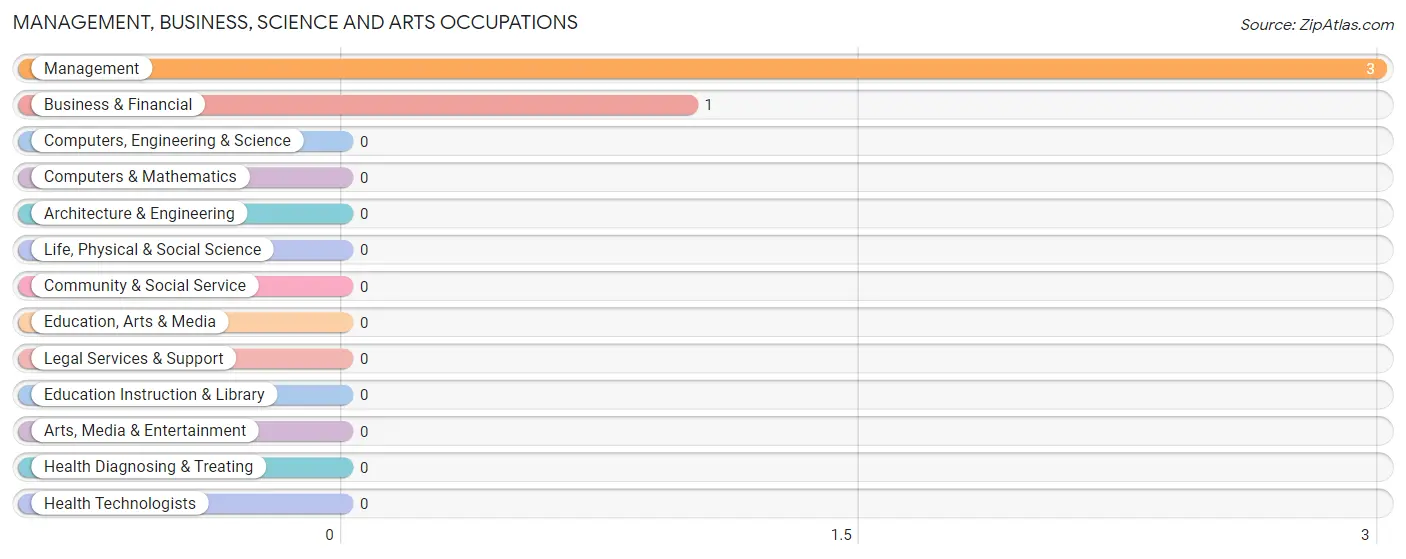
Management, Business, Science and Arts Occupations by Sex
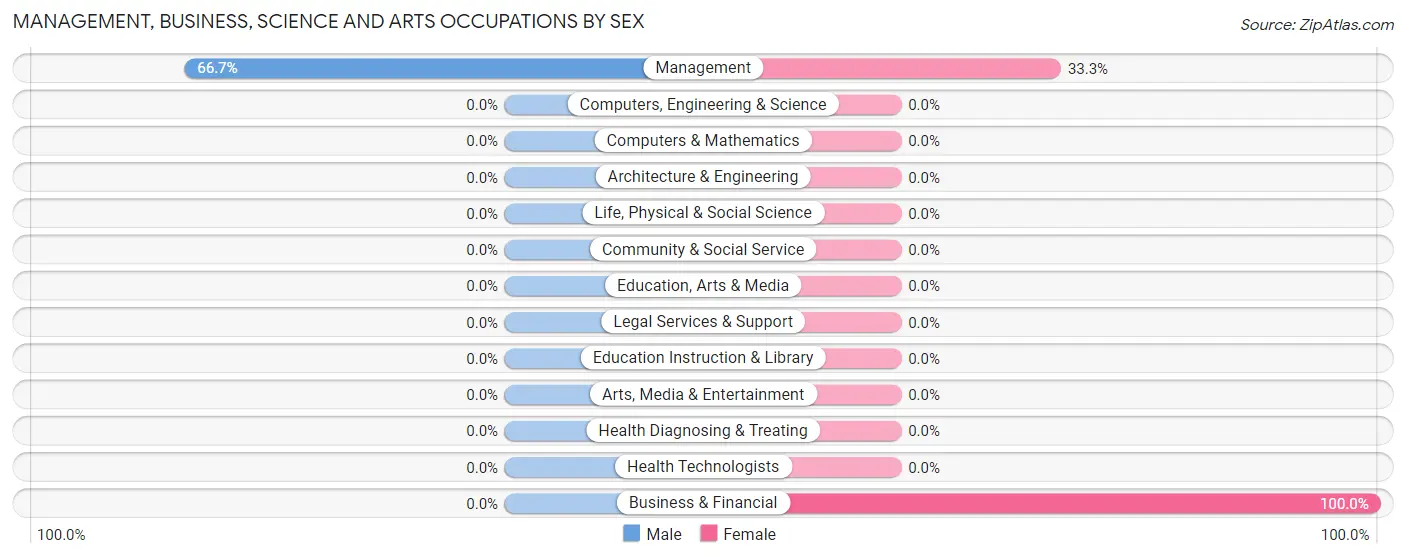
| Occupation | Male | Female |
| Management | 2 (66.7%) | 1 (33.3%) |
| Business & Financial | 0 (0.0%) | 1 (100.0%) |
| Computers, Engineering & Science | 0 (0.0%) | 0 (0.0%) |
| Computers & Mathematics | 0 (0.0%) | 0 (0.0%) |
| Architecture & Engineering | 0 (0.0%) | 0 (0.0%) |
| Life, Physical & Social Science | 0 (0.0%) | 0 (0.0%) |
| Community & Social Service | 0 (0.0%) | 0 (0.0%) |
| Education, Arts & Media | 0 (0.0%) | 0 (0.0%) |
| Legal Services & Support | 0 (0.0%) | 0 (0.0%) |
| Education Instruction & Library | 0 (0.0%) | 0 (0.0%) |
| Arts, Media & Entertainment | 0 (0.0%) | 0 (0.0%) |
| Health Diagnosing & Treating | 0 (0.0%) | 0 (0.0%) |
| Health Technologists | 0 (0.0%) | 0 (0.0%) |
| Total (Category) | 2 (50.0%) | 2 (50.0%) |
| Total (Overall) | 16 (51.6%) | 15 (48.4%) |
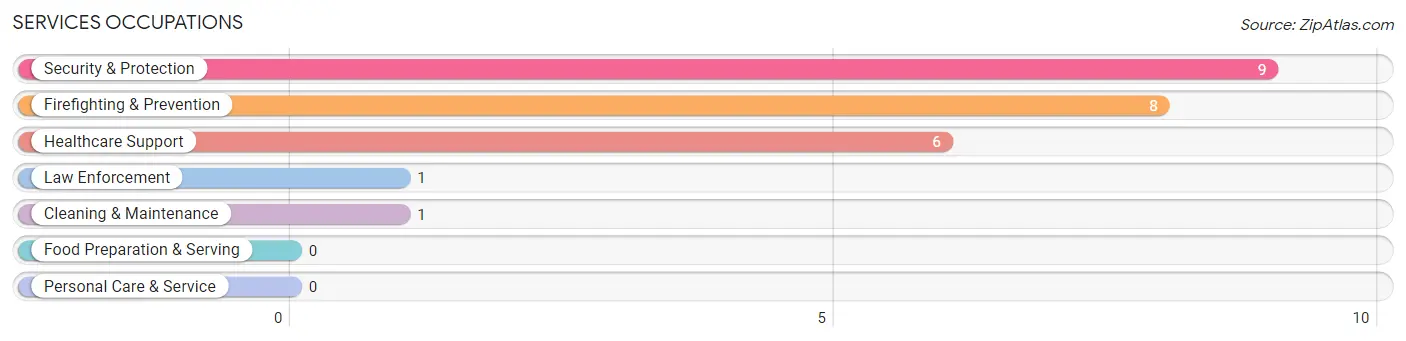
Services Occupations
The most common Services occupations in Picuris Pueblo are Security & Protection (9 | 29.0%), Firefighting & Prevention (8 | 25.8%), Healthcare Support (6 | 19.4%), Law Enforcement (1 | 3.2%), and Cleaning & Maintenance (1 | 3.2%).
Services Occupations by Sex
Within the Services occupations in Picuris Pueblo, the most male-oriented occupations are Healthcare Support (100.0%), Law Enforcement (100.0%), and Cleaning & Maintenance (100.0%), while the most female-oriented occupations are Firefighting & Prevention (100.0%), and Security & Protection (88.9%).
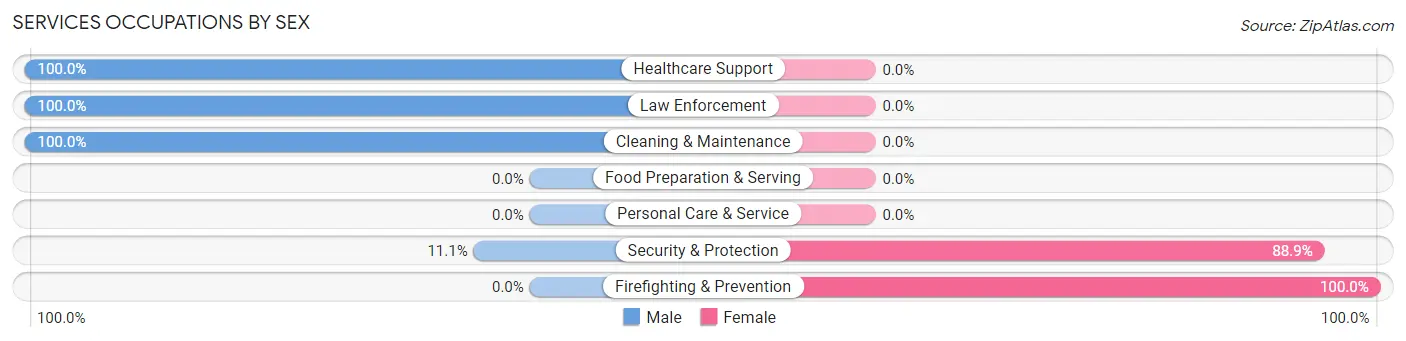
| Occupation | Male | Female |
| Healthcare Support | 6 (100.0%) | 0 (0.0%) |
| Security & Protection | 1 (11.1%) | 8 (88.9%) |
| Firefighting & Prevention | 0 (0.0%) | 8 (100.0%) |
| Law Enforcement | 1 (100.0%) | 0 (0.0%) |
| Food Preparation & Serving | 0 (0.0%) | 0 (0.0%) |
| Cleaning & Maintenance | 1 (100.0%) | 0 (0.0%) |
| Personal Care & Service | 0 (0.0%) | 0 (0.0%) |
| Total (Category) | 8 (50.0%) | 8 (50.0%) |
| Total (Overall) | 16 (51.6%) | 15 (48.4%) |
Sales and Office Occupations
The most common Sales and Office occupations in Picuris Pueblo are , and Office & Administration (5 | 16.1%).
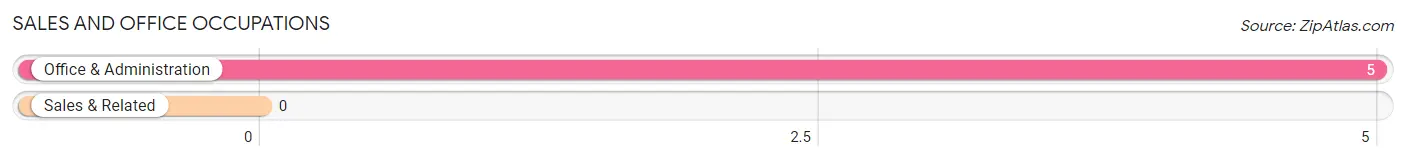
Sales and Office Occupations by Sex

| Occupation | Male | Female |
| Sales & Related | 0 (0.0%) | 0 (0.0%) |
| Office & Administration | 0 (0.0%) | 5 (100.0%) |
| Total (Category) | 0 (0.0%) | 5 (100.0%) |
| Total (Overall) | 16 (51.6%) | 15 (48.4%) |
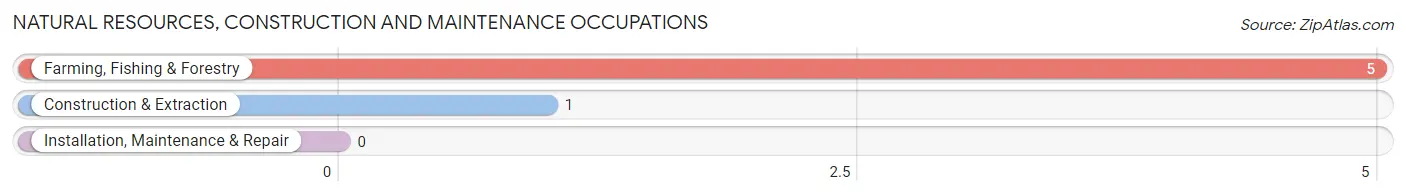
Natural Resources, Construction and Maintenance Occupations
The most common Natural Resources, Construction and Maintenance occupations in Picuris Pueblo are Farming, Fishing & Forestry (5 | 16.1%), and Construction & Extraction (1 | 3.2%).
Natural Resources, Construction and Maintenance Occupations by Sex
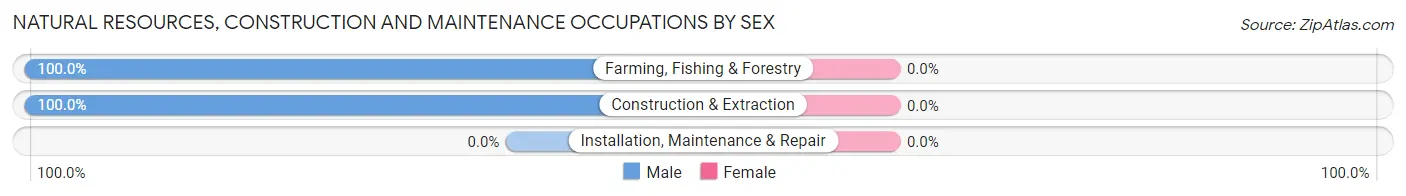
| Occupation | Male | Female |
| Farming, Fishing & Forestry | 5 (100.0%) | 0 (0.0%) |
| Construction & Extraction | 1 (100.0%) | 0 (0.0%) |
| Installation, Maintenance & Repair | 0 (0.0%) | 0 (0.0%) |
| Total (Category) | 6 (100.0%) | 0 (0.0%) |
| Total (Overall) | 16 (51.6%) | 15 (48.4%) |
Production, Transportation and Moving Occupations
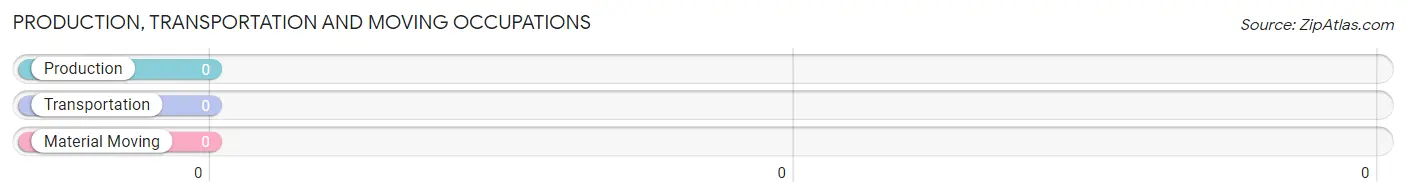
Production, Transportation and Moving Occupations by Sex
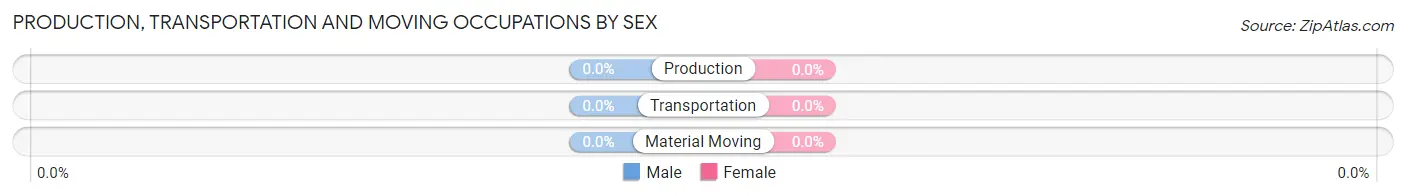
| Occupation | Male | Female |
| Production | 0 (0.0%) | 0 (0.0%) |
| Transportation | 0 (0.0%) | 0 (0.0%) |
| Material Moving | 0 (0.0%) | 0 (0.0%) |
| Total (Category) | 0 (0.0%) | 0 (0.0%) |
| Total (Overall) | 16 (51.6%) | 15 (48.4%) |
Employment Industries by Sex in Picuris Pueblo
Employment Industries in Picuris Pueblo
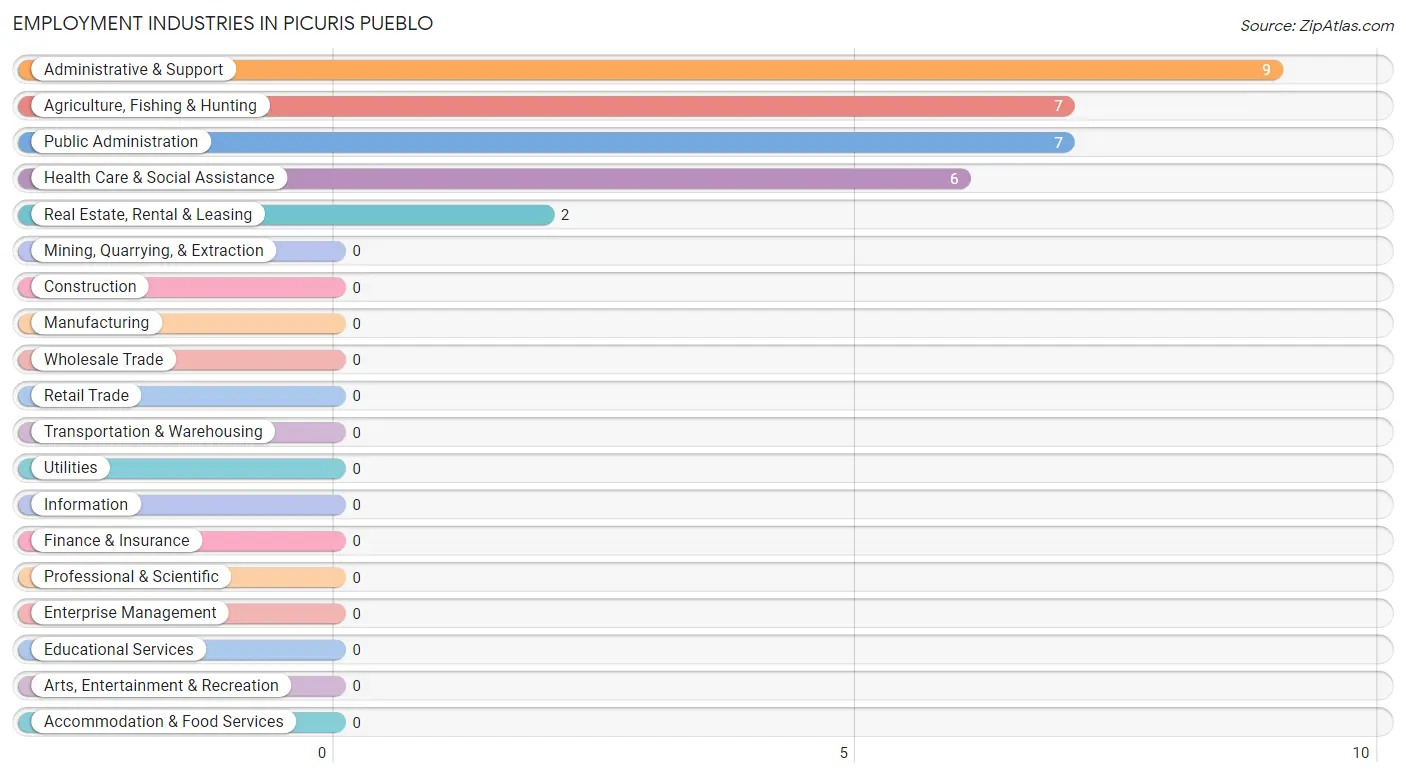
The major employment industries in Picuris Pueblo include Administrative & Support (9 | 29.0%), Agriculture, Fishing & Hunting (7 | 22.6%), Public Administration (7 | 22.6%), Health Care & Social Assistance (6 | 19.4%), and Real Estate, Rental & Leasing (2 | 6.5%).
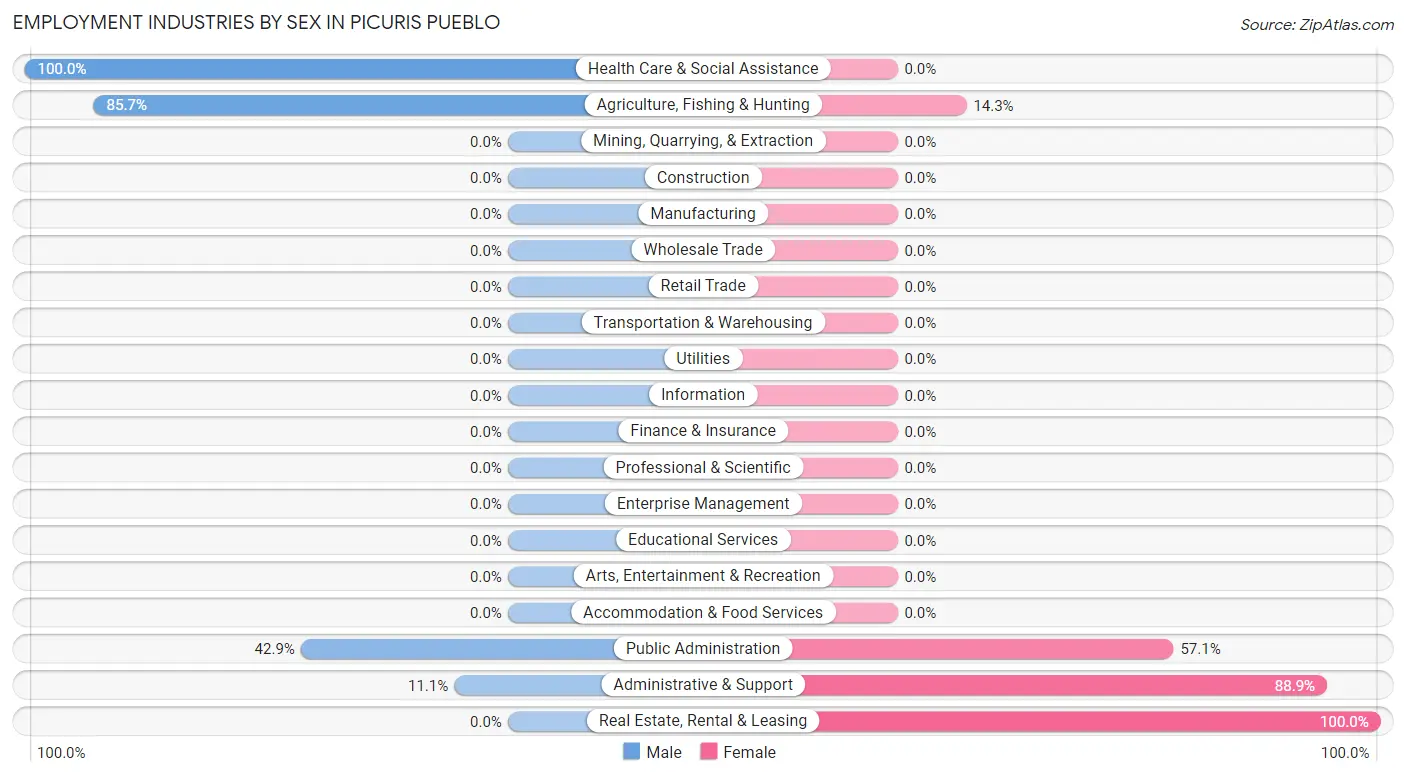
Employment Industries by Sex in Picuris Pueblo
The Picuris Pueblo industries that see more men than women are Health Care & Social Assistance (100.0%), Agriculture, Fishing & Hunting (85.7%), and Public Administration (42.9%), whereas the industries that tend to have a higher number of women are Real Estate, Rental & Leasing (100.0%), Administrative & Support (88.9%), and Public Administration (57.1%).
| Industry | Male | Female |
| Agriculture, Fishing & Hunting | 6 (85.7%) | 1 (14.3%) |
| Mining, Quarrying, & Extraction | 0 (0.0%) | 0 (0.0%) |
| Construction | 0 (0.0%) | 0 (0.0%) |
| Manufacturing | 0 (0.0%) | 0 (0.0%) |
| Wholesale Trade | 0 (0.0%) | 0 (0.0%) |
| Retail Trade | 0 (0.0%) | 0 (0.0%) |
| Transportation & Warehousing | 0 (0.0%) | 0 (0.0%) |
| Utilities | 0 (0.0%) | 0 (0.0%) |
| Information | 0 (0.0%) | 0 (0.0%) |
| Finance & Insurance | 0 (0.0%) | 0 (0.0%) |
| Real Estate, Rental & Leasing | 0 (0.0%) | 2 (100.0%) |
| Professional & Scientific | 0 (0.0%) | 0 (0.0%) |
| Enterprise Management | 0 (0.0%) | 0 (0.0%) |
| Administrative & Support | 1 (11.1%) | 8 (88.9%) |
| Educational Services | 0 (0.0%) | 0 (0.0%) |
| Health Care & Social Assistance | 6 (100.0%) | 0 (0.0%) |
| Arts, Entertainment & Recreation | 0 (0.0%) | 0 (0.0%) |
| Accommodation & Food Services | 0 (0.0%) | 0 (0.0%) |
| Public Administration | 3 (42.9%) | 4 (57.1%) |
| Total | 16 (51.6%) | 15 (48.4%) |
Education in Picuris Pueblo
School Enrollment in Picuris Pueblo
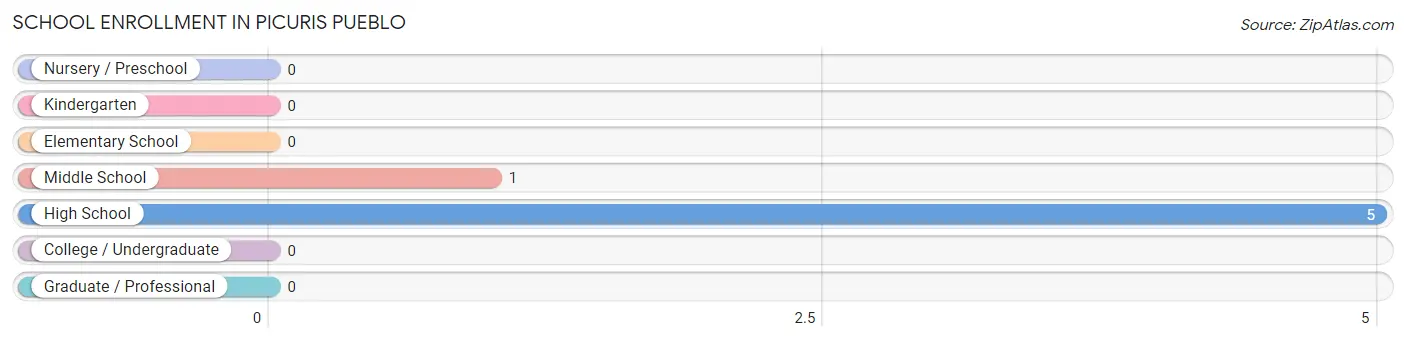
The most common levels of schooling among the 6 students in Picuris Pueblo are high school (5 | 83.3%), and middle school (1 | 16.7%).
| School Level | # Students | % Students |
| Nursery / Preschool | 0 | 0.0% |
| Kindergarten | 0 | 0.0% |
| Elementary School | 0 | 0.0% |
| Middle School | 1 | 16.7% |
| High School | 5 | 83.3% |
| College / Undergraduate | 0 | 0.0% |
| Graduate / Professional | 0 | 0.0% |
| Total | 6 | 100.0% |
School Enrollment by Age by Funding Source in Picuris Pueblo
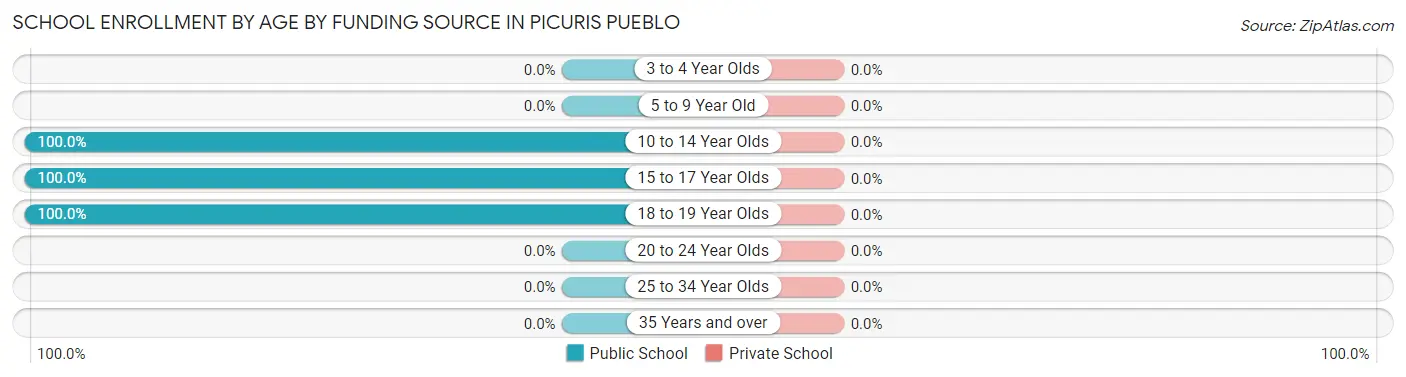
| Age Bracket | Public School | Private School |
| 3 to 4 Year Olds | 0 (0.0%) | 0 (0.0%) |
| 5 to 9 Year Old | 0 (0.0%) | 0 (0.0%) |
| 10 to 14 Year Olds | 2 (100.0%) | 0 (0.0%) |
| 15 to 17 Year Olds | 3 (100.0%) | 0 (0.0%) |
| 18 to 19 Year Olds | 1 (100.0%) | 0 (0.0%) |
| 20 to 24 Year Olds | 0 (0.0%) | 0 (0.0%) |
| 25 to 34 Year Olds | 0 (0.0%) | 0 (0.0%) |
| 35 Years and over | 0 (0.0%) | 0 (0.0%) |
| Total | 6 (100.0%) | 0 (0.0%) |
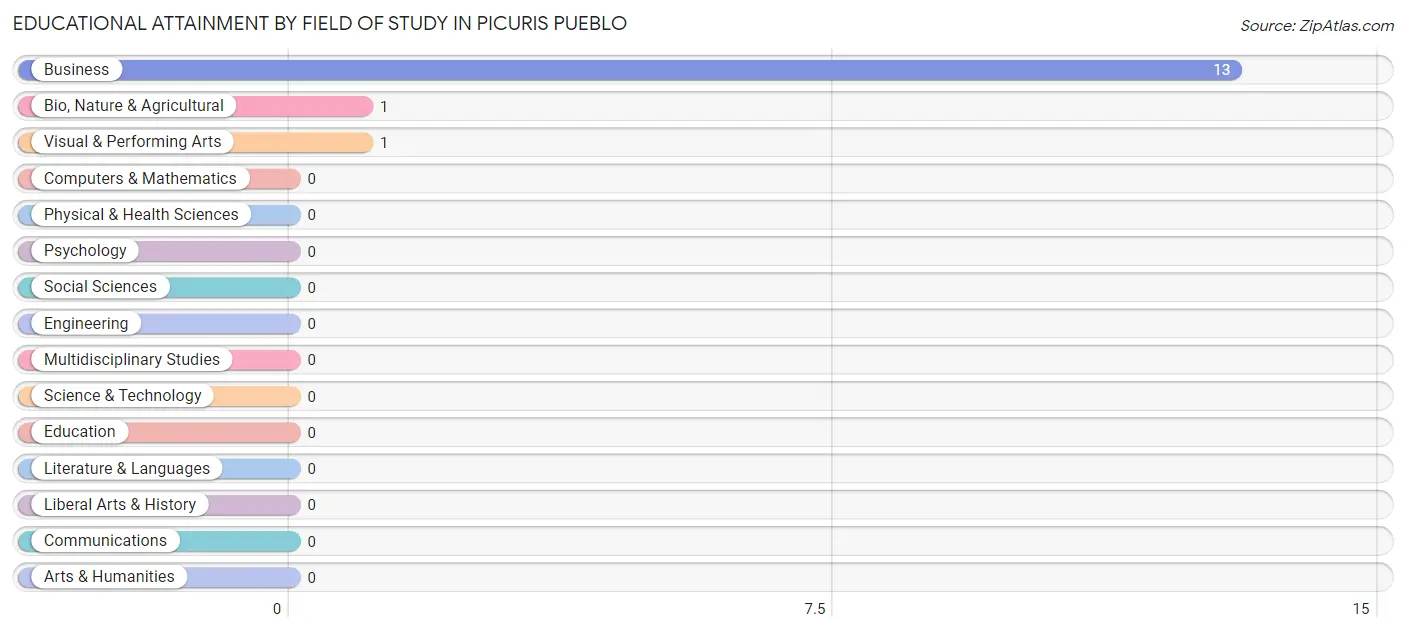
Educational Attainment by Field of Study in Picuris Pueblo
Business (13 | 86.7%), bio, nature & agricultural (1 | 6.7%), and visual & performing arts (1 | 6.7%) are the most common fields of study among 15 individuals in Picuris Pueblo who have obtained a bachelor's degree or higher.
| Field of Study | # Graduates | % Graduates |
| Computers & Mathematics | 0 | 0.0% |
| Bio, Nature & Agricultural | 1 | 6.7% |
| Physical & Health Sciences | 0 | 0.0% |
| Psychology | 0 | 0.0% |
| Social Sciences | 0 | 0.0% |
| Engineering | 0 | 0.0% |
| Multidisciplinary Studies | 0 | 0.0% |
| Science & Technology | 0 | 0.0% |
| Business | 13 | 86.7% |
| Education | 0 | 0.0% |
| Literature & Languages | 0 | 0.0% |
| Liberal Arts & History | 0 | 0.0% |
| Visual & Performing Arts | 1 | 6.7% |
| Communications | 0 | 0.0% |
| Arts & Humanities | 0 | 0.0% |
| Total | 15 | 100.0% |
Transportation & Commute in Picuris Pueblo
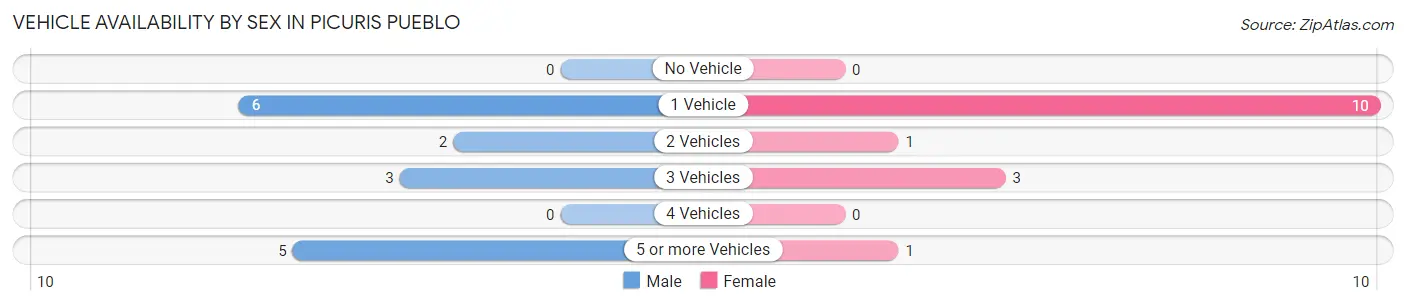
Vehicle Availability by Sex in Picuris Pueblo
The most prevalent vehicle ownership categories in Picuris Pueblo are males with 1 vehicle (6, accounting for 37.5%) and females with 1 vehicle (10, making up 40.0%).
| Vehicles Available | Male | Female |
| No Vehicle | 0 (0.0%) | 0 (0.0%) |
| 1 Vehicle | 6 (37.5%) | 10 (66.7%) |
| 2 Vehicles | 2 (12.5%) | 1 (6.7%) |
| 3 Vehicles | 3 (18.8%) | 3 (20.0%) |
| 4 Vehicles | 0 (0.0%) | 0 (0.0%) |
| 5 or more Vehicles | 5 (31.2%) | 1 (6.7%) |
| Total | 16 (100.0%) | 15 (100.0%) |
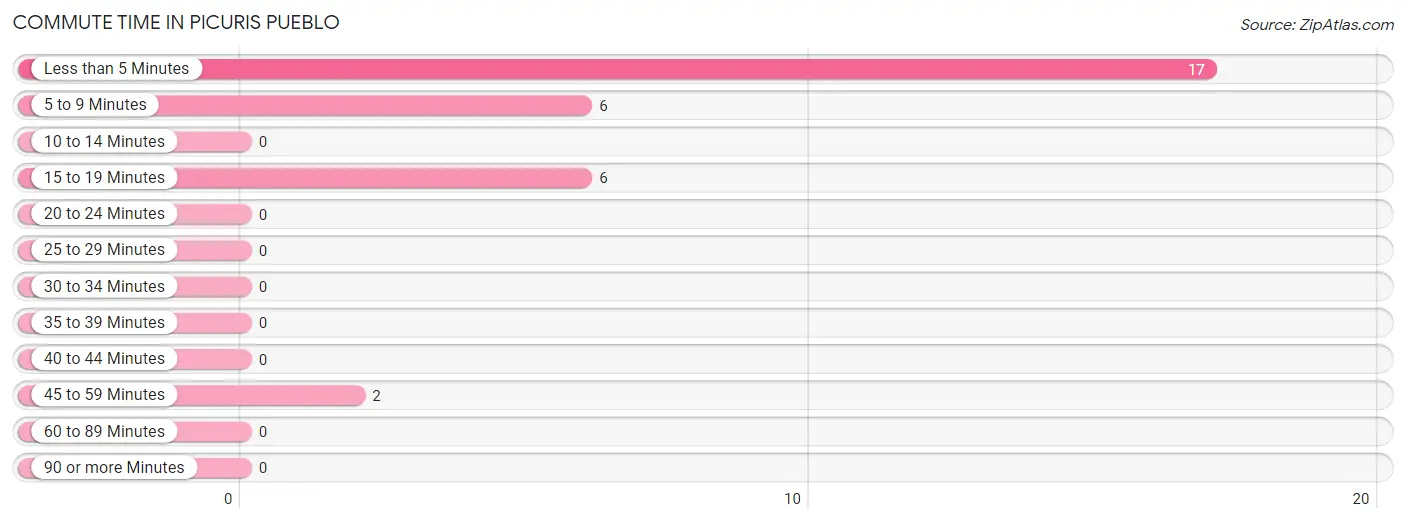
Commute Time in Picuris Pueblo
The most frequently occuring commute durations in Picuris Pueblo are less than 5 minutes (17 commuters, 54.8%), 5 to 9 minutes (6 commuters, 19.4%), and 15 to 19 minutes (6 commuters, 19.4%).
| Commute Time | # Commuters | % Commuters |
| Less than 5 Minutes | 17 | 54.8% |
| 5 to 9 Minutes | 6 | 19.4% |
| 10 to 14 Minutes | 0 | 0.0% |
| 15 to 19 Minutes | 6 | 19.4% |
| 20 to 24 Minutes | 0 | 0.0% |
| 25 to 29 Minutes | 0 | 0.0% |
| 30 to 34 Minutes | 0 | 0.0% |
| 35 to 39 Minutes | 0 | 0.0% |
| 40 to 44 Minutes | 0 | 0.0% |
| 45 to 59 Minutes | 2 | 6.5% |
| 60 to 89 Minutes | 0 | 0.0% |
| 90 or more Minutes | 0 | 0.0% |
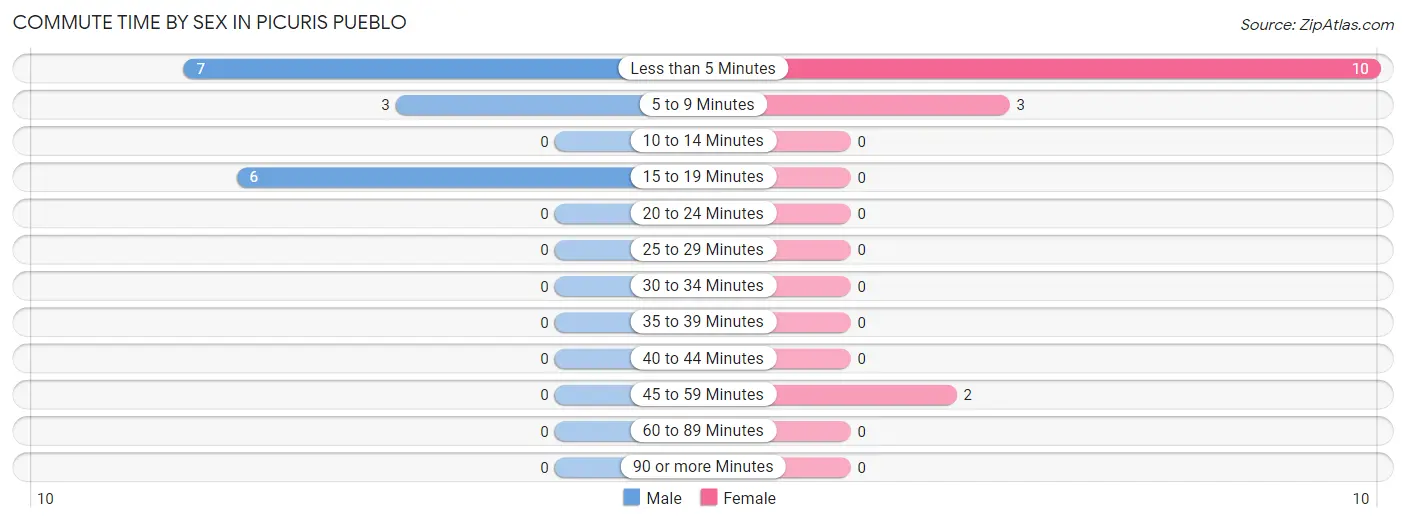
Commute Time by Sex in Picuris Pueblo
The most common commute times in Picuris Pueblo are less than 5 minutes (7 commuters, 43.8%) for males and less than 5 minutes (10 commuters, 66.7%) for females.
| Commute Time | Male | Female |
| Less than 5 Minutes | 7 (43.8%) | 10 (66.7%) |
| 5 to 9 Minutes | 3 (18.8%) | 3 (20.0%) |
| 10 to 14 Minutes | 0 (0.0%) | 0 (0.0%) |
| 15 to 19 Minutes | 6 (37.5%) | 0 (0.0%) |
| 20 to 24 Minutes | 0 (0.0%) | 0 (0.0%) |
| 25 to 29 Minutes | 0 (0.0%) | 0 (0.0%) |
| 30 to 34 Minutes | 0 (0.0%) | 0 (0.0%) |
| 35 to 39 Minutes | 0 (0.0%) | 0 (0.0%) |
| 40 to 44 Minutes | 0 (0.0%) | 0 (0.0%) |
| 45 to 59 Minutes | 0 (0.0%) | 2 (13.3%) |
| 60 to 89 Minutes | 0 (0.0%) | 0 (0.0%) |
| 90 or more Minutes | 0 (0.0%) | 0 (0.0%) |
Time of Departure to Work by Sex in Picuris Pueblo
The most frequent times of departure to work in Picuris Pueblo are 6:00 AM to 6:29 AM (8, 50.0%) for males and 12:00 AM to 4:59 AM (8, 53.3%) for females.
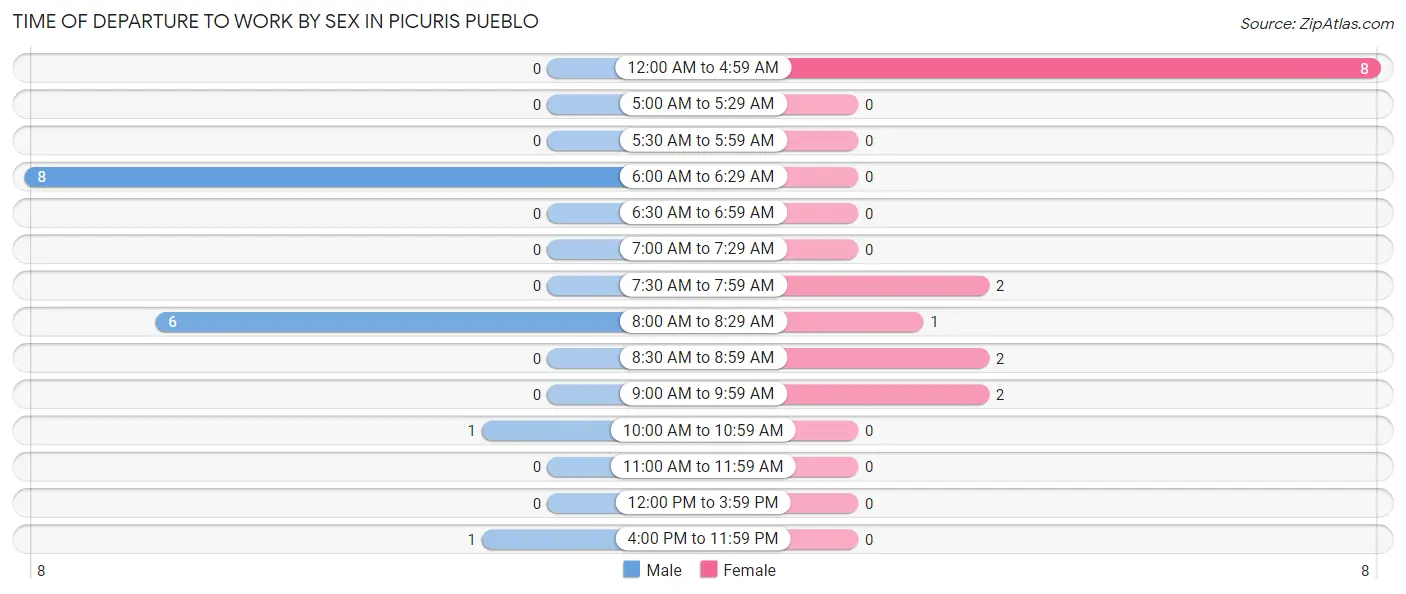
| Time of Departure | Male | Female |
| 12:00 AM to 4:59 AM | 0 (0.0%) | 8 (53.3%) |
| 5:00 AM to 5:29 AM | 0 (0.0%) | 0 (0.0%) |
| 5:30 AM to 5:59 AM | 0 (0.0%) | 0 (0.0%) |
| 6:00 AM to 6:29 AM | 8 (50.0%) | 0 (0.0%) |
| 6:30 AM to 6:59 AM | 0 (0.0%) | 0 (0.0%) |
| 7:00 AM to 7:29 AM | 0 (0.0%) | 0 (0.0%) |
| 7:30 AM to 7:59 AM | 0 (0.0%) | 2 (13.3%) |
| 8:00 AM to 8:29 AM | 6 (37.5%) | 1 (6.7%) |
| 8:30 AM to 8:59 AM | 0 (0.0%) | 2 (13.3%) |
| 9:00 AM to 9:59 AM | 0 (0.0%) | 2 (13.3%) |
| 10:00 AM to 10:59 AM | 1 (6.2%) | 0 (0.0%) |
| 11:00 AM to 11:59 AM | 0 (0.0%) | 0 (0.0%) |
| 12:00 PM to 3:59 PM | 0 (0.0%) | 0 (0.0%) |
| 4:00 PM to 11:59 PM | 1 (6.2%) | 0 (0.0%) |
| Total | 16 (100.0%) | 15 (100.0%) |
Housing Occupancy in Picuris Pueblo
Occupancy by Ownership in Picuris Pueblo
Of the total 23 dwellings in Picuris Pueblo, owner-occupied units account for 20 (87.0%), while renter-occupied units make up 3 (13.0%).
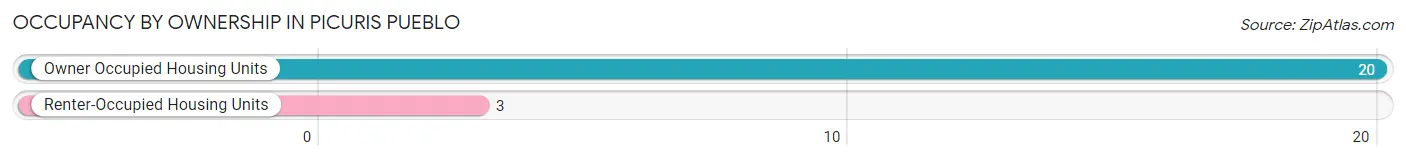
| Occupancy | # Housing Units | % Housing Units |
| Owner Occupied Housing Units | 20 | 87.0% |
| Renter-Occupied Housing Units | 3 | 13.0% |
| Total Occupied Housing Units | 23 | 100.0% |
Occupancy by Household Size in Picuris Pueblo
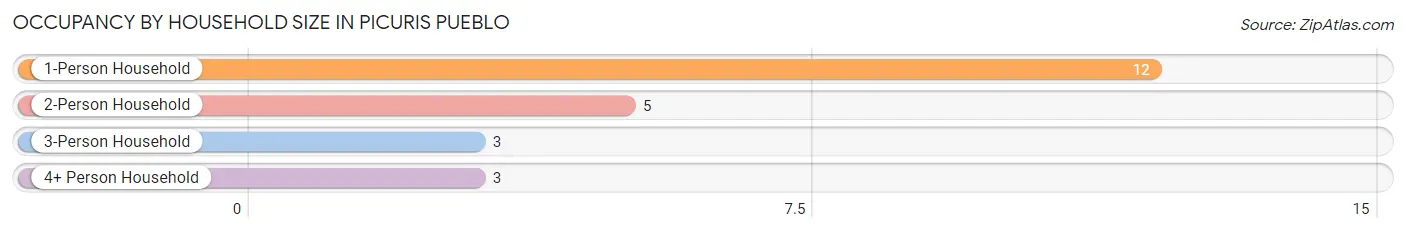
| Household Size | # Housing Units | % Housing Units |
| 1-Person Household | 12 | 52.2% |
| 2-Person Household | 5 | 21.7% |
| 3-Person Household | 3 | 13.0% |
| 4+ Person Household | 3 | 13.0% |
| Total Housing Units | 23 | 100.0% |
Occupancy by Ownership by Household Size in Picuris Pueblo
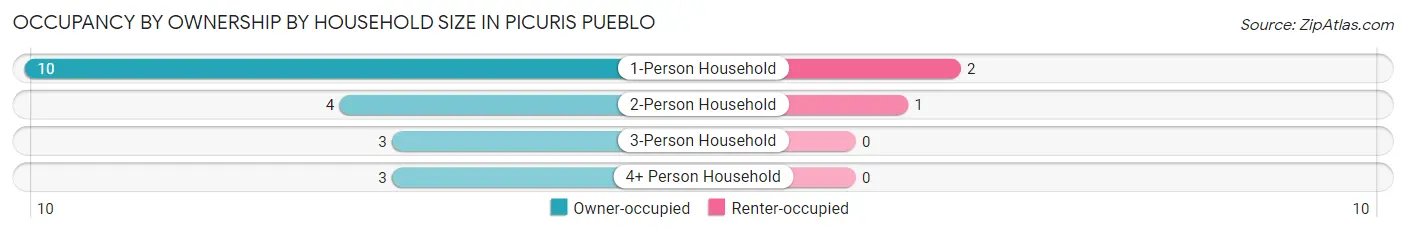
| Household Size | Owner-occupied | Renter-occupied |
| 1-Person Household | 10 (83.3%) | 2 (16.7%) |
| 2-Person Household | 4 (80.0%) | 1 (20.0%) |
| 3-Person Household | 3 (100.0%) | 0 (0.0%) |
| 4+ Person Household | 3 (100.0%) | 0 (0.0%) |
| Total Housing Units | 20 (87.0%) | 3 (13.0%) |
Occupancy by Educational Attainment in Picuris Pueblo
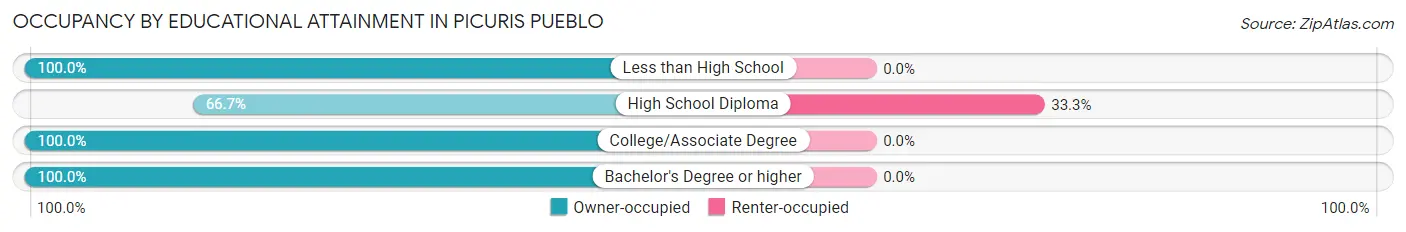
| Household Size | Owner-occupied | Renter-occupied |
| Less than High School | 5 (100.0%) | 0 (0.0%) |
| High School Diploma | 6 (66.7%) | 3 (33.3%) |
| College/Associate Degree | 7 (100.0%) | 0 (0.0%) |
| Bachelor's Degree or higher | 2 (100.0%) | 0 (0.0%) |
Occupancy by Age of Householder in Picuris Pueblo
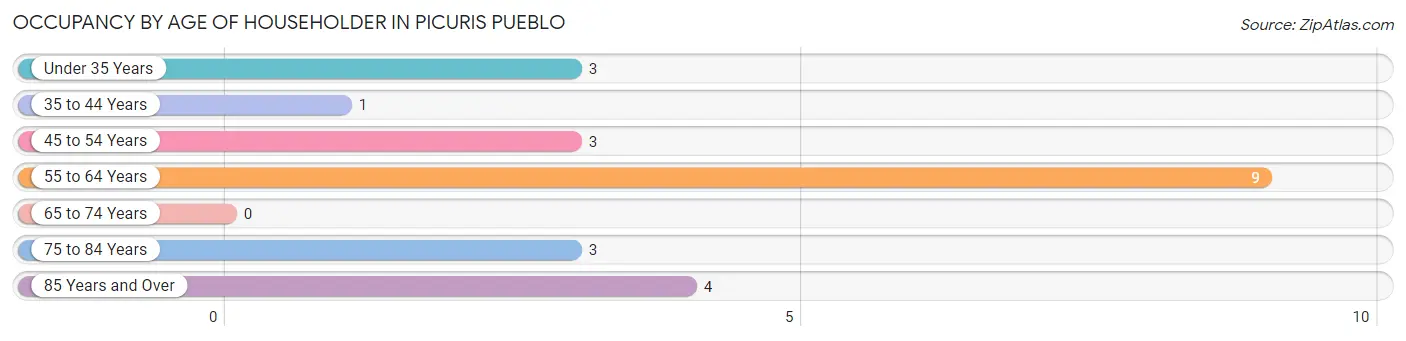
| Age Bracket | # Households | % Households |
| Under 35 Years | 3 | 13.0% |
| 35 to 44 Years | 1 | 4.3% |
| 45 to 54 Years | 3 | 13.0% |
| 55 to 64 Years | 9 | 39.1% |
| 65 to 74 Years | 0 | 0.0% |
| 75 to 84 Years | 3 | 13.0% |
| 85 Years and Over | 4 | 17.4% |
| Total | 23 | 100.0% |
Housing Finances in Picuris Pueblo
Median Income by Occupancy in Picuris Pueblo
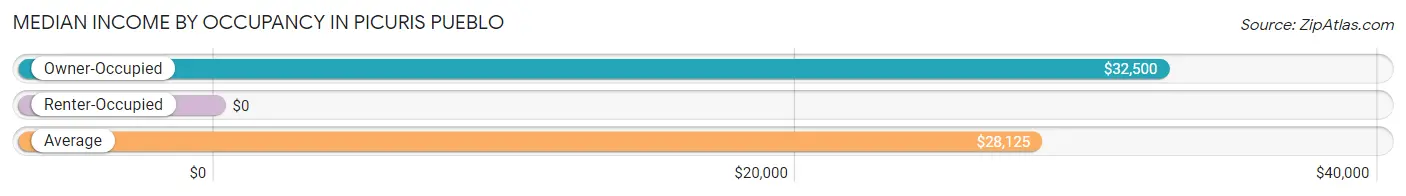
| Occupancy Type | # Households | Median Income |
| Owner-Occupied | 20 (87.0%) | $32,500 |
| Renter-Occupied | 3 (13.0%) | $0 |
| Average | 23 (100.0%) | $28,125 |
Occupancy by Householder Income Bracket in Picuris Pueblo
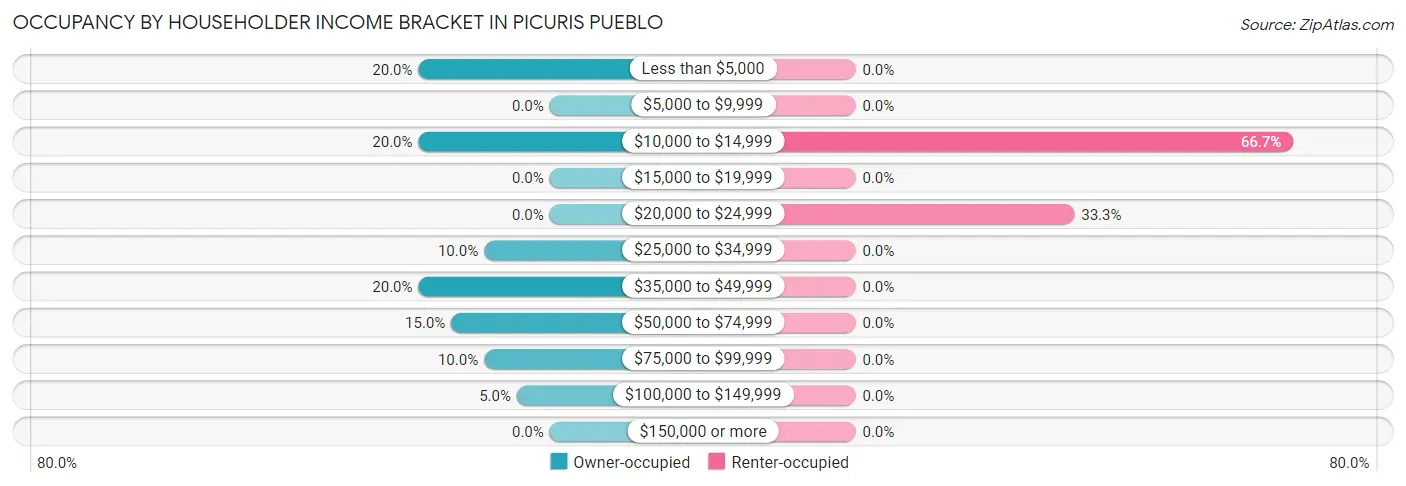
| Income Bracket | Owner-occupied | Renter-occupied |
| Less than $5,000 | 4 (20.0%) | 0 (0.0%) |
| $5,000 to $9,999 | 0 (0.0%) | 0 (0.0%) |
| $10,000 to $14,999 | 4 (20.0%) | 2 (66.7%) |
| $15,000 to $19,999 | 0 (0.0%) | 0 (0.0%) |
| $20,000 to $24,999 | 0 (0.0%) | 1 (33.3%) |
| $25,000 to $34,999 | 2 (10.0%) | 0 (0.0%) |
| $35,000 to $49,999 | 4 (20.0%) | 0 (0.0%) |
| $50,000 to $74,999 | 3 (15.0%) | 0 (0.0%) |
| $75,000 to $99,999 | 2 (10.0%) | 0 (0.0%) |
| $100,000 to $149,999 | 1 (5.0%) | 0 (0.0%) |
| $150,000 or more | 0 (0.0%) | 0 (0.0%) |
| Total | 20 (100.0%) | 3 (100.0%) |
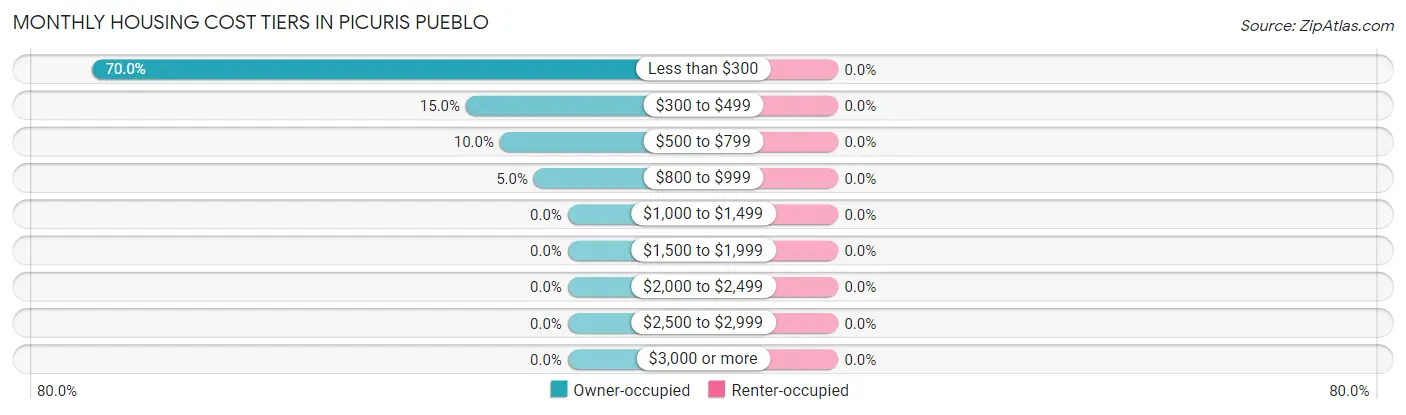
Monthly Housing Cost Tiers in Picuris Pueblo
| Monthly Cost | Owner-occupied | Renter-occupied |
| Less than $300 | 14 (70.0%) | 0 (0.0%) |
| $300 to $499 | 3 (15.0%) | 0 (0.0%) |
| $500 to $799 | 2 (10.0%) | 0 (0.0%) |
| $800 to $999 | 1 (5.0%) | 0 (0.0%) |
| $1,000 to $1,499 | 0 (0.0%) | 0 (0.0%) |
| $1,500 to $1,999 | 0 (0.0%) | 0 (0.0%) |
| $2,000 to $2,499 | 0 (0.0%) | 0 (0.0%) |
| $2,500 to $2,999 | 0 (0.0%) | 0 (0.0%) |
| $3,000 or more | 0 (0.0%) | 0 (0.0%) |
| Total | 20 (100.0%) | 3 (100.0%) |
Physical Housing Characteristics in Picuris Pueblo
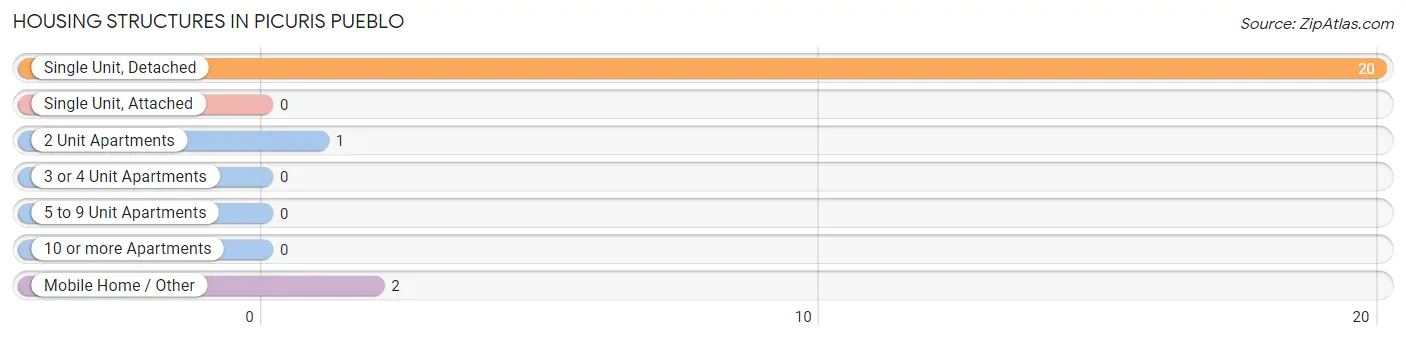
Housing Structures in Picuris Pueblo
| Structure Type | # Housing Units | % Housing Units |
| Single Unit, Detached | 20 | 87.0% |
| Single Unit, Attached | 0 | 0.0% |
| 2 Unit Apartments | 1 | 4.3% |
| 3 or 4 Unit Apartments | 0 | 0.0% |
| 5 to 9 Unit Apartments | 0 | 0.0% |
| 10 or more Apartments | 0 | 0.0% |
| Mobile Home / Other | 2 | 8.7% |
| Total | 23 | 100.0% |
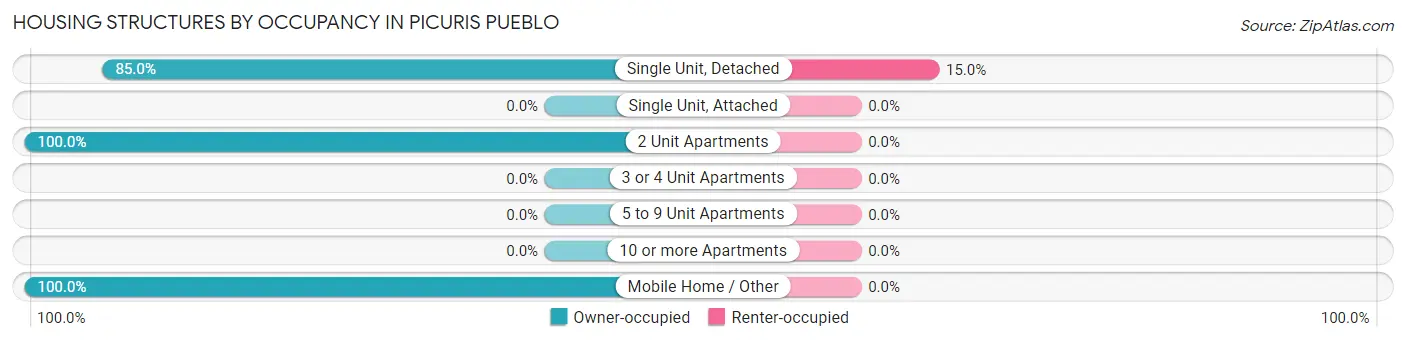
Housing Structures by Occupancy in Picuris Pueblo
| Structure Type | Owner-occupied | Renter-occupied |
| Single Unit, Detached | 17 (85.0%) | 3 (15.0%) |
| Single Unit, Attached | 0 (0.0%) | 0 (0.0%) |
| 2 Unit Apartments | 1 (100.0%) | 0 (0.0%) |
| 3 or 4 Unit Apartments | 0 (0.0%) | 0 (0.0%) |
| 5 to 9 Unit Apartments | 0 (0.0%) | 0 (0.0%) |
| 10 or more Apartments | 0 (0.0%) | 0 (0.0%) |
| Mobile Home / Other | 2 (100.0%) | 0 (0.0%) |
| Total | 20 (87.0%) | 3 (13.0%) |
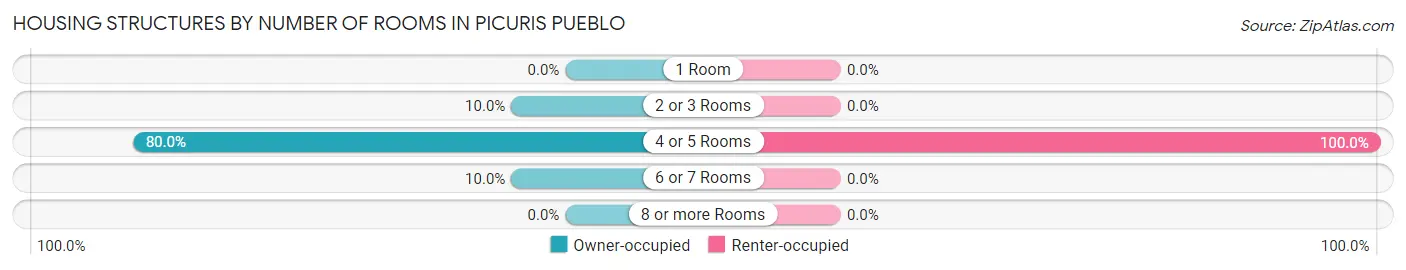
Housing Structures by Number of Rooms in Picuris Pueblo
| Number of Rooms | Owner-occupied | Renter-occupied |
| 1 Room | 0 (0.0%) | 0 (0.0%) |
| 2 or 3 Rooms | 2 (10.0%) | 0 (0.0%) |
| 4 or 5 Rooms | 16 (80.0%) | 3 (100.0%) |
| 6 or 7 Rooms | 2 (10.0%) | 0 (0.0%) |
| 8 or more Rooms | 0 (0.0%) | 0 (0.0%) |
| Total | 20 (100.0%) | 3 (100.0%) |
Housing Structure by Heating Type in Picuris Pueblo
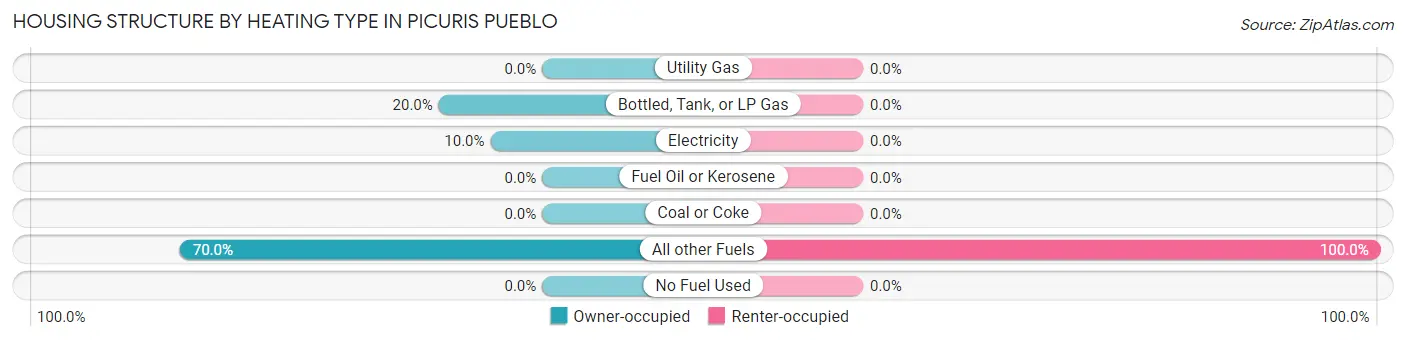
| Heating Type | Owner-occupied | Renter-occupied |
| Utility Gas | 0 (0.0%) | 0 (0.0%) |
| Bottled, Tank, or LP Gas | 4 (20.0%) | 0 (0.0%) |
| Electricity | 2 (10.0%) | 0 (0.0%) |
| Fuel Oil or Kerosene | 0 (0.0%) | 0 (0.0%) |
| Coal or Coke | 0 (0.0%) | 0 (0.0%) |
| All other Fuels | 14 (70.0%) | 3 (100.0%) |
| No Fuel Used | 0 (0.0%) | 0 (0.0%) |
| Total | 20 (100.0%) | 3 (100.0%) |
Household Vehicle Usage in Picuris Pueblo
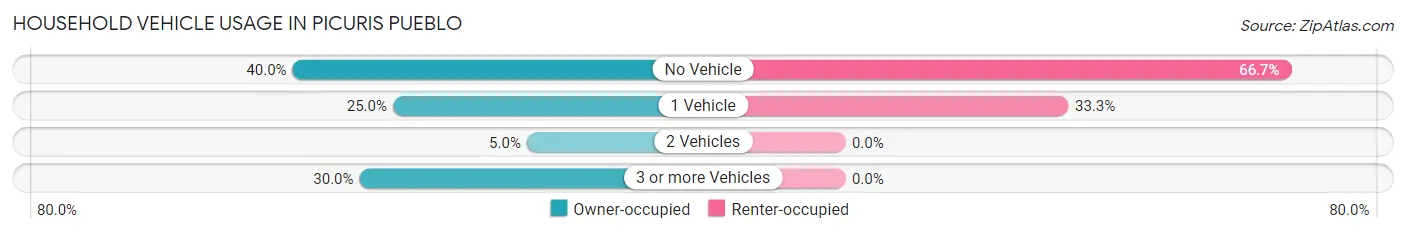
| Vehicles per Household | Owner-occupied | Renter-occupied |
| No Vehicle | 8 (40.0%) | 2 (66.7%) |
| 1 Vehicle | 5 (25.0%) | 1 (33.3%) |
| 2 Vehicles | 1 (5.0%) | 0 (0.0%) |
| 3 or more Vehicles | 6 (30.0%) | 0 (0.0%) |
| Total | 20 (100.0%) | 3 (100.0%) |
Real Estate & Mortgages in Picuris Pueblo
Real Estate and Mortgage Overview in Picuris Pueblo
| Characteristic | Without Mortgage | With Mortgage |
| Housing Units | 18 | 2 |
| Median Property Value | $187,500 | $0 |
| Median Household Income | - | - |
| Monthly Housing Costs | $213 | $0 |
| Real Estate Taxes | - | - |
Property Value by Mortgage Status in Picuris Pueblo
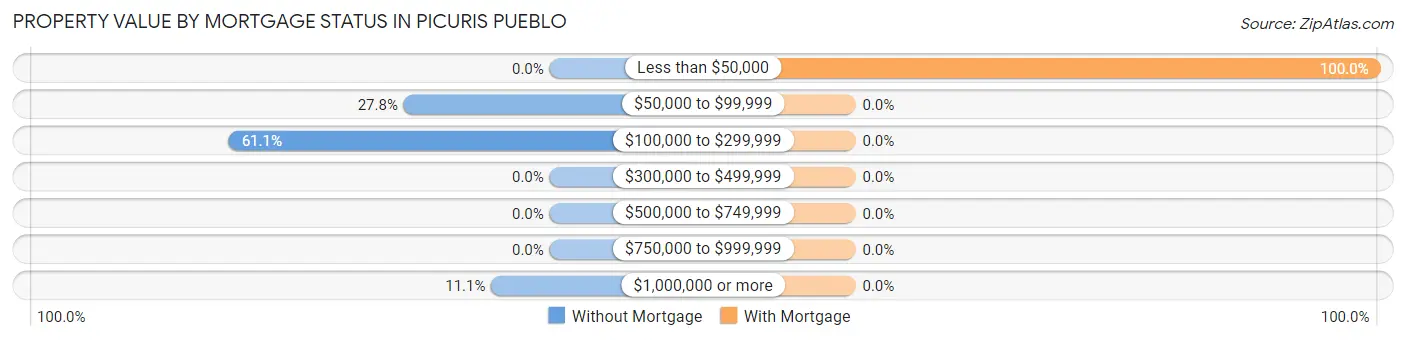
| Property Value | Without Mortgage | With Mortgage |
| Less than $50,000 | 0 (0.0%) | 2 (100.0%) |
| $50,000 to $99,999 | 5 (27.8%) | 0 (0.0%) |
| $100,000 to $299,999 | 11 (61.1%) | 0 (0.0%) |
| $300,000 to $499,999 | 0 (0.0%) | 0 (0.0%) |
| $500,000 to $749,999 | 0 (0.0%) | 0 (0.0%) |
| $750,000 to $999,999 | 0 (0.0%) | 0 (0.0%) |
| $1,000,000 or more | 2 (11.1%) | 0 (0.0%) |
| Total | 18 (100.0%) | 2 (100.0%) |
Household Income by Mortgage Status in Picuris Pueblo
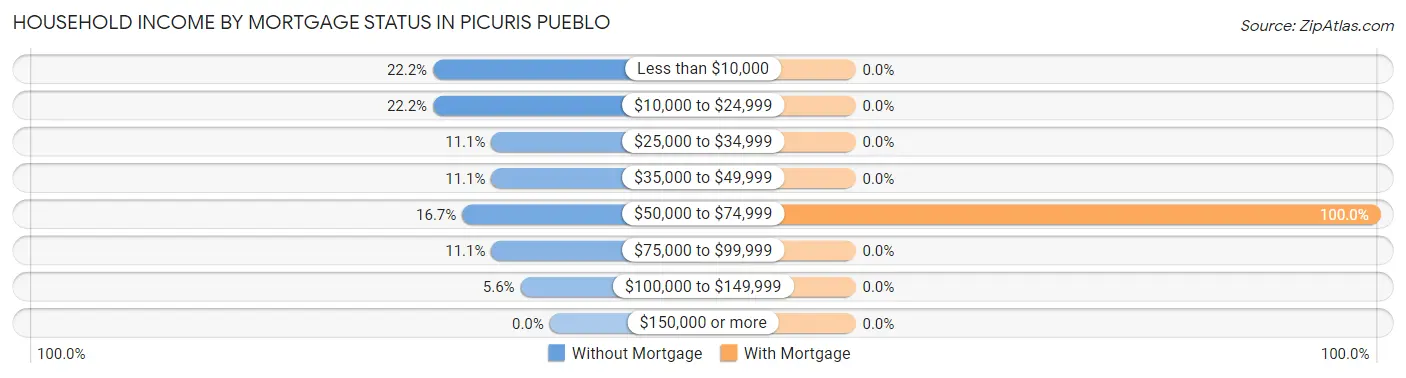
| Household Income | Without Mortgage | With Mortgage |
| Less than $10,000 | 4 (22.2%) | 0 (0.0%) |
| $10,000 to $24,999 | 4 (22.2%) | 0 (0.0%) |
| $25,000 to $34,999 | 2 (11.1%) | 0 (0.0%) |
| $35,000 to $49,999 | 2 (11.1%) | 0 (0.0%) |
| $50,000 to $74,999 | 3 (16.7%) | 2 (100.0%) |
| $75,000 to $99,999 | 2 (11.1%) | 0 (0.0%) |
| $100,000 to $149,999 | 1 (5.6%) | 0 (0.0%) |
| $150,000 or more | 0 (0.0%) | 0 (0.0%) |
| Total | 18 (100.0%) | 2 (100.0%) |
Property Value to Household Income Ratio in Picuris Pueblo
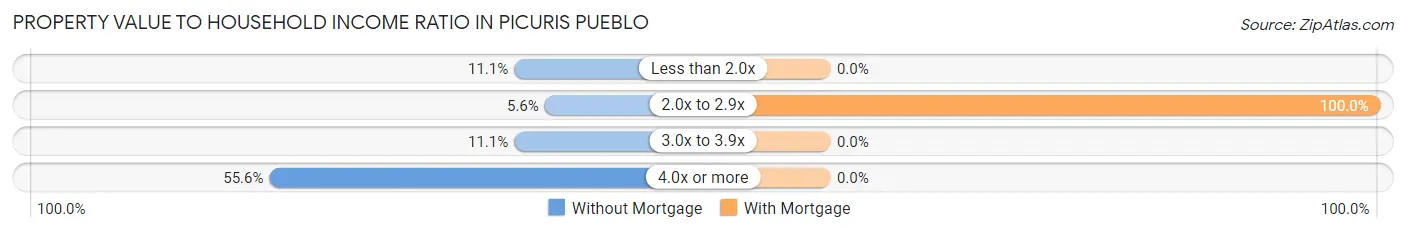
| Value-to-Income Ratio | Without Mortgage | With Mortgage |
| Less than 2.0x | 2 (11.1%) | 0 (0.0%) |
| 2.0x to 2.9x | 1 (5.6%) | 2 (100.0%) |
| 3.0x to 3.9x | 2 (11.1%) | 0 (0.0%) |
| 4.0x or more | 10 (55.6%) | 0 (0.0%) |
| Total | 18 (100.0%) | 2 (100.0%) |
Real Estate Taxes by Mortgage Status in Picuris Pueblo
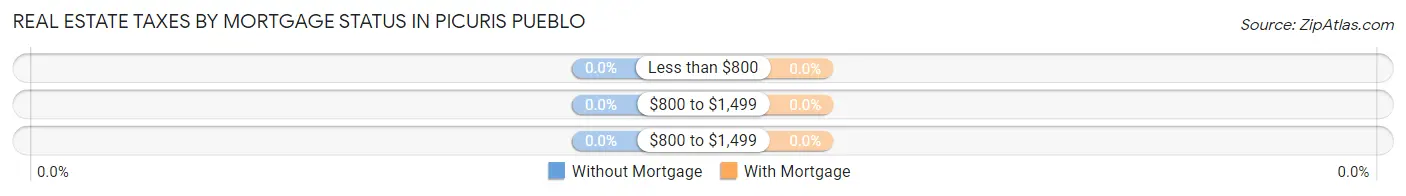
| Property Taxes | Without Mortgage | With Mortgage |
| Less than $800 | 0 (0.0%) | 0 (0.0%) |
| $800 to $1,499 | 0 (0.0%) | 0 (0.0%) |
| $800 to $1,499 | 0 (0.0%) | 0 (0.0%) |
| Total | 18 (100.0%) | 2 (100.0%) |
Health & Disability in Picuris Pueblo
Health Insurance Coverage by Age in Picuris Pueblo
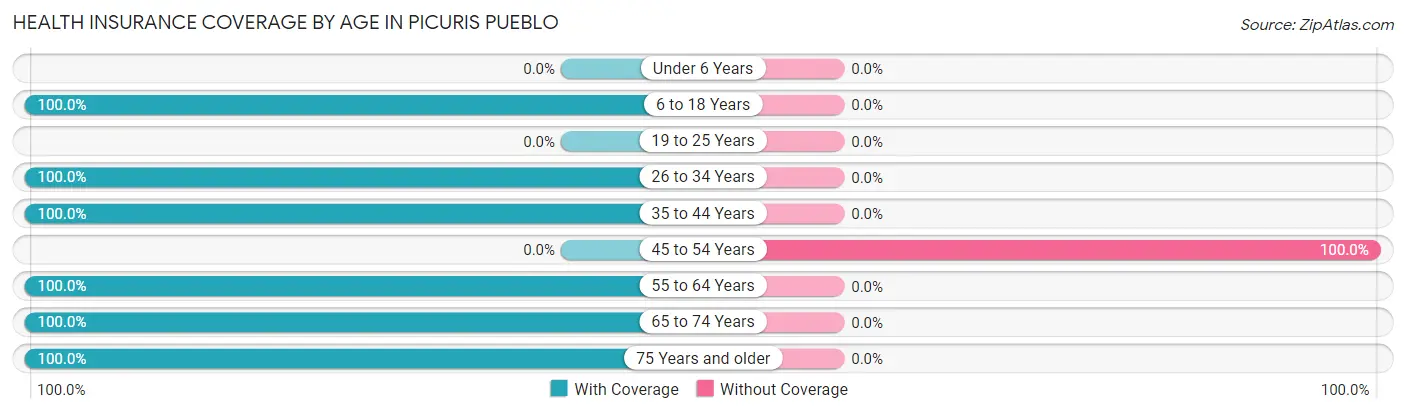
| Age Bracket | With Coverage | Without Coverage |
| Under 6 Years | 0 (0.0%) | 0 (0.0%) |
| 6 to 18 Years | 6 (100.0%) | 0 (0.0%) |
| 19 to 25 Years | 0 (0.0%) | 0 (0.0%) |
| 26 to 34 Years | 4 (100.0%) | 0 (0.0%) |
| 35 to 44 Years | 17 (100.0%) | 0 (0.0%) |
| 45 to 54 Years | 0 (0.0%) | 4 (100.0%) |
| 55 to 64 Years | 14 (100.0%) | 0 (0.0%) |
| 65 to 74 Years | 23 (100.0%) | 0 (0.0%) |
| 75 Years and older | 7 (100.0%) | 0 (0.0%) |
| Total | 71 (94.7%) | 4 (5.3%) |
Health Insurance Coverage by Citizenship Status in Picuris Pueblo
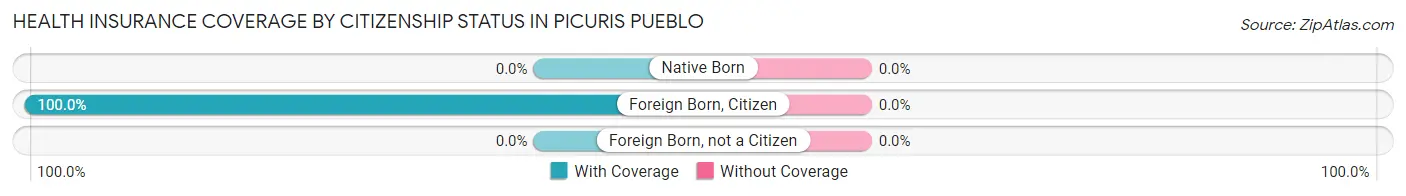
| Citizenship Status | With Coverage | Without Coverage |
| Native Born | 0 (0.0%) | 0 (0.0%) |
| Foreign Born, Citizen | 6 (100.0%) | 0 (0.0%) |
| Foreign Born, not a Citizen | 0 (0.0%) | 0 (0.0%) |
Health Insurance Coverage by Household Income in Picuris Pueblo
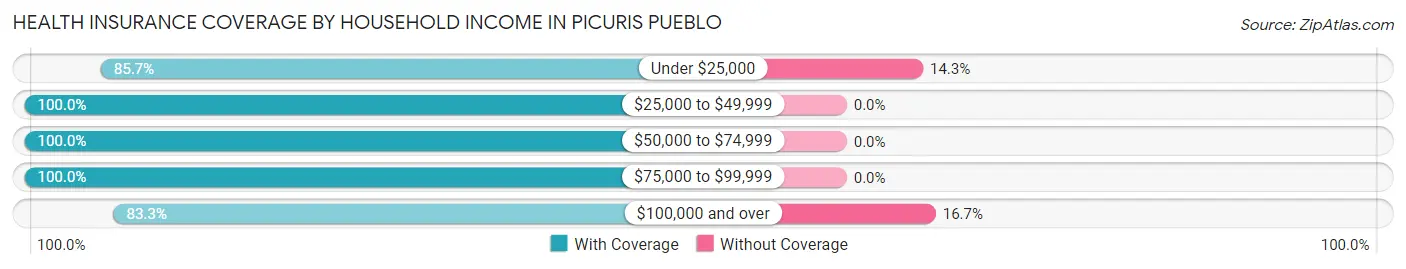
| Household Income | With Coverage | Without Coverage |
| Under $25,000 | 18 (85.7%) | 3 (14.3%) |
| $25,000 to $49,999 | 10 (100.0%) | 0 (0.0%) |
| $50,000 to $74,999 | 15 (100.0%) | 0 (0.0%) |
| $75,000 to $99,999 | 23 (100.0%) | 0 (0.0%) |
| $100,000 and over | 5 (83.3%) | 1 (16.7%) |
Public vs Private Health Insurance Coverage by Age in Picuris Pueblo
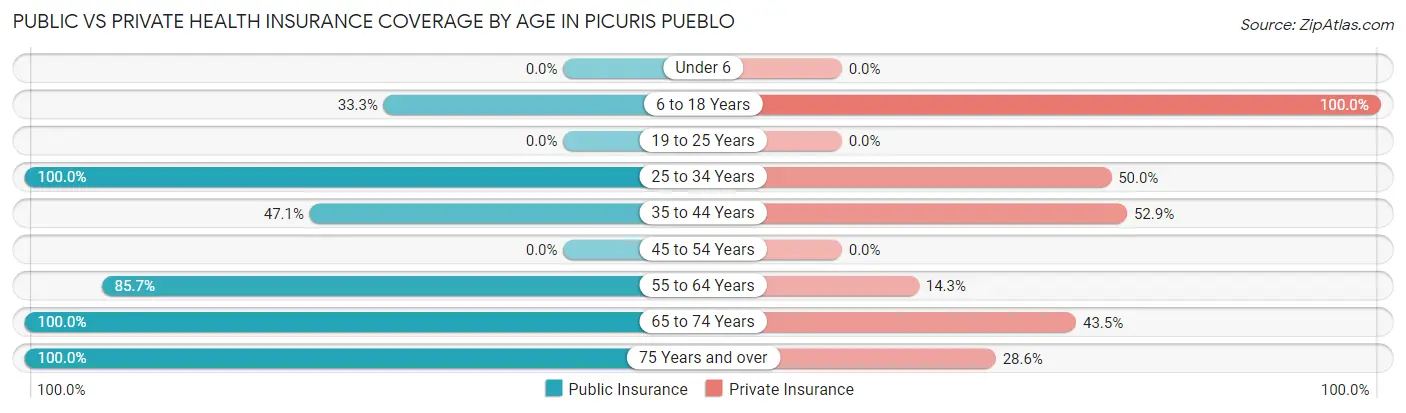
| Age Bracket | Public Insurance | Private Insurance |
| Under 6 | 0 (0.0%) | 0 (0.0%) |
| 6 to 18 Years | 2 (33.3%) | 6 (100.0%) |
| 19 to 25 Years | 0 (0.0%) | 0 (0.0%) |
| 25 to 34 Years | 4 (100.0%) | 2 (50.0%) |
| 35 to 44 Years | 8 (47.1%) | 9 (52.9%) |
| 45 to 54 Years | 0 (0.0%) | 0 (0.0%) |
| 55 to 64 Years | 12 (85.7%) | 2 (14.3%) |
| 65 to 74 Years | 23 (100.0%) | 10 (43.5%) |
| 75 Years and over | 7 (100.0%) | 2 (28.6%) |
| Total | 56 (74.7%) | 31 (41.3%) |
Disability Status by Sex by Age in Picuris Pueblo
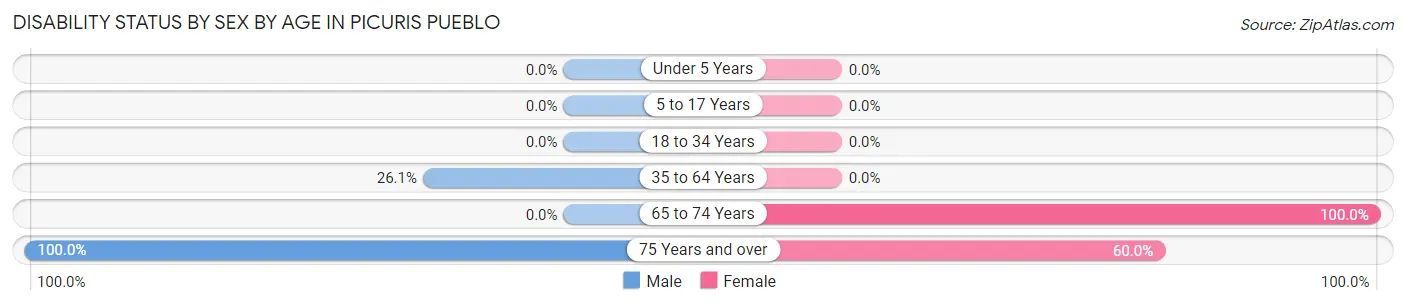
| Age Bracket | Male | Female |
| Under 5 Years | 0 (0.0%) | 0 (0.0%) |
| 5 to 17 Years | 0 (0.0%) | 0 (0.0%) |
| 18 to 34 Years | 0 (0.0%) | 0 (0.0%) |
| 35 to 64 Years | 6 (26.1%) | 0 (0.0%) |
| 65 to 74 Years | 0 (0.0%) | 23 (100.0%) |
| 75 Years and over | 2 (100.0%) | 3 (60.0%) |
Disability Class by Sex by Age in Picuris Pueblo
Disability Class: Hearing Difficulty
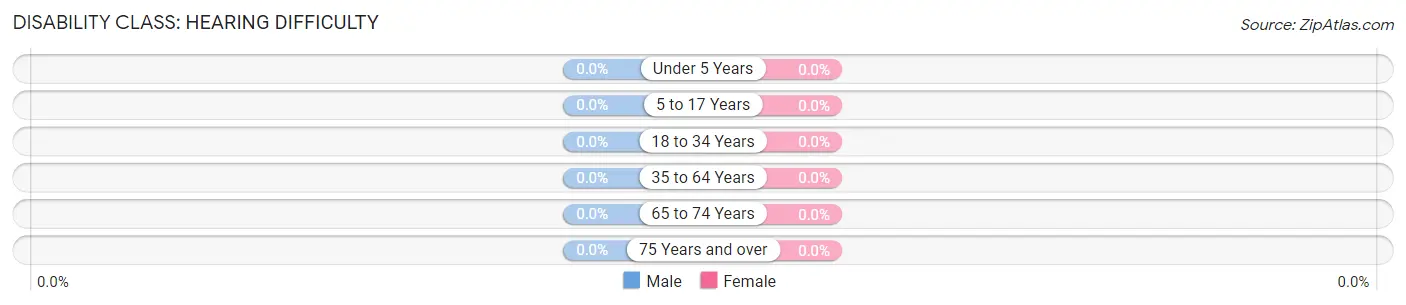
| Age Bracket | Male | Female |
| Under 5 Years | 0 (0.0%) | 0 (0.0%) |
| 5 to 17 Years | 0 (0.0%) | 0 (0.0%) |
| 18 to 34 Years | 0 (0.0%) | 0 (0.0%) |
| 35 to 64 Years | 0 (0.0%) | 0 (0.0%) |
| 65 to 74 Years | 0 (0.0%) | 0 (0.0%) |
| 75 Years and over | 0 (0.0%) | 0 (0.0%) |
Disability Class: Vision Difficulty
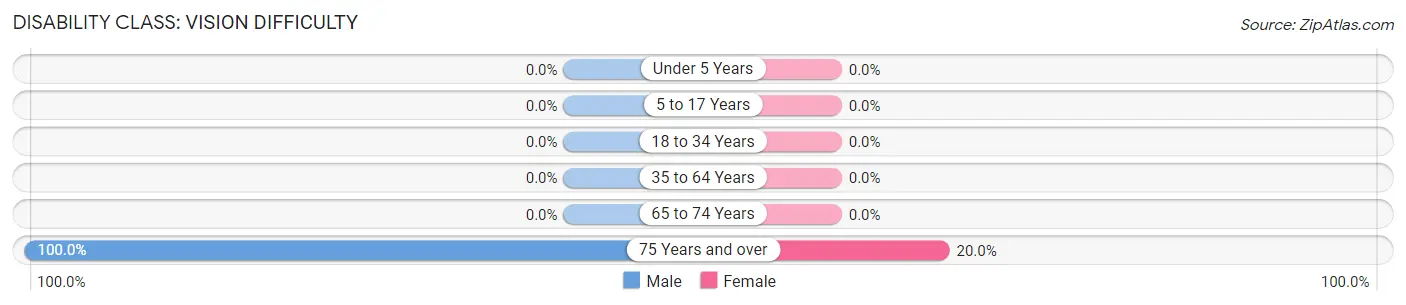
| Age Bracket | Male | Female |
| Under 5 Years | 0 (0.0%) | 0 (0.0%) |
| 5 to 17 Years | 0 (0.0%) | 0 (0.0%) |
| 18 to 34 Years | 0 (0.0%) | 0 (0.0%) |
| 35 to 64 Years | 0 (0.0%) | 0 (0.0%) |
| 65 to 74 Years | 0 (0.0%) | 0 (0.0%) |
| 75 Years and over | 2 (100.0%) | 1 (20.0%) |
Disability Class: Cognitive Difficulty
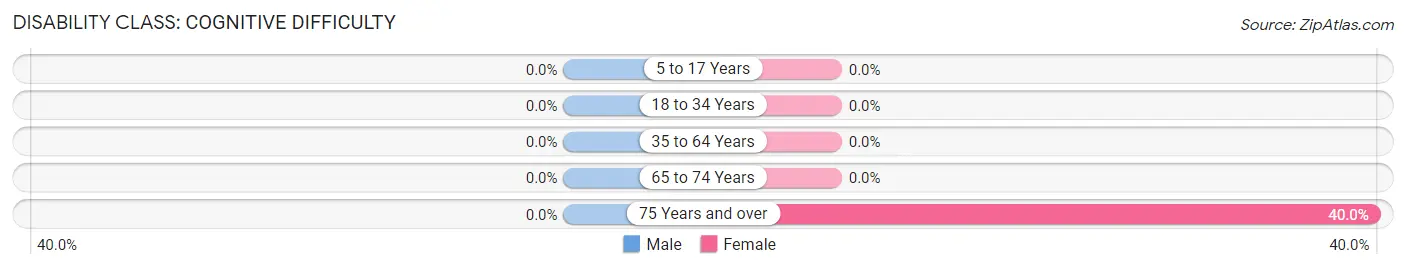
| Age Bracket | Male | Female |
| 5 to 17 Years | 0 (0.0%) | 0 (0.0%) |
| 18 to 34 Years | 0 (0.0%) | 0 (0.0%) |
| 35 to 64 Years | 0 (0.0%) | 0 (0.0%) |
| 65 to 74 Years | 0 (0.0%) | 0 (0.0%) |
| 75 Years and over | 0 (0.0%) | 2 (40.0%) |
Disability Class: Ambulatory Difficulty
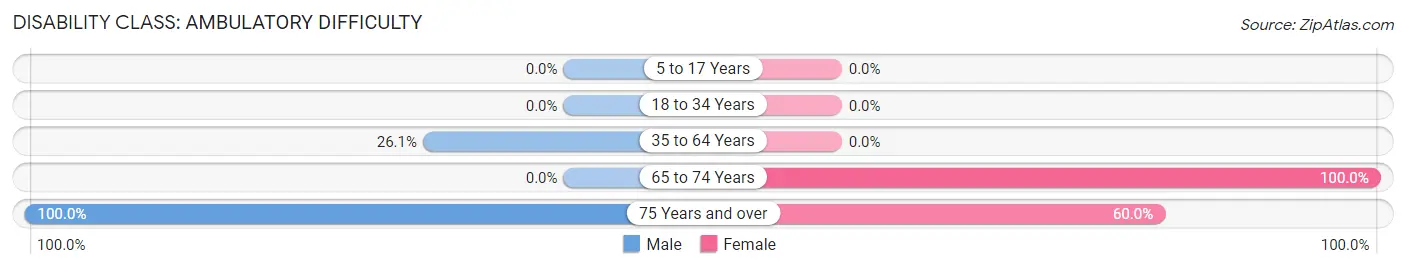
| Age Bracket | Male | Female |
| 5 to 17 Years | 0 (0.0%) | 0 (0.0%) |
| 18 to 34 Years | 0 (0.0%) | 0 (0.0%) |
| 35 to 64 Years | 6 (26.1%) | 0 (0.0%) |
| 65 to 74 Years | 0 (0.0%) | 23 (100.0%) |
| 75 Years and over | 2 (100.0%) | 3 (60.0%) |
Disability Class: Self-Care Difficulty
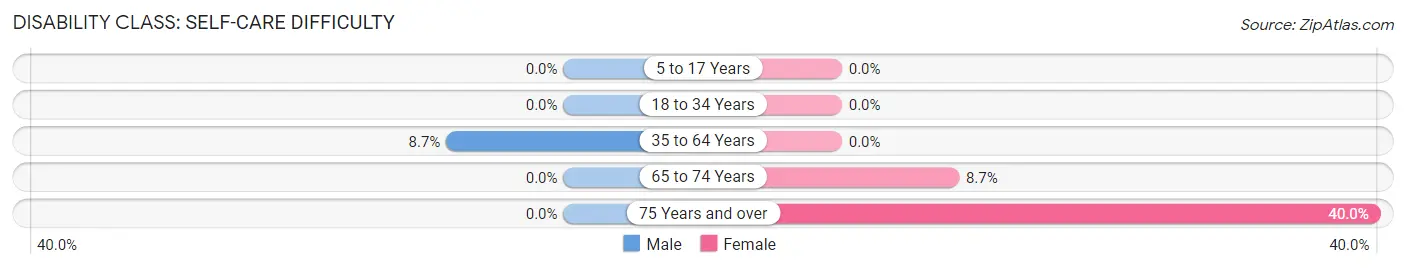
| Age Bracket | Male | Female |
| 5 to 17 Years | 0 (0.0%) | 0 (0.0%) |
| 18 to 34 Years | 0 (0.0%) | 0 (0.0%) |
| 35 to 64 Years | 2 (8.7%) | 0 (0.0%) |
| 65 to 74 Years | 0 (0.0%) | 2 (8.7%) |
| 75 Years and over | 0 (0.0%) | 2 (40.0%) |
Technology Access in Picuris Pueblo
Computing Device Access in Picuris Pueblo
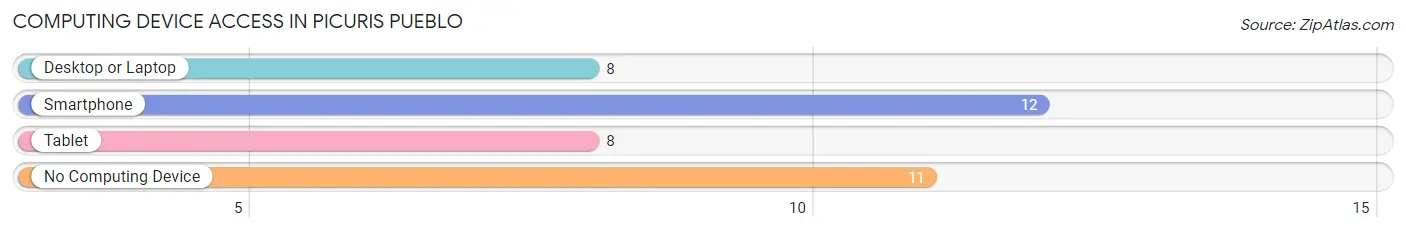
| Device Type | # Households | % Households |
| Desktop or Laptop | 8 | 34.8% |
| Smartphone | 12 | 52.2% |
| Tablet | 8 | 34.8% |
| No Computing Device | 11 | 47.8% |
| Total | 23 | 100.0% |
Internet Access in Picuris Pueblo
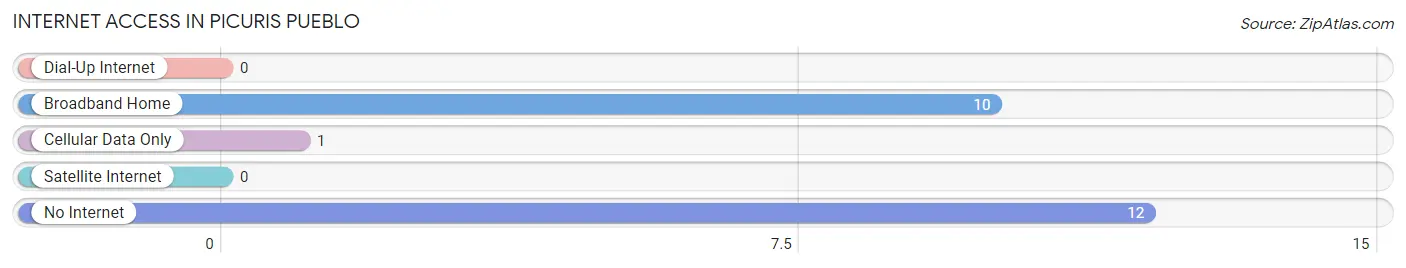
| Internet Type | # Households | % Households |
| Dial-Up Internet | 0 | 0.0% |
| Broadband Home | 10 | 43.5% |
| Cellular Data Only | 1 | 4.3% |
| Satellite Internet | 0 | 0.0% |
| No Internet | 12 | 52.2% |
| Total | 23 | 100.0% |
Picuris Pueblo Summary
Picuris Pueblo is a Native American pueblo located in northern New Mexico, United States. It is one of the 19 pueblos of the Taos people, and is located in the Sangre de Cristo Mountains, about 25 miles north of Taos. The Picuris Pueblo is home to about 500 people, and is the smallest of the Taos pueblos.
History
The Picuris Pueblo has a long and rich history, dating back to the 13th century. The Picuris people are believed to have migrated from the Mesa Verde area of Colorado, and settled in the area around 1250 AD. The Picuris Pueblo was one of the first pueblos to be established in the Taos area, and was the northernmost of the Taos pueblos.
The Picuris Pueblo was an important trading center for the Taos people, and was known for its pottery and weaving. The Picuris people were also known for their skill in hunting and fishing, and for their knowledge of medicinal plants.
The Picuris Pueblo was also an important religious center for the Taos people. The Picuris people believed in a variety of gods and goddesses, and held ceremonies to honor them. The Picuris Pueblo was also the site of the annual Taos Powwow, which was held to celebrate the harvest and other important events.
The Picuris Pueblo was also an important political center for the Taos people. The Picuris people were known for their strong sense of community and their commitment to protecting their land and culture. The Picuris Pueblo was also the site of the first Taos Pueblo Revolt in 1680, when the Picuris people and other Taos pueblos rose up against Spanish rule.
Geography
The Picuris Pueblo is located in the Sangre de Cristo Mountains, about 25 miles north of Taos. The pueblo is situated at an elevation of 7,000 feet, and is surrounded by the Carson National Forest. The Picuris Pueblo is located on the banks of the Rio Grande, and is bordered by the Rio Grande Gorge to the east.
The Picuris Pueblo is located in a semi-arid climate, with hot summers and cold winters. The average annual temperature is around 50 degrees Fahrenheit, and the average annual precipitation is around 12 inches.
Economy
The economy of the Picuris Pueblo is largely based on tourism and traditional crafts. The Picuris Pueblo is home to a number of tourist attractions, including the Picuris Pueblo Museum, the Picuris Pueblo Cultural Center, and the Picuris Pueblo Trading Post. The Picuris Pueblo is also home to a number of traditional craft shops, where visitors can purchase traditional pottery, jewelry, and other items.
The Picuris Pueblo is also home to a number of businesses, including a gas station, a grocery store, and a restaurant. The Picuris Pueblo is also home to a number of small farms, which produce a variety of crops, including corn, beans, squash, and chile.
Demographics
As of the 2010 census, the population of the Picuris Pueblo was 498. The population is primarily Native American, with a small percentage of Hispanic and White residents. The median age of the population is 37.5 years, and the median household income is $25,000.
The Picuris Pueblo is a close-knit community, and the people are very proud of their culture and traditions. The Picuris Pueblo is home to a number of traditional ceremonies and festivals, including the annual Taos Powwow, which is held to celebrate the harvest and other important events. The Picuris Pueblo is also home to a number of traditional craft shops, where visitors can purchase traditional pottery, jewelry, and other items.
Common Questions
What is the Total Population of Picuris Pueblo?
Total Population of Picuris Pueblo is 75.
What is the Total Male Population of Picuris Pueblo?
Total Male Population of Picuris Pueblo is 31.
What is the Total Female Population of Picuris Pueblo?
Total Female Population of Picuris Pueblo is 44.
What is the Ratio of Males per 100 Females in Picuris Pueblo?
There are 70.45 Males per 100 Females in Picuris Pueblo.
What is the Ratio of Females per 100 Males in Picuris Pueblo?
There are 141.94 Females per 100 Males in Picuris Pueblo.
What is the Median Population Age in Picuris Pueblo?
Median Population Age in Picuris Pueblo is 62.3 Years.
What is the Average Family Size in Picuris Pueblo
Average Family Size in Picuris Pueblo is 5.5 People.
What is the Average Household Size in Picuris Pueblo
Average Household Size in Picuris Pueblo is 3.3 People.
What is Per Capita Income in Picuris Pueblo?
Per Capita income in Picuris Pueblo is $21,853.
What is the Median Household income in Picuris Pueblo?
Median Household Income in Picuris Pueblo is $28,125.
What is Income or Wage Gap in Picuris Pueblo?
Income or Wage Gap in Picuris Pueblo is 73.2%.
Women in Picuris Pueblo earn 26.8 cents for every dollar earned by a man.
What is Inequality or Gini Index in Picuris Pueblo?
Inequality or Gini Index in Picuris Pueblo is 0.50.
How Large is the Labor Force in Picuris Pueblo?
There are 31 People in the Labor Forcein in Picuris Pueblo.
What is the Percentage of People in the Labor Force in Picuris Pueblo?
43.7% of People are in the Labor Force in Picuris Pueblo.