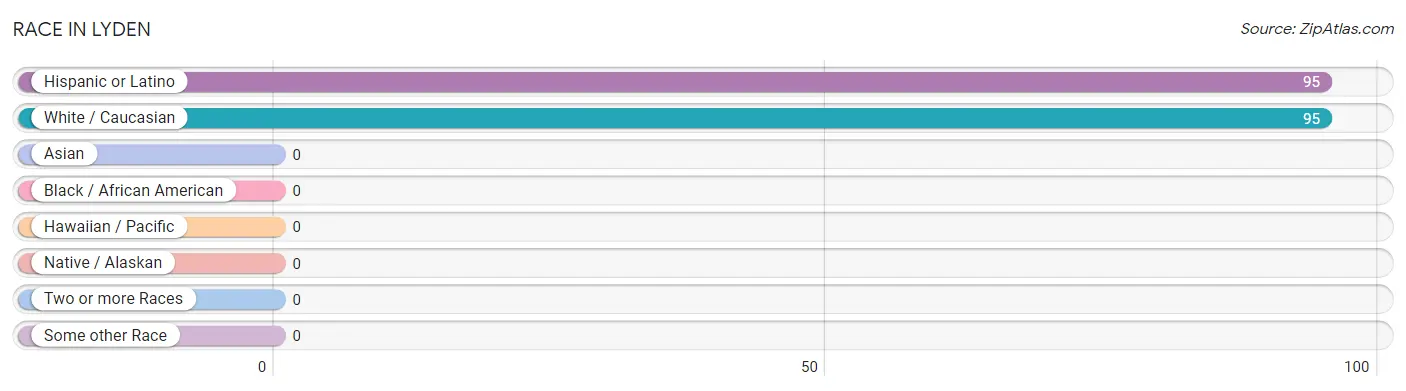
The most populous races in Lyden are Hispanic or Latino (95 | 100.0%), and White / Caucasian (95 | 100.0%).
Race
# Population
% Population
Asian
0
0.0%
Black / African American
0
0.0%
Hawaiian / Pacific
0
0.0%
Hispanic or Latino
95
100.0%
Native / Alaskan
0
0.0%
White / Caucasian
95
100.0%
Two or more Races
0
0.0%
Some other Race
0
0.0%
Total
95
100.0%
Ancestry in Lyden
The most populous ancestries reported in Lyden are , and Spanish (95 | 100.0%), together accounting for 100.0% of all Lyden residents.
Ancestry
# Population
% Population
Spanish
95
100.0%
View All 1 Rows
Immigrants in Lyden
Immigration Origin
# Population
% Population
View All 0 Rows
Sex and Age in Lyden
Sex and Age in Lyden
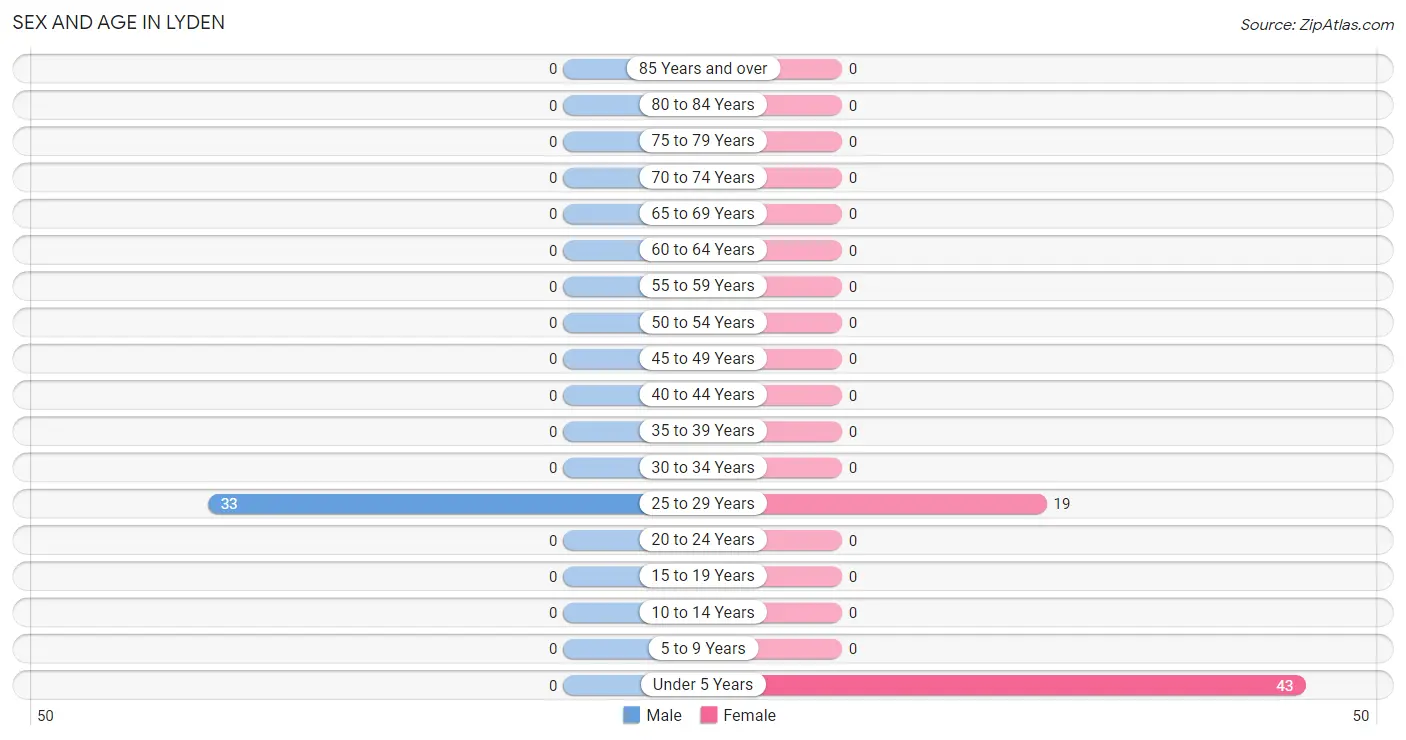
The most populous age groups in Lyden are 25 to 29 Years (33 | 100.0%) for men and Under 5 Years (43 | 69.4%) for women.
Age Bracket
Male
Female
Under 5 Years
0 (0.0%)
43 (69.4%)
5 to 9 Years
0 (0.0%)
0 (0.0%)
10 to 14 Years
0 (0.0%)
0 (0.0%)
15 to 19 Years
0 (0.0%)
0 (0.0%)
20 to 24 Years
0 (0.0%)
0 (0.0%)
25 to 29 Years
33 (100.0%)
19 (30.6%)
30 to 34 Years
0 (0.0%)
0 (0.0%)
35 to 39 Years
0 (0.0%)
0 (0.0%)
40 to 44 Years
0 (0.0%)
0 (0.0%)
45 to 49 Years
0 (0.0%)
0 (0.0%)
50 to 54 Years
0 (0.0%)
0 (0.0%)
55 to 59 Years
0 (0.0%)
0 (0.0%)
60 to 64 Years
0 (0.0%)
0 (0.0%)
65 to 69 Years
0 (0.0%)
0 (0.0%)
70 to 74 Years
0 (0.0%)
0 (0.0%)
75 to 79 Years
0 (0.0%)
0 (0.0%)
80 to 84 Years
0 (0.0%)
0 (0.0%)
85 Years and over
0 (0.0%)
0 (0.0%)
Total
33 (100.0%)
62 (100.0%)
Families and Households in Lyden
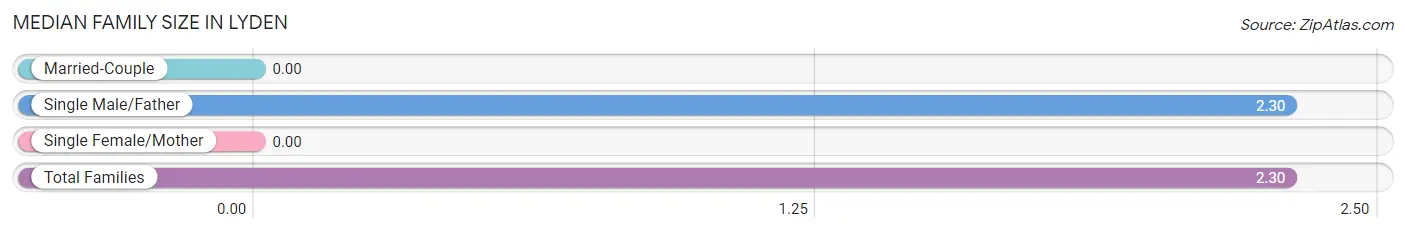
Median Family Size in Lyden
Family Type
# Families
Family Size
Married-Couple
0 (0.0%)
-
Single Male/Father
33 (100.0%)
2.30
Single Female/Mother
0 (0.0%)
-
Total Families
33 (100.0%)
2.30
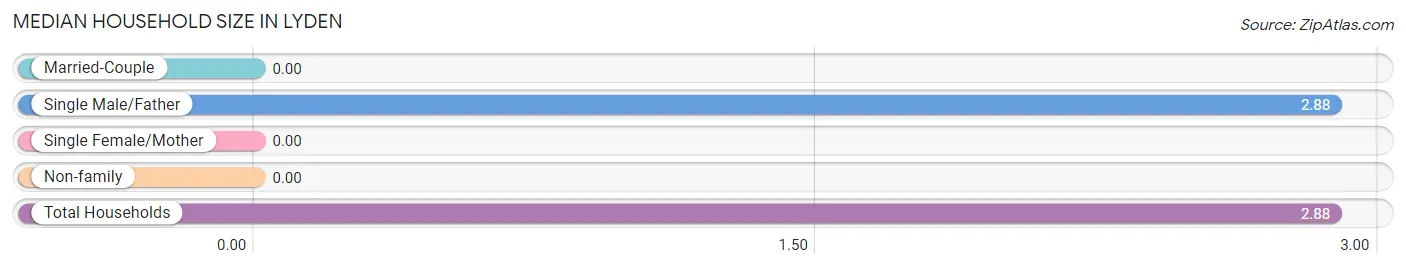
Median Household Size in Lyden
Household Type
# Households
Household Size
Married-Couple
0 (0.0%)
-
Single Male/Father
33 (100.0%)
2.88
Single Female/Mother
0 (0.0%)
-
Non-family
0 (0.0%)
-
Total Households
33 (100.0%)
2.88
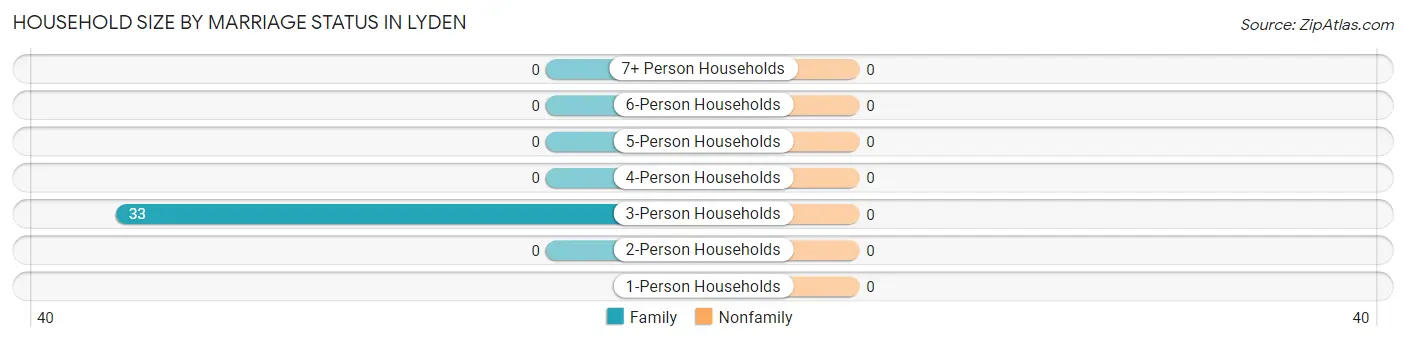
Household Size by Marriage Status in Lyden
Household Size
Family Households
Nonfamily Households
1-Person Households
-
0 (0.0%)
2-Person Households
0 (0.0%)
0 (0.0%)
3-Person Households
33 (100.0%)
0 (0.0%)
4-Person Households
0 (0.0%)
0 (0.0%)
5-Person Households
0 (0.0%)
0 (0.0%)
6-Person Households
0 (0.0%)
0 (0.0%)
7+ Person Households
0 (0.0%)
0 (0.0%)
Total
33 (100.0%)
0 (0.0%)
Female Fertility in Lyden
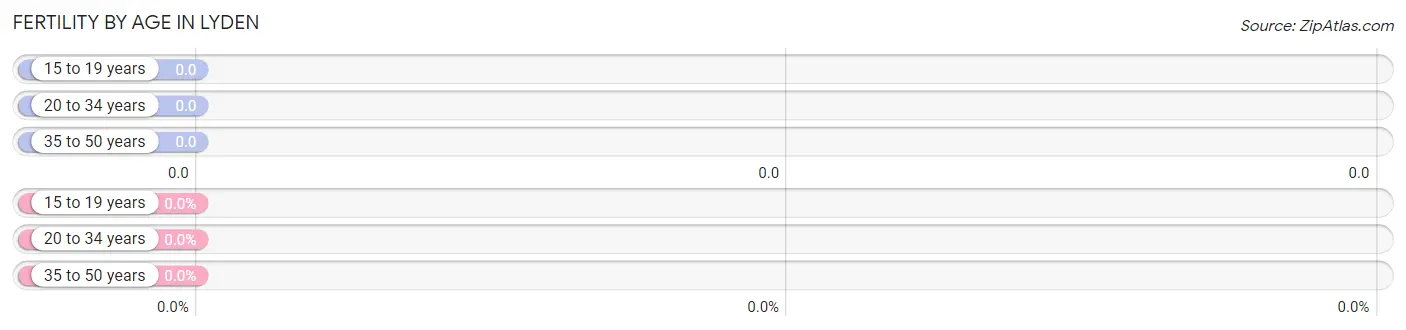
Fertility by Age in Lyden
Age Bracket
Women with Births
Births / 1,000 Women
15 to 19 years
0 (0.0%)
0.0
20 to 34 years
0 (0.0%)
0.0
35 to 50 years
0 (0.0%)
0.0
Total
0 (0.0%)
0.0
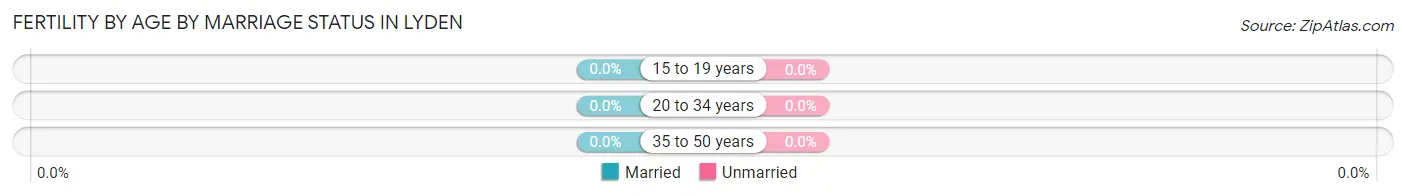
Fertility by Age by Marriage Status in Lyden
Age Bracket
Married
Unmarried
15 to 19 years
0 (0.0%)
0 (0.0%)
20 to 34 years
0 (0.0%)
0 (0.0%)
35 to 50 years
0 (0.0%)
0 (0.0%)
Total
0 (0.0%)
0 (0.0%)
Fertility by Education in Lyden
Educational Attainment
Women with Births
Births / 1,000 Women
Less than High School
0 (0.0%)
0.0
High School Diploma
0 (0.0%)
0.0
College or Associate's Degree
0 (0.0%)
0.0
Bachelor's Degree
0 (0.0%)
0.0
Graduate Degree
0 (0.0%)
0.0
Total
0 (0.0%)
0.0
Fertility by Education by Marriage Status in Lyden
Educational Attainment
Married
Unmarried
Less than High School
0 (0.0%)
0 (0.0%)
High School Diploma
0 (0.0%)
0 (0.0%)
College or Associate's Degree
0 (0.0%)
0 (0.0%)
Bachelor's Degree
0 (0.0%)
0 (0.0%)
Graduate Degree
0 (0.0%)
0 (0.0%)
Total
0 (0.0%)
0 (0.0%)
Income in Lyden
Income Overview in Lyden
Characteristic
Number
Measure
Per Capita Income
95
$0
Median Family Income
33
$0
Mean Family Income
33
$0
Median Household Income
33
$0
Mean Household Income
33
$0
Income Deficit
33
$0
Wage / Income Gap (%)
95
0.00%
Wage / Income Gap ($)
95
100.00¢ per $1
Gini / Inequality Index
95
0.00
Earnings by Sex in Lyden
Sex
Number
Average Earnings
Male
33 (63.5%)
$0
Female
19 (36.5%)
$0
Total
52 (100.0%)
$0
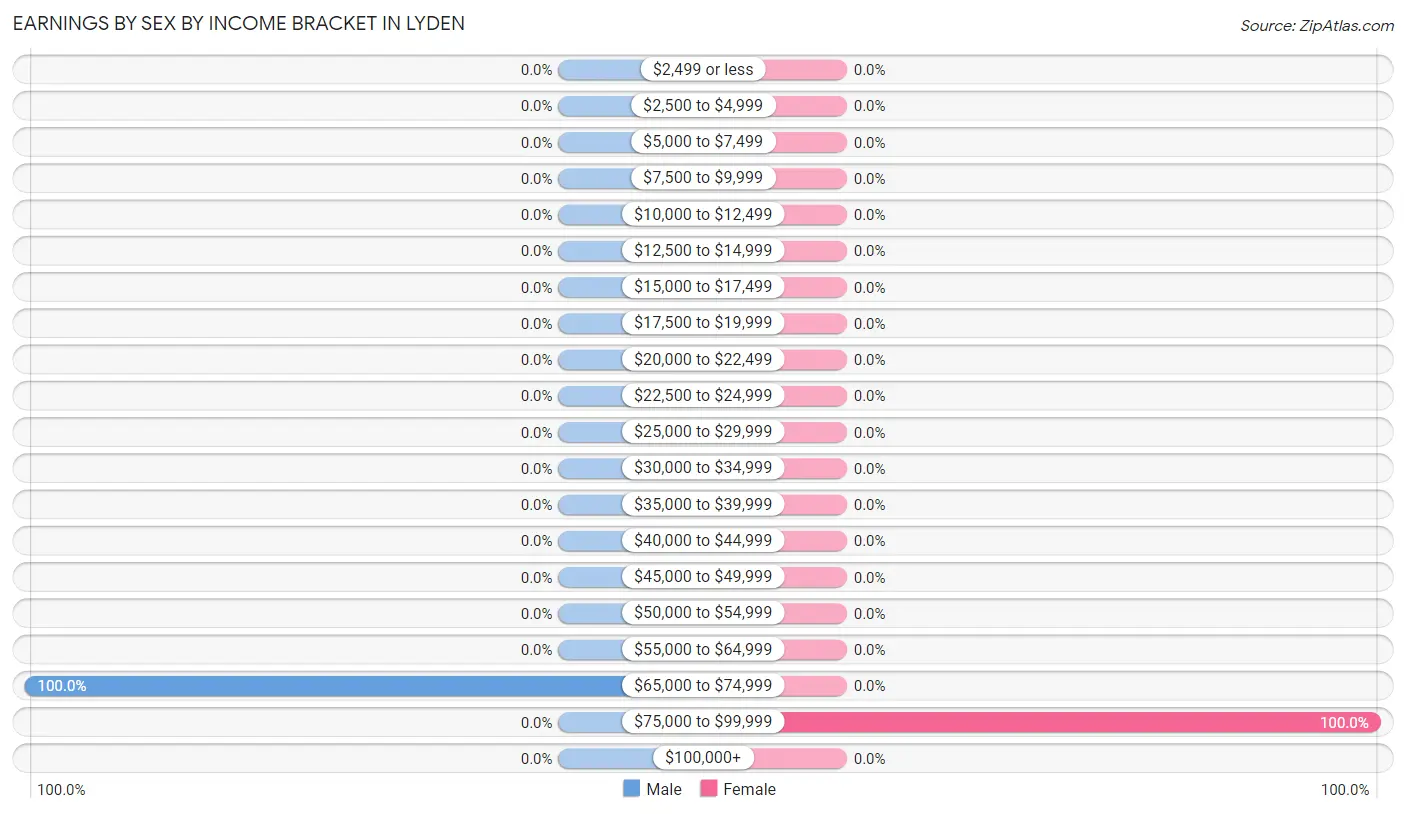
Earnings by Sex by Income Bracket in Lyden
The most common earnings brackets in Lyden are $65,000 to $74,999 for men (33 | 100.0%) and $75,000 to $99,999 for women (19 | 100.0%).
Income
Male
Female
$2,499 or less
0 (0.0%)
0 (0.0%)
$2,500 to $4,999
0 (0.0%)
0 (0.0%)
$5,000 to $7,499
0 (0.0%)
0 (0.0%)
$7,500 to $9,999
0 (0.0%)
0 (0.0%)
$10,000 to $12,499
0 (0.0%)
0 (0.0%)
$12,500 to $14,999
0 (0.0%)
0 (0.0%)
$15,000 to $17,499
0 (0.0%)
0 (0.0%)
$17,500 to $19,999
0 (0.0%)
0 (0.0%)
$20,000 to $22,499
0 (0.0%)
0 (0.0%)
$22,500 to $24,999
0 (0.0%)
0 (0.0%)
$25,000 to $29,999
0 (0.0%)
0 (0.0%)
$30,000 to $34,999
0 (0.0%)
0 (0.0%)
$35,000 to $39,999
0 (0.0%)
0 (0.0%)
$40,000 to $44,999
0 (0.0%)
0 (0.0%)
$45,000 to $49,999
0 (0.0%)
0 (0.0%)
$50,000 to $54,999
0 (0.0%)
0 (0.0%)
$55,000 to $64,999
0 (0.0%)
0 (0.0%)
$65,000 to $74,999
33 (100.0%)
0 (0.0%)
$75,000 to $99,999
0 (0.0%)
19 (100.0%)
$100,000+
0 (0.0%)
0 (0.0%)
Total
33 (100.0%)
19 (100.0%)
Earnings by Sex by Educational Attainment in Lyden
Educational Attainment
Male Income
Female Income
Less than High School
-
-
High School Diploma
-
-
College or Associate's Degree
-
-
Bachelor's Degree
-
-
Graduate Degree
-
-
Total
-
-
Family Income in Lyden
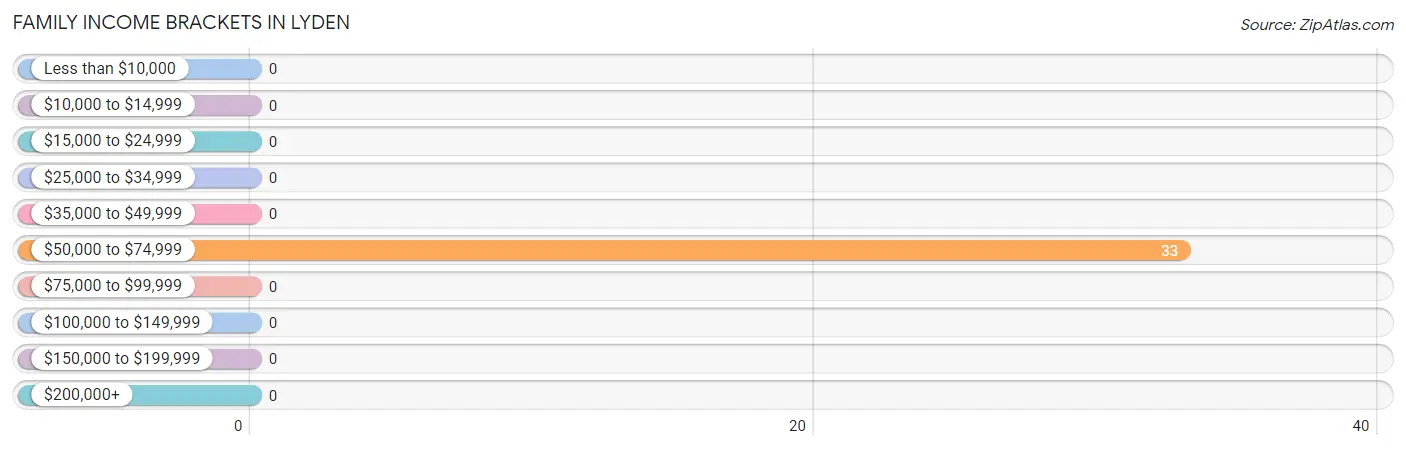
Family Income Brackets in Lyden
According to the Lyden family income data, there are 33 families falling into the $50,000 to $74,999 income range, which is the most common income bracket and makes up 100.0% of all families.
Income Bracket
# Families
% Families
Less than $10,000
0
0.0%
$10,000 to $14,999
0
0.0%
$15,000 to $24,999
0
0.0%
$25,000 to $34,999
0
0.0%
$35,000 to $49,999
0
0.0%
$50,000 to $74,999
33
100.0%
$75,000 to $99,999
0
0.0%
$100,000 to $149,999
0
0.0%
$150,000 to $199,999
0
0.0%
$200,000+
0
0.0%
Family Income by Famaliy Size in Lyden
Income Bracket
# Families
Median Income
2-Person Families
33 (100.0%)
$0
3-Person Families
0 (0.0%)
$0
4-Person Families
0 (0.0%)
$0
5-Person Families
0 (0.0%)
$0
6-Person Families
0 (0.0%)
$0
7+ Person Families
0 (0.0%)
$0
Total
33 (100.0%)
$0
Family Income by Number of Earners in Lyden
Number of Earners
# Families
Median Income
No Earners
0 (0.0%)
$0
1 Earner
33 (100.0%)
$0
2 Earners
0 (0.0%)
$0
3+ Earners
0 (0.0%)
$0
Total
33 (100.0%)
$0
Household Income in Lyden
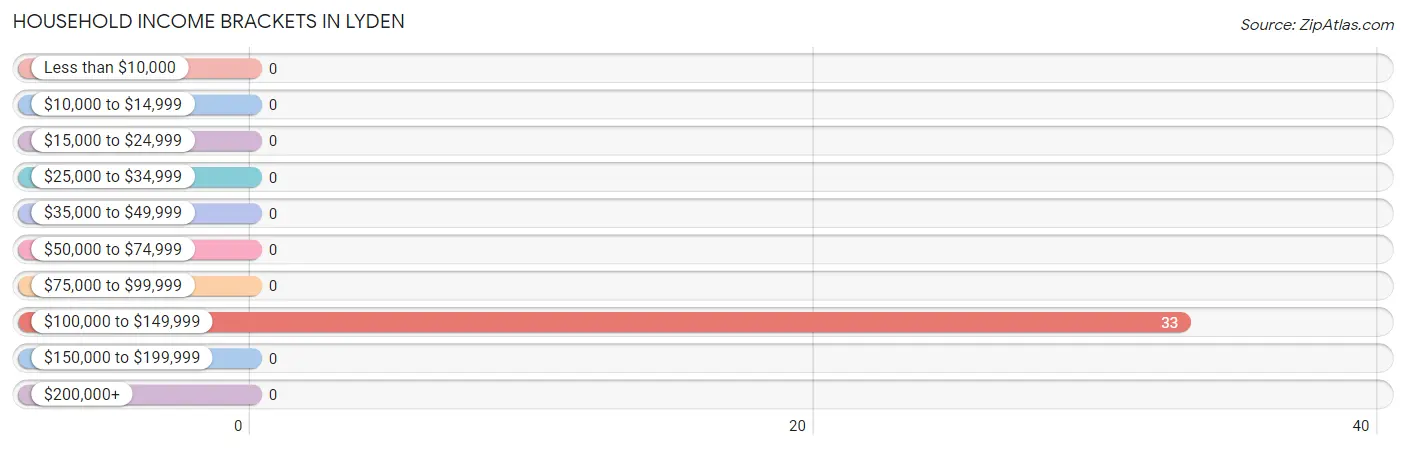
Household Income Brackets in Lyden
With 33 households falling in the category, the $100,000 to $149,999 income range is the most frequent in Lyden, accounting for 100.0% of all households.
Income Bracket
# Households
% Households
Less than $10,000
0
0.0%
$10,000 to $14,999
0
0.0%
$15,000 to $24,999
0
0.0%
$25,000 to $34,999
0
0.0%
$35,000 to $49,999
0
0.0%
$50,000 to $74,999
0
0.0%
$75,000 to $99,999
0
0.0%
$100,000 to $149,999
33
100.0%
$150,000 to $199,999
0
0.0%
$200,000+
0
0.0%
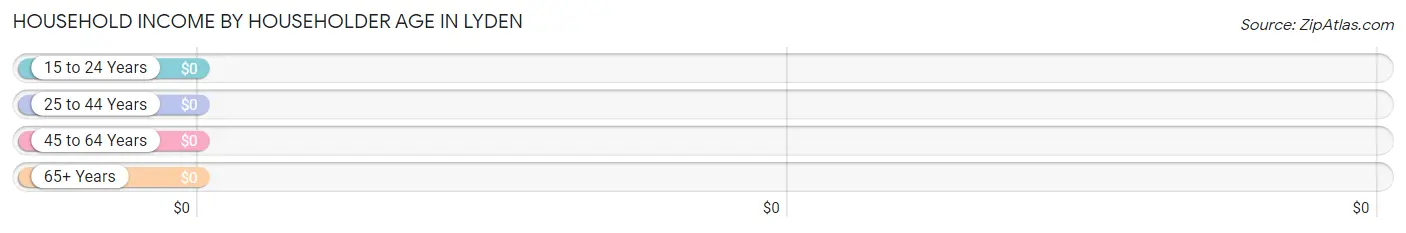
Household Income by Householder Age in Lyden
Income Bracket
# Households
Median Income
15 to 24 Years
0 (0.0%)
$0
25 to 44 Years
33 (100.0%)
$0
45 to 64 Years
0 (0.0%)
$0
65+ Years
0 (0.0%)
$0
Total
33 (100.0%)
$0
Poverty in Lyden
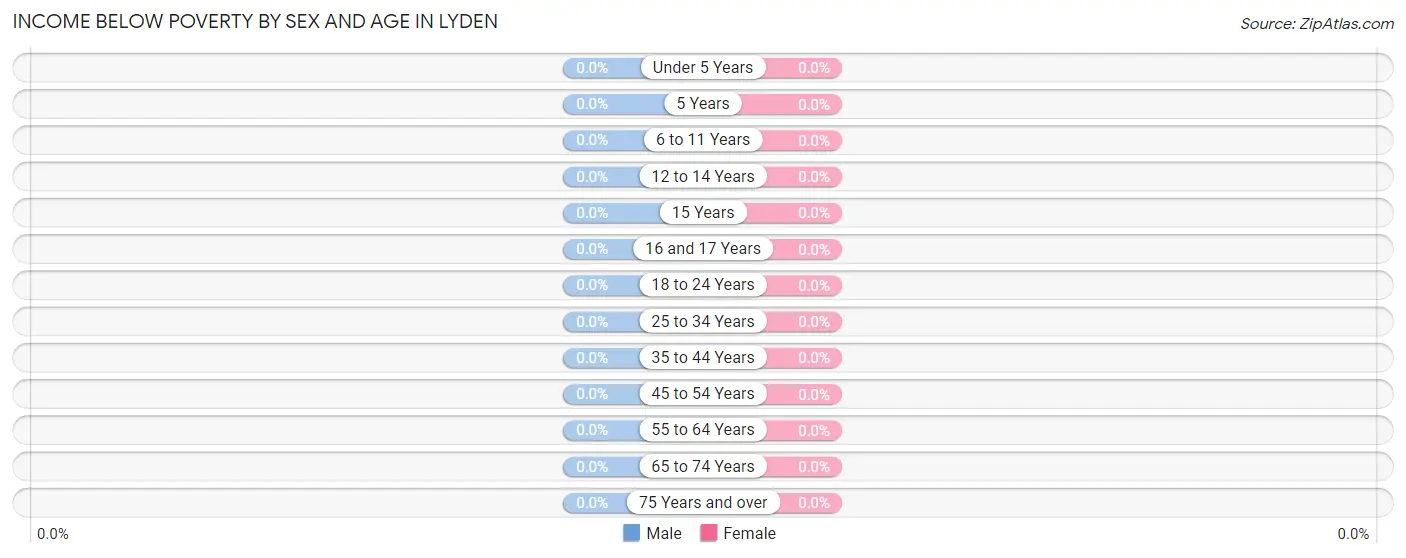
Income Below Poverty by Sex and Age in Lyden
Age Bracket
Male
Female
Under 5 Years
0 (0.0%)
0 (0.0%)
5 Years
0 (0.0%)
0 (0.0%)
6 to 11 Years
0 (0.0%)
0 (0.0%)
12 to 14 Years
0 (0.0%)
0 (0.0%)
15 Years
0 (0.0%)
0 (0.0%)
16 and 17 Years
0 (0.0%)
0 (0.0%)
18 to 24 Years
0 (0.0%)
0 (0.0%)
25 to 34 Years
0 (0.0%)
0 (0.0%)
35 to 44 Years
0 (0.0%)
0 (0.0%)
45 to 54 Years
0 (0.0%)
0 (0.0%)
55 to 64 Years
0 (0.0%)
0 (0.0%)
65 to 74 Years
0 (0.0%)
0 (0.0%)
75 Years and over
0 (0.0%)
0 (0.0%)
Total
0 (0.0%)
0 (0.0%)
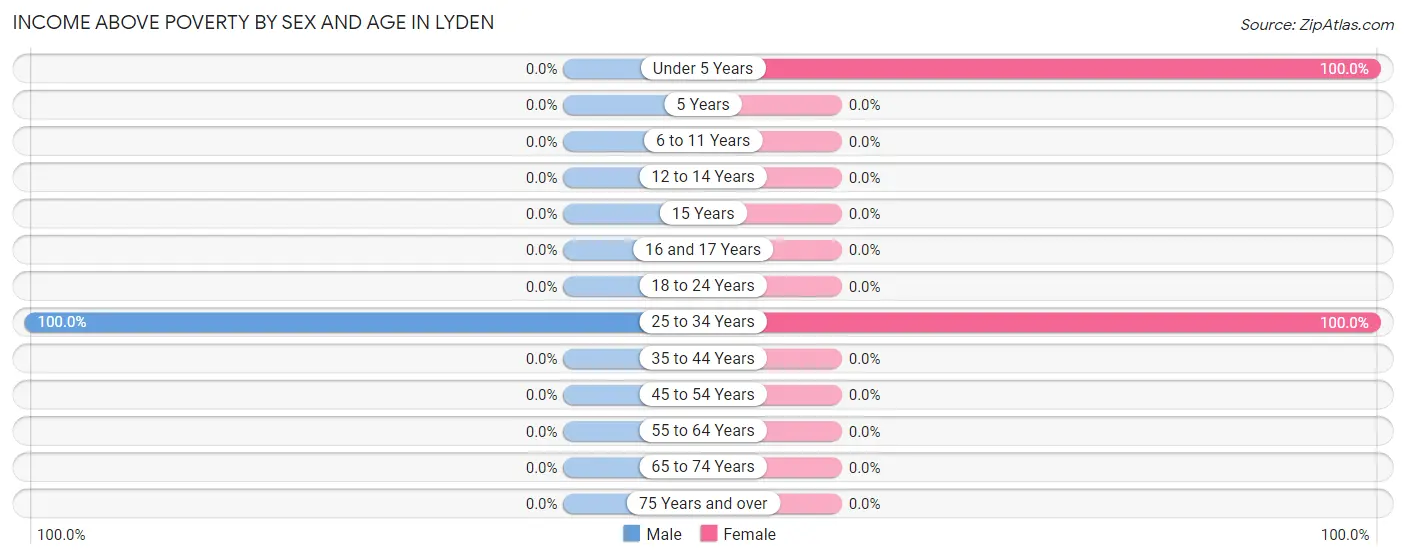
Income Above Poverty by Sex and Age in Lyden
According to the poverty statistics in Lyden, males aged 25 to 34 years and females aged under 5 years are the age groups that are most secure financially, with 100.0% of males and 100.0% of females in these age groups living above the poverty line.
Age Bracket
Male
Female
Under 5 Years
0 (0.0%)
43 (100.0%)
5 Years
0 (0.0%)
0 (0.0%)
6 to 11 Years
0 (0.0%)
0 (0.0%)
12 to 14 Years
0 (0.0%)
0 (0.0%)
15 Years
0 (0.0%)
0 (0.0%)
16 and 17 Years
0 (0.0%)
0 (0.0%)
18 to 24 Years
0 (0.0%)
0 (0.0%)
25 to 34 Years
33 (100.0%)
19 (100.0%)
35 to 44 Years
0 (0.0%)
0 (0.0%)
45 to 54 Years
0 (0.0%)
0 (0.0%)
55 to 64 Years
0 (0.0%)
0 (0.0%)
65 to 74 Years
0 (0.0%)
0 (0.0%)
75 Years and over
0 (0.0%)
0 (0.0%)
Total
33 (100.0%)
62 (100.0%)
Income Below Poverty Among Married-Couple Families in Lyden
Children
Above Poverty
Below Poverty
No Children
0 (0.0%)
0 (0.0%)
1 or 2 Children
0 (0.0%)
0 (0.0%)
3 or 4 Children
0 (0.0%)
0 (0.0%)
5 or more Children
0 (0.0%)
0 (0.0%)
Total
0 (0.0%)
0 (0.0%)
Income Below Poverty Among Single-Parent Households in Lyden
Children
Single Father
Single Mother
No Children
0 (0.0%)
0 (0.0%)
1 or 2 Children
0 (0.0%)
0 (0.0%)
3 or 4 Children
0 (0.0%)
0 (0.0%)
5 or more Children
0 (0.0%)
0 (0.0%)
Total
0 (0.0%)
0 (0.0%)
Income Below Poverty Among Married-Couple vs Single-Parent Households in Lyden
Children
Married-Couple Families
Single-Parent Households
No Children
0 (0.0%)
0 (0.0%)
1 or 2 Children
0 (0.0%)
0 (0.0%)
3 or 4 Children
0 (0.0%)
0 (0.0%)
5 or more Children
0 (0.0%)
0 (0.0%)
Total
0 (0.0%)
0 (0.0%)
Employment Characteristics in Lyden
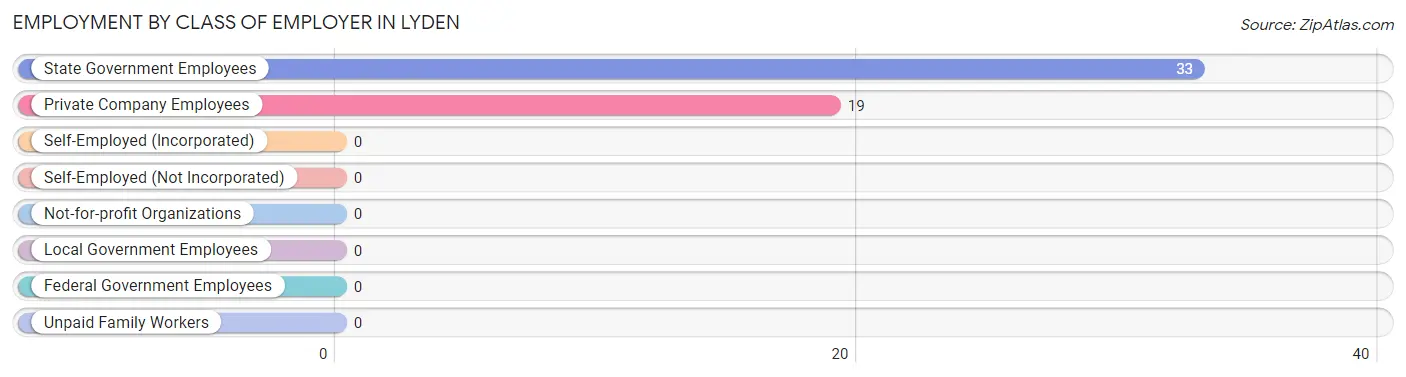
Employment by Class of Employer in Lyden
Among the 52 employed individuals in Lyden, state government employees (33 | 63.5%), and private company employees (19 | 36.5%) make up the most common classes of employment.
Employer Class
# Employees
% Employees
Private Company Employees
19
36.5%
Self-Employed (Incorporated)
0
0.0%
Self-Employed (Not Incorporated)
0
0.0%
Not-for-profit Organizations
0
0.0%
Local Government Employees
0
0.0%
State Government Employees
33
63.5%
Federal Government Employees
0
0.0%
Unpaid Family Workers
0
0.0%
Total
52
100.0%
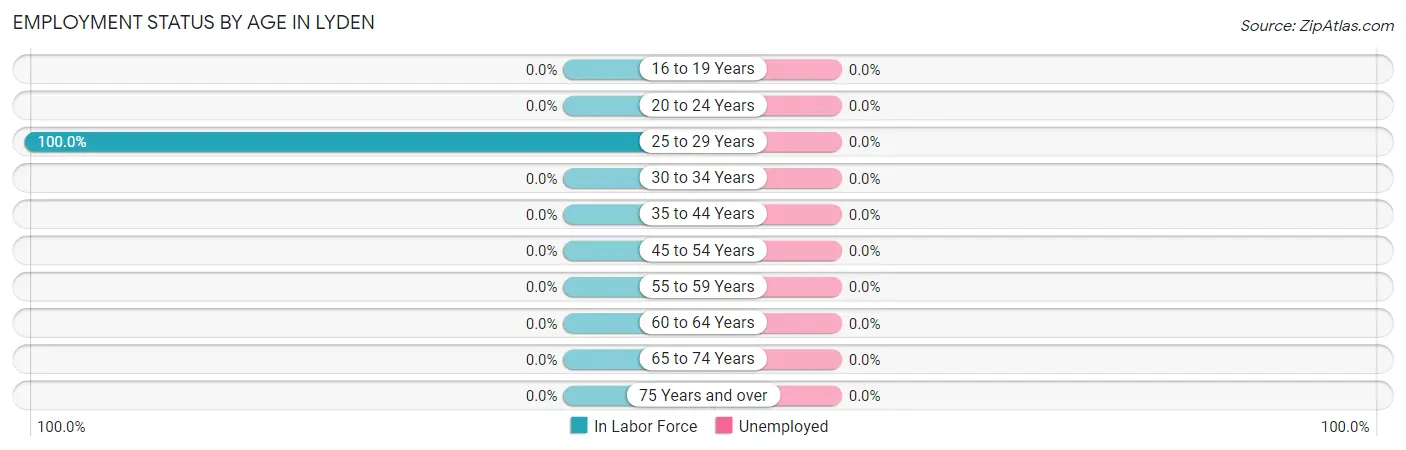
Employment Status by Age in Lyden
Age Bracket
In Labor Force
Unemployed
16 to 19 Years
0 (0.0%)
0 (0.0%)
20 to 24 Years
0 (0.0%)
0 (0.0%)
25 to 29 Years
52 (100.0%)
0 (0.0%)
30 to 34 Years
0 (0.0%)
0 (0.0%)
35 to 44 Years
0 (0.0%)
0 (0.0%)
45 to 54 Years
0 (0.0%)
0 (0.0%)
55 to 59 Years
0 (0.0%)
0 (0.0%)
60 to 64 Years
0 (0.0%)
0 (0.0%)
65 to 74 Years
0 (0.0%)
0 (0.0%)
75 Years and over
0 (0.0%)
0 (0.0%)
Total
52 (100.0%)
0 (0.0%)
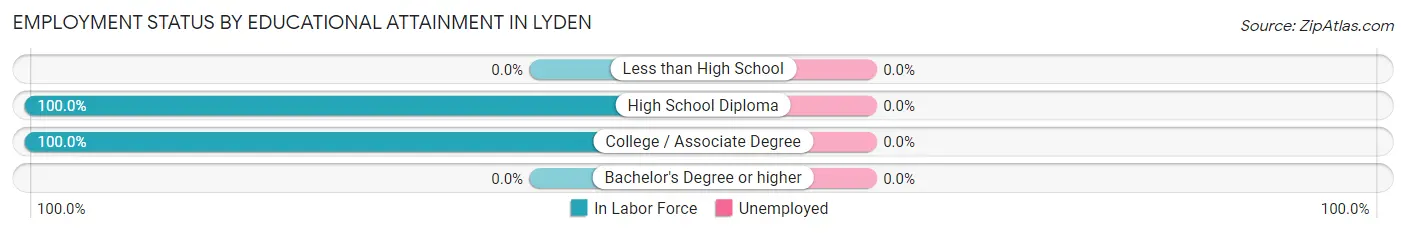
Employment Status by Educational Attainment in Lyden
Educational Attainment
In Labor Force
Unemployed
Less than High School
0 (0.0%)
0 (0.0%)
High School Diploma
19 (100.0%)
0 (0.0%)
College / Associate Degree
33 (100.0%)
0 (0.0%)
Bachelor's Degree or higher
0 (0.0%)
0 (0.0%)
Total
52 (100.0%)
0 (0.0%)
Employment Occupations by Sex in Lyden
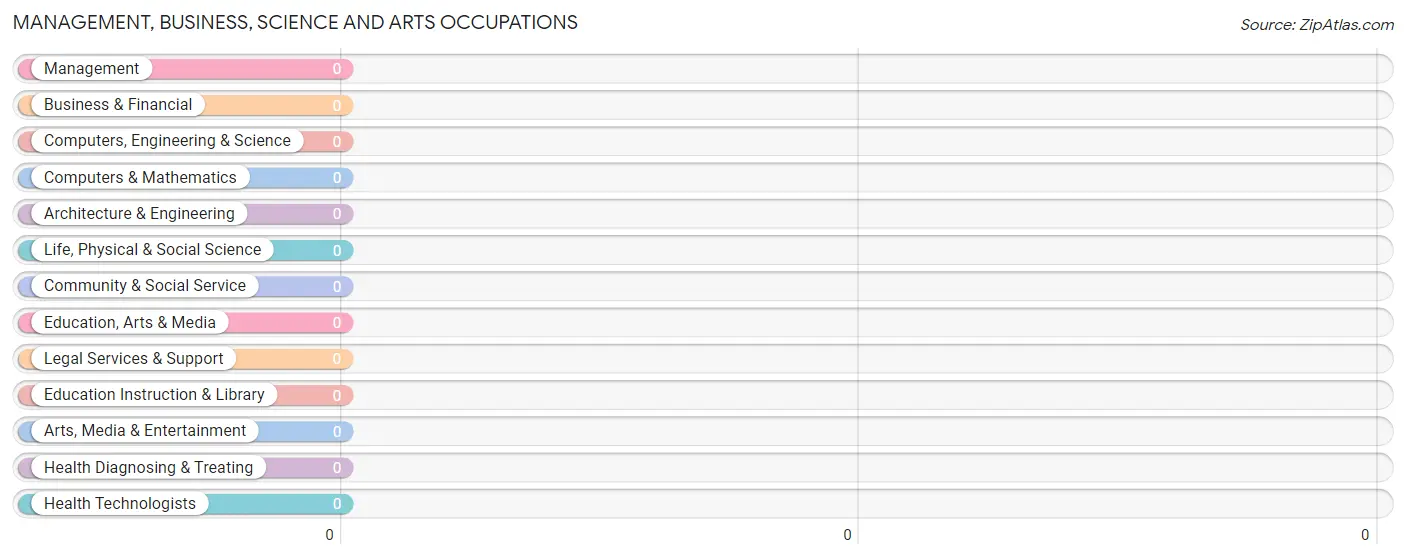
Management, Business, Science and Arts Occupations
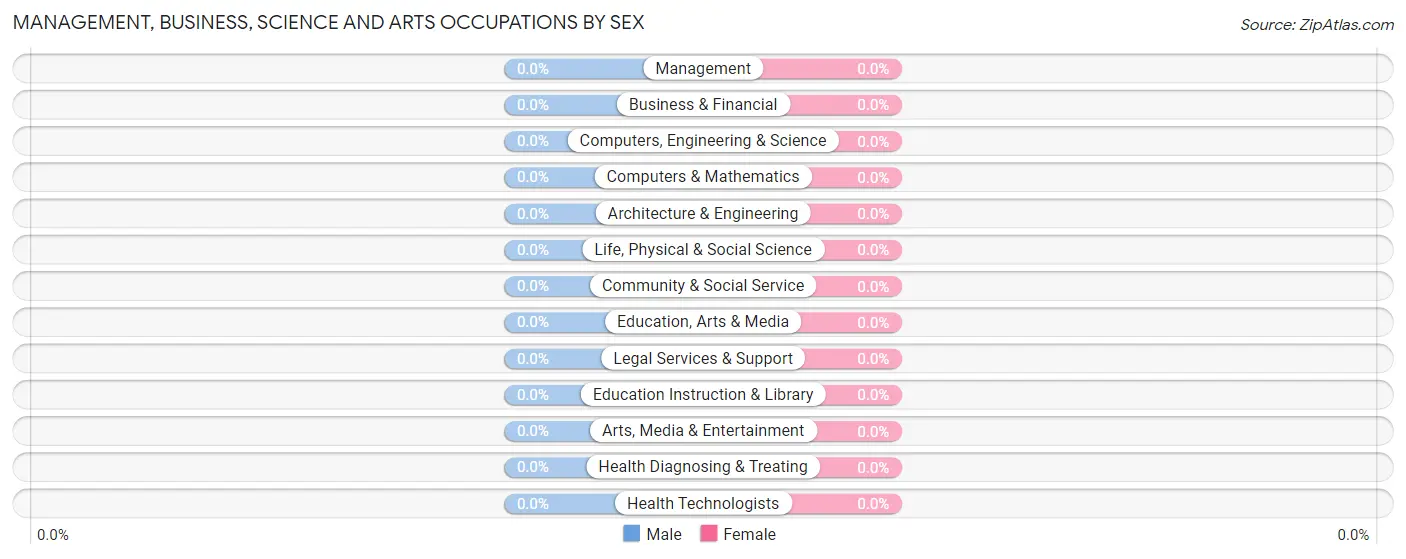
Management, Business, Science and Arts Occupations by Sex
Occupation
Male
Female
Management
0 (0.0%)
0 (0.0%)
Business & Financial
0 (0.0%)
0 (0.0%)
Computers, Engineering & Science
0 (0.0%)
0 (0.0%)
Computers & Mathematics
0 (0.0%)
0 (0.0%)
Architecture & Engineering
0 (0.0%)
0 (0.0%)
Life, Physical & Social Science
0 (0.0%)
0 (0.0%)
Community & Social Service
0 (0.0%)
0 (0.0%)
Education, Arts & Media
0 (0.0%)
0 (0.0%)
Legal Services & Support
0 (0.0%)
0 (0.0%)
Education Instruction & Library
0 (0.0%)
0 (0.0%)
Arts, Media & Entertainment
0 (0.0%)
0 (0.0%)
Health Diagnosing & Treating
0 (0.0%)
0 (0.0%)
Health Technologists
0 (0.0%)
0 (0.0%)
Total (Category)
0 (0.0%)
0 (0.0%)
Total (Overall)
33 (63.5%)
19 (36.5%)
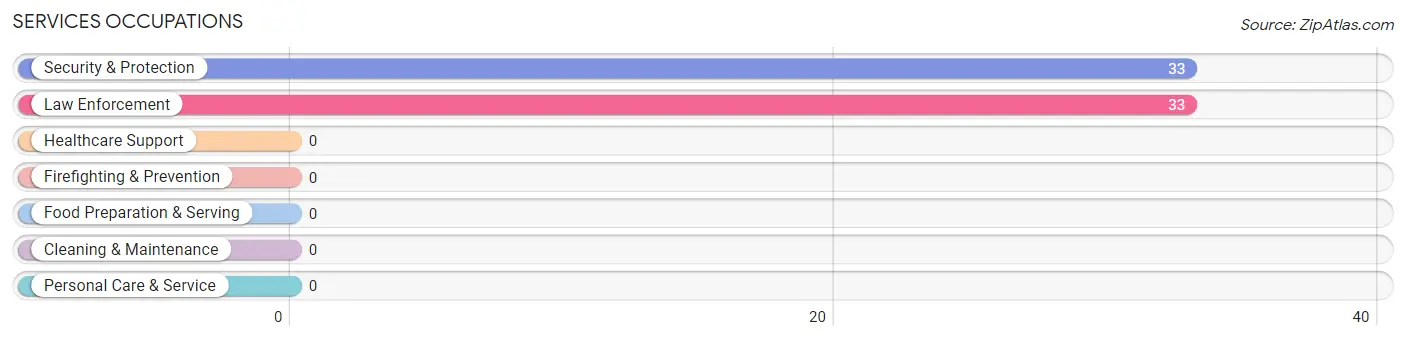
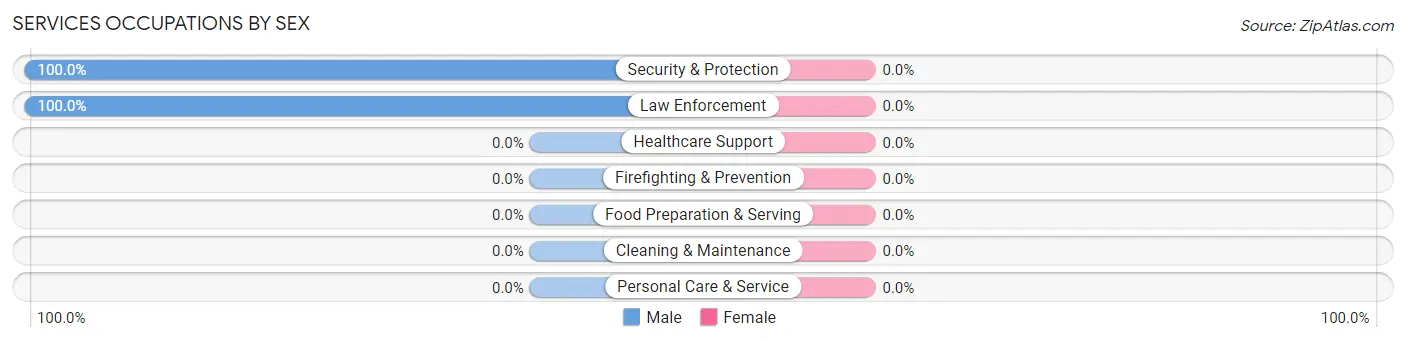
Services Occupations
The most common Services occupations in Lyden are Security & Protection (33 | 63.5%), and Law Enforcement (33 | 63.5%).
Services Occupations by Sex
Occupation
Male
Female
Healthcare Support
0 (0.0%)
0 (0.0%)
Security & Protection
33 (100.0%)
0 (0.0%)
Firefighting & Prevention
0 (0.0%)
0 (0.0%)
Law Enforcement
33 (100.0%)
0 (0.0%)
Food Preparation & Serving
0 (0.0%)
0 (0.0%)
Cleaning & Maintenance
0 (0.0%)
0 (0.0%)
Personal Care & Service
0 (0.0%)
0 (0.0%)
Total (Category)
33 (100.0%)
0 (0.0%)
Total (Overall)
33 (63.5%)
19 (36.5%)
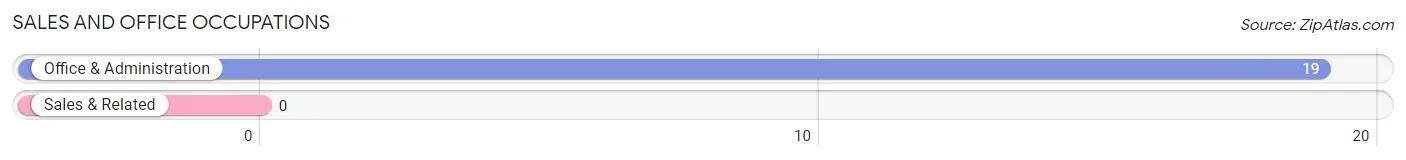
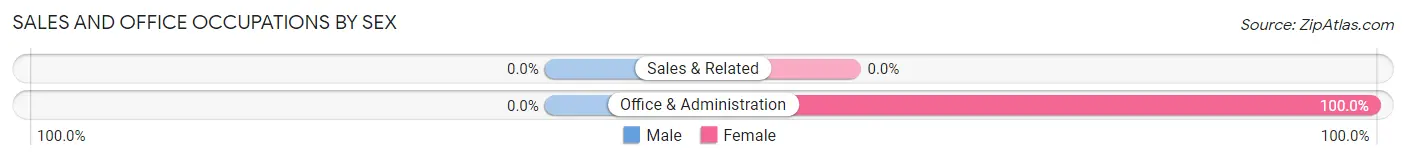
Sales and Office Occupations
The most common Sales and Office occupations in Lyden are , and Office & Administration (19 | 36.5%).
Sales and Office Occupations by Sex
Occupation
Male
Female
Sales & Related
0 (0.0%)
0 (0.0%)
Office & Administration
0 (0.0%)
19 (100.0%)
Total (Category)
0 (0.0%)
19 (100.0%)
Total (Overall)
33 (63.5%)
19 (36.5%)
Natural Resources, Construction and Maintenance Occupations
Natural Resources, Construction and Maintenance Occupations by Sex
Occupation
Male
Female
Farming, Fishing & Forestry
0 (0.0%)
0 (0.0%)
Construction & Extraction
0 (0.0%)
0 (0.0%)
Installation, Maintenance & Repair
0 (0.0%)
0 (0.0%)
Total (Category)
0 (0.0%)
0 (0.0%)
Total (Overall)
33 (63.5%)
19 (36.5%)
Production, Transportation and Moving Occupations
Production, Transportation and Moving Occupations by Sex
Occupation
Male
Female
Production
0 (0.0%)
0 (0.0%)
Transportation
0 (0.0%)
0 (0.0%)
Material Moving
0 (0.0%)
0 (0.0%)
Total (Category)
0 (0.0%)
0 (0.0%)
Total (Overall)
33 (63.5%)
19 (36.5%)
Employment Industries by Sex in Lyden
Employment Industries in Lyden
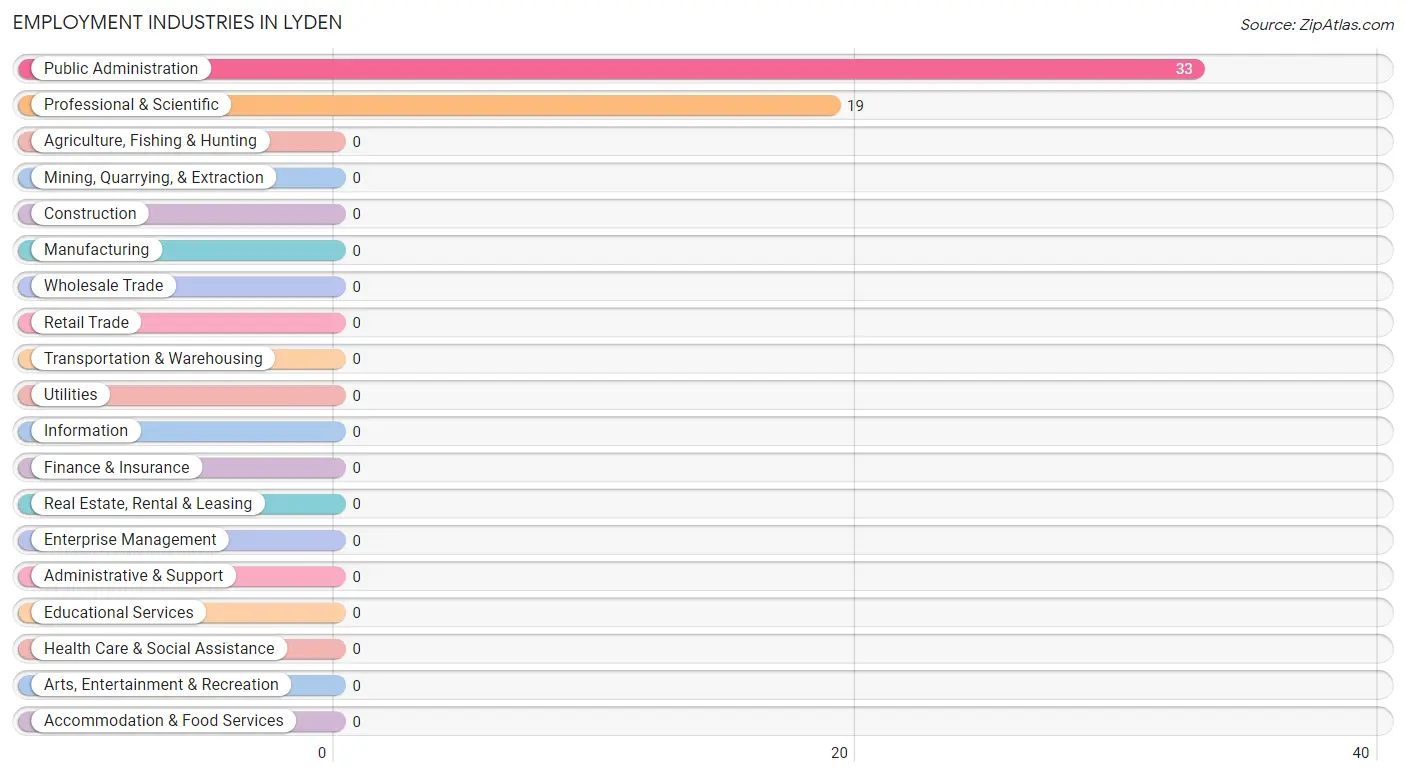
The major employment industries in Lyden include Public Administration (33 | 63.5%), and Professional & Scientific (19 | 36.5%).
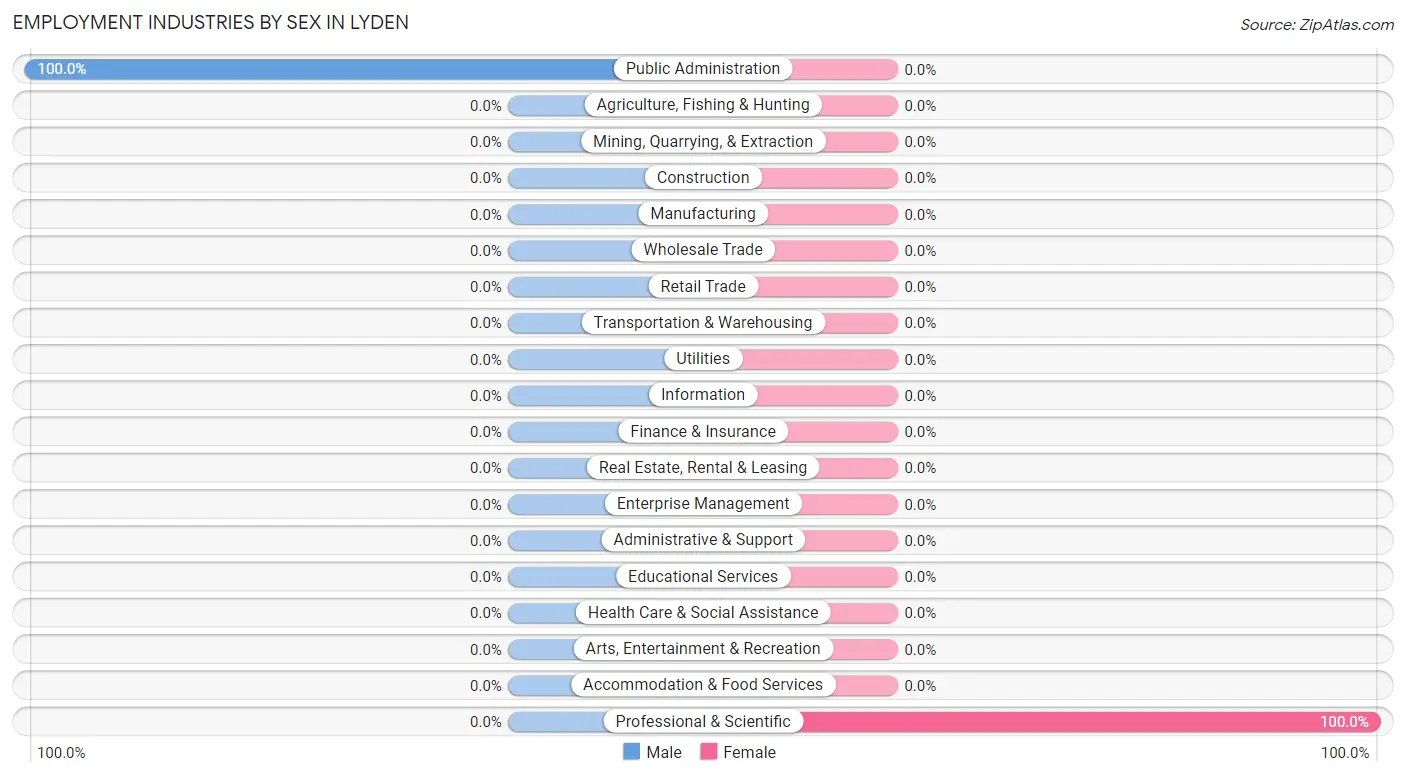
Employment Industries by Sex in Lyden
Industry
Male
Female
Agriculture, Fishing & Hunting
0 (0.0%)
0 (0.0%)
Mining, Quarrying, & Extraction
0 (0.0%)
0 (0.0%)
Construction
0 (0.0%)
0 (0.0%)
Manufacturing
0 (0.0%)
0 (0.0%)
Wholesale Trade
0 (0.0%)
0 (0.0%)
Retail Trade
0 (0.0%)
0 (0.0%)
Transportation & Warehousing
0 (0.0%)
0 (0.0%)
Utilities
0 (0.0%)
0 (0.0%)
Information
0 (0.0%)
0 (0.0%)
Finance & Insurance
0 (0.0%)
0 (0.0%)
Real Estate, Rental & Leasing
0 (0.0%)
0 (0.0%)
Professional & Scientific
0 (0.0%)
19 (100.0%)
Enterprise Management
0 (0.0%)
0 (0.0%)
Administrative & Support
0 (0.0%)
0 (0.0%)
Educational Services
0 (0.0%)
0 (0.0%)
Health Care & Social Assistance
0 (0.0%)
0 (0.0%)
Arts, Entertainment & Recreation
0 (0.0%)
0 (0.0%)
Accommodation & Food Services
0 (0.0%)
0 (0.0%)
Public Administration
33 (100.0%)
0 (0.0%)
Total
33 (63.5%)
19 (36.5%)
Education in Lyden
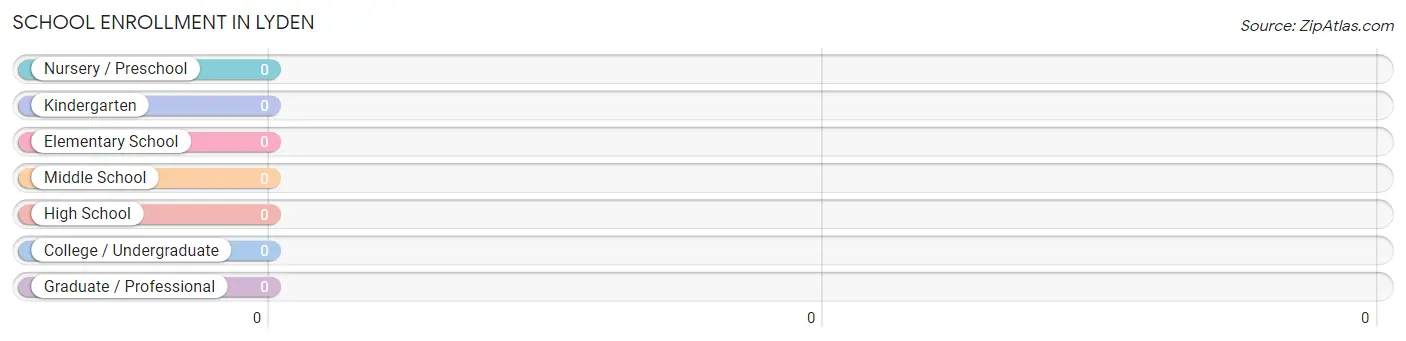
School Enrollment in Lyden
School Level
# Students
% Students
Nursery / Preschool
0
0.0%
Kindergarten
0
0.0%
Elementary School
0
0.0%
Middle School
0
0.0%
High School
0
0.0%
College / Undergraduate
0
0.0%
Graduate / Professional
0
0.0%
Total
0
0.0%
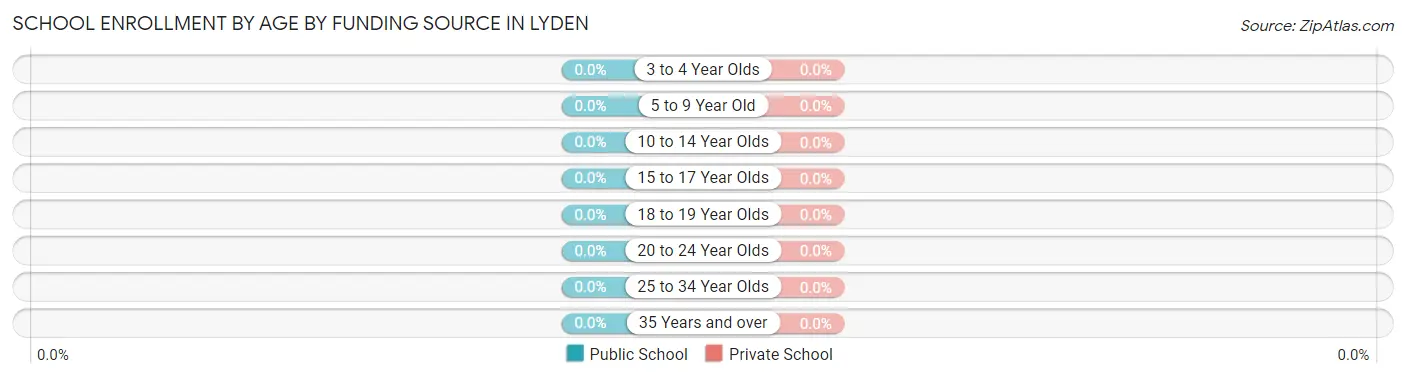
School Enrollment by Age by Funding Source in Lyden
Age Bracket
Public School
Private School
3 to 4 Year Olds
0 (0.0%)
0 (0.0%)
5 to 9 Year Old
0 (0.0%)
0 (0.0%)
10 to 14 Year Olds
0 (0.0%)
0 (0.0%)
15 to 17 Year Olds
0 (0.0%)
0 (0.0%)
18 to 19 Year Olds
0 (0.0%)
0 (0.0%)
20 to 24 Year Olds
0 (0.0%)
0 (0.0%)
25 to 34 Year Olds
0 (0.0%)
0 (0.0%)
35 Years and over
0 (0.0%)
0 (0.0%)
Total
0 (0.0%)
0 (0.0%)
Educational Attainment by Field of Study in Lyden
Field of Study
# Graduates
% Graduates
Computers & Mathematics
0
0.0%
Bio, Nature & Agricultural
0
0.0%
Physical & Health Sciences
0
0.0%
Psychology
0
0.0%
Social Sciences
0
0.0%
Engineering
0
0.0%
Multidisciplinary Studies
0
0.0%
Science & Technology
0
0.0%
Business
0
0.0%
Education
0
0.0%
Literature & Languages
0
0.0%
Liberal Arts & History
0
0.0%
Visual & Performing Arts
0
0.0%
Communications
0
0.0%
Arts & Humanities
0
0.0%
Total
0
0.0%
Transportation & Commute in Lyden
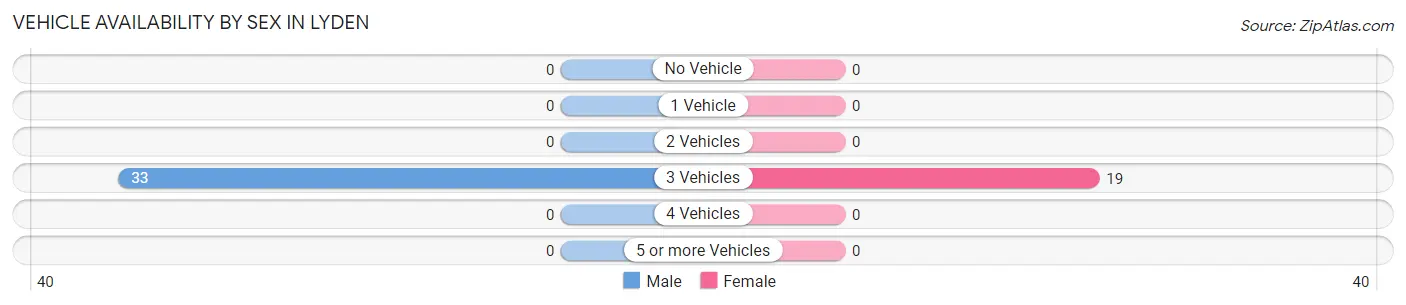
Vehicle Availability by Sex in Lyden
The most prevalent vehicle ownership categories in Lyden are males with 3 vehicles (33, accounting for 100.0%) and females with 3 vehicles (19, making up 173.7%).
Vehicles Available
Male
Female
No Vehicle
0 (0.0%)
0 (0.0%)
1 Vehicle
0 (0.0%)
0 (0.0%)
2 Vehicles
0 (0.0%)
0 (0.0%)
3 Vehicles
33 (100.0%)
19 (100.0%)
4 Vehicles
0 (0.0%)
0 (0.0%)
5 or more Vehicles
0 (0.0%)
0 (0.0%)
Total
33 (100.0%)
19 (100.0%)
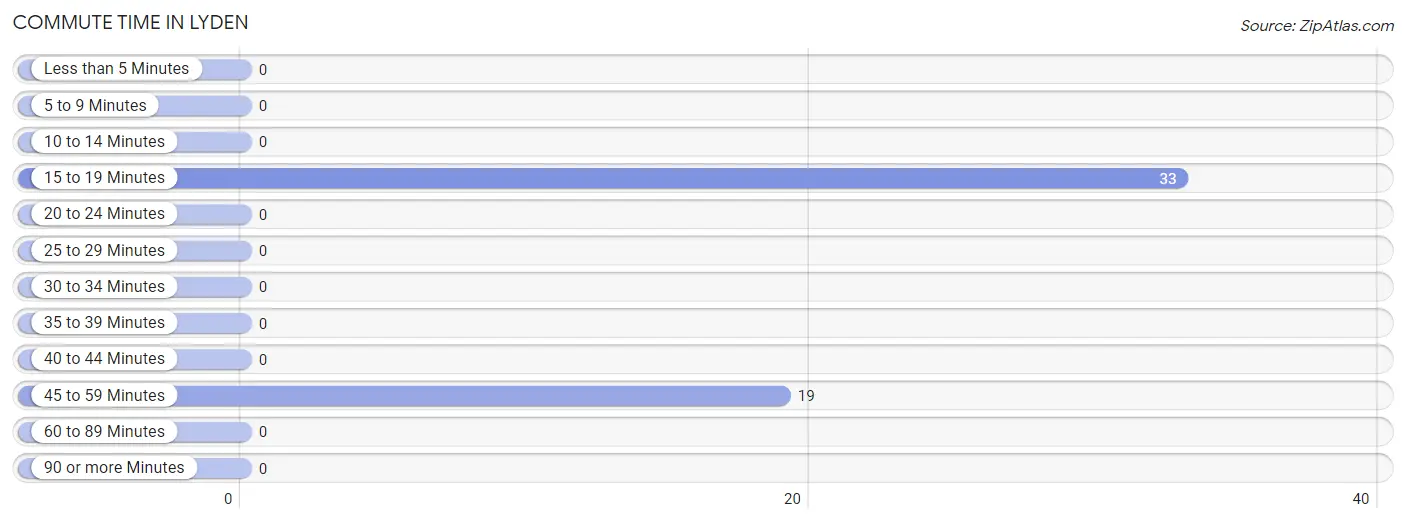
Commute Time in Lyden
The most frequently occuring commute durations in Lyden are 15 to 19 minutes (33 commuters, 63.5%), 45 to 59 minutes (19 commuters, 36.5%), and less than 5 minutes (0 commuters, 0.0%).
Commute Time
# Commuters
% Commuters
Less than 5 Minutes
0
0.0%
5 to 9 Minutes
0
0.0%
10 to 14 Minutes
0
0.0%
15 to 19 Minutes
33
63.5%
20 to 24 Minutes
0
0.0%
25 to 29 Minutes
0
0.0%
30 to 34 Minutes
0
0.0%
35 to 39 Minutes
0
0.0%
40 to 44 Minutes
0
0.0%
45 to 59 Minutes
19
36.5%
60 to 89 Minutes
0
0.0%
90 or more Minutes
0
0.0%
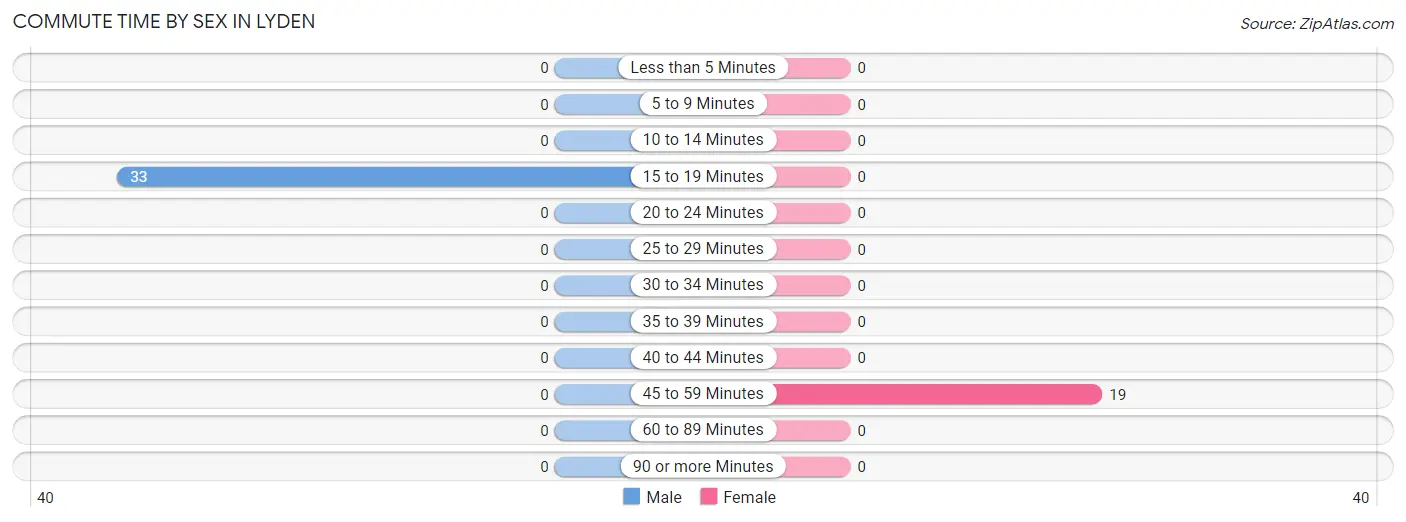
Commute Time by Sex in Lyden
The most common commute times in Lyden are 15 to 19 minutes (33 commuters, 100.0%) for males and 45 to 59 minutes (19 commuters, 100.0%) for females.
Commute Time
Male
Female
Less than 5 Minutes
0 (0.0%)
0 (0.0%)
5 to 9 Minutes
0 (0.0%)
0 (0.0%)
10 to 14 Minutes
0 (0.0%)
0 (0.0%)
15 to 19 Minutes
33 (100.0%)
0 (0.0%)
20 to 24 Minutes
0 (0.0%)
0 (0.0%)
25 to 29 Minutes
0 (0.0%)
0 (0.0%)
30 to 34 Minutes
0 (0.0%)
0 (0.0%)
35 to 39 Minutes
0 (0.0%)
0 (0.0%)
40 to 44 Minutes
0 (0.0%)
0 (0.0%)
45 to 59 Minutes
0 (0.0%)
19 (100.0%)
60 to 89 Minutes
0 (0.0%)
0 (0.0%)
90 or more Minutes
0 (0.0%)
0 (0.0%)
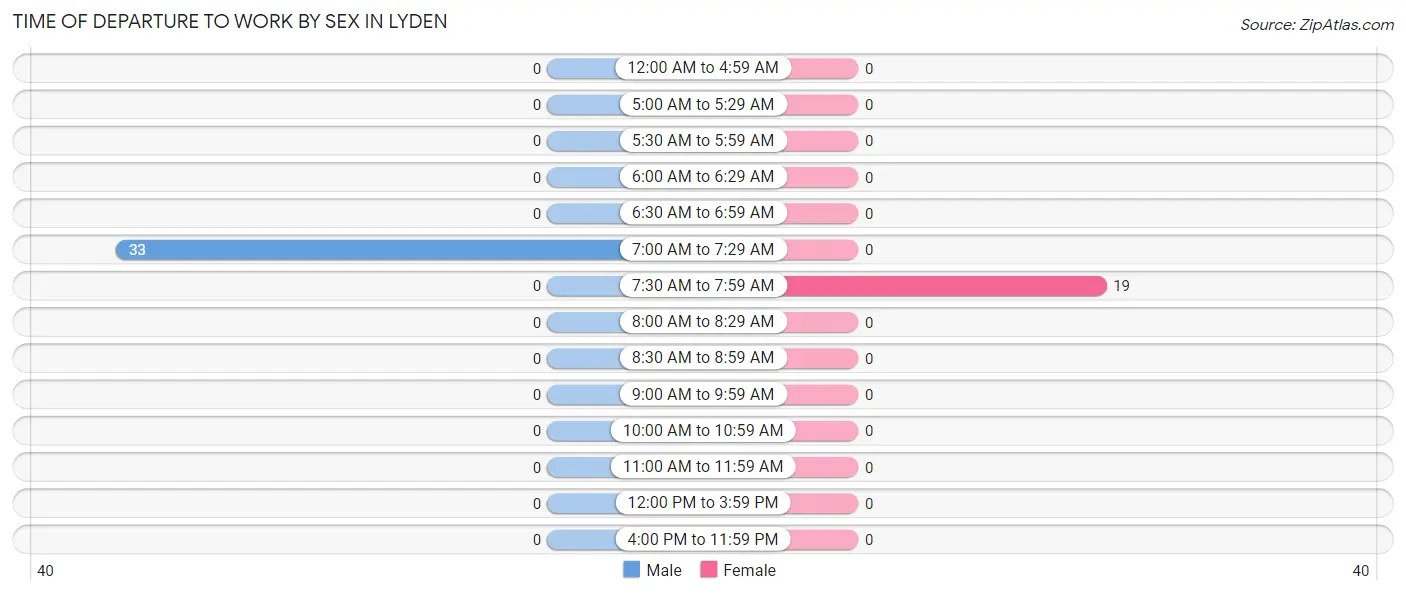
Time of Departure to Work by Sex in Lyden
The most frequent times of departure to work in Lyden are 7:00 AM to 7:29 AM (33, 100.0%) for males and 7:30 AM to 7:59 AM (19, 100.0%) for females.
Time of Departure
Male
Female
12:00 AM to 4:59 AM
0 (0.0%)
0 (0.0%)
5:00 AM to 5:29 AM
0 (0.0%)
0 (0.0%)
5:30 AM to 5:59 AM
0 (0.0%)
0 (0.0%)
6:00 AM to 6:29 AM
0 (0.0%)
0 (0.0%)
6:30 AM to 6:59 AM
0 (0.0%)
0 (0.0%)
7:00 AM to 7:29 AM
33 (100.0%)
0 (0.0%)
7:30 AM to 7:59 AM
0 (0.0%)
19 (100.0%)
8:00 AM to 8:29 AM
0 (0.0%)
0 (0.0%)
8:30 AM to 8:59 AM
0 (0.0%)
0 (0.0%)
9:00 AM to 9:59 AM
0 (0.0%)
0 (0.0%)
10:00 AM to 10:59 AM
0 (0.0%)
0 (0.0%)
11:00 AM to 11:59 AM
0 (0.0%)
0 (0.0%)
12:00 PM to 3:59 PM
0 (0.0%)
0 (0.0%)
4:00 PM to 11:59 PM
0 (0.0%)
0 (0.0%)
Total
33 (100.0%)
19 (100.0%)
Housing Occupancy in Lyden
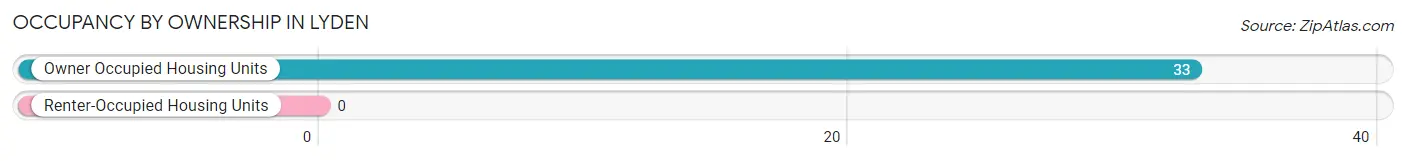
Occupancy by Ownership in Lyden
Of the total 33 dwellings in Lyden, owner-occupied units account for 33 (100.0%), while renter-occupied units make up 0 (0.0%).
Occupancy
# Housing Units
% Housing Units
Owner Occupied Housing Units
33
100.0%
Renter-Occupied Housing Units
0
0.0%
Total Occupied Housing Units
33
100.0%
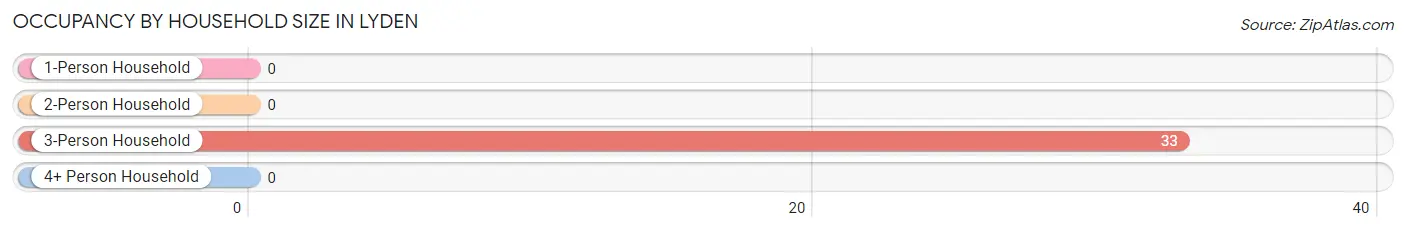
Occupancy by Household Size in Lyden
Household Size
# Housing Units
% Housing Units
1-Person Household
0
0.0%
2-Person Household
0
0.0%
3-Person Household
33
100.0%
4+ Person Household
0
0.0%
Total Housing Units
33
100.0%
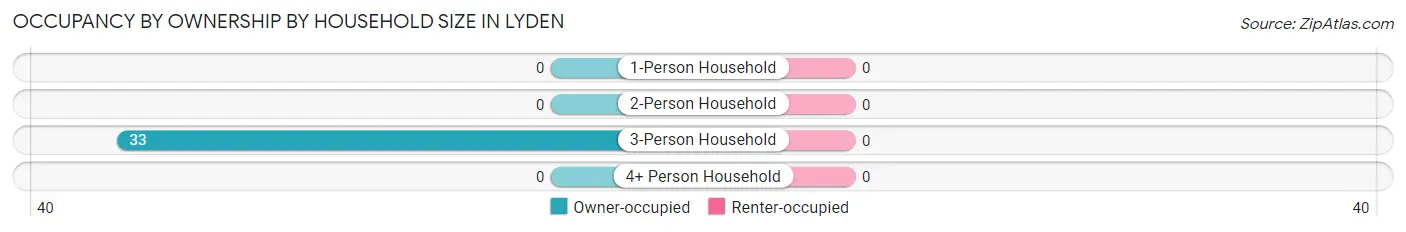
Occupancy by Ownership by Household Size in Lyden
Household Size
Owner-occupied
Renter-occupied
1-Person Household
0 (0.0%)
0 (0.0%)
2-Person Household
0 (0.0%)
0 (0.0%)
3-Person Household
33 (100.0%)
0 (0.0%)
4+ Person Household
0 (0.0%)
0 (0.0%)
Total Housing Units
33 (100.0%)
0 (0.0%)
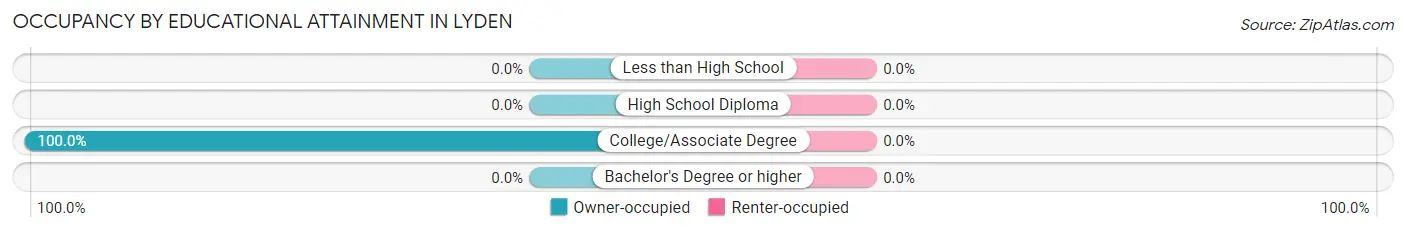
Occupancy by Educational Attainment in Lyden
Household Size
Owner-occupied
Renter-occupied
Less than High School
0 (0.0%)
0 (0.0%)
High School Diploma
0 (0.0%)
0 (0.0%)
College/Associate Degree
33 (100.0%)
0 (0.0%)
Bachelor's Degree or higher
0 (0.0%)
0 (0.0%)
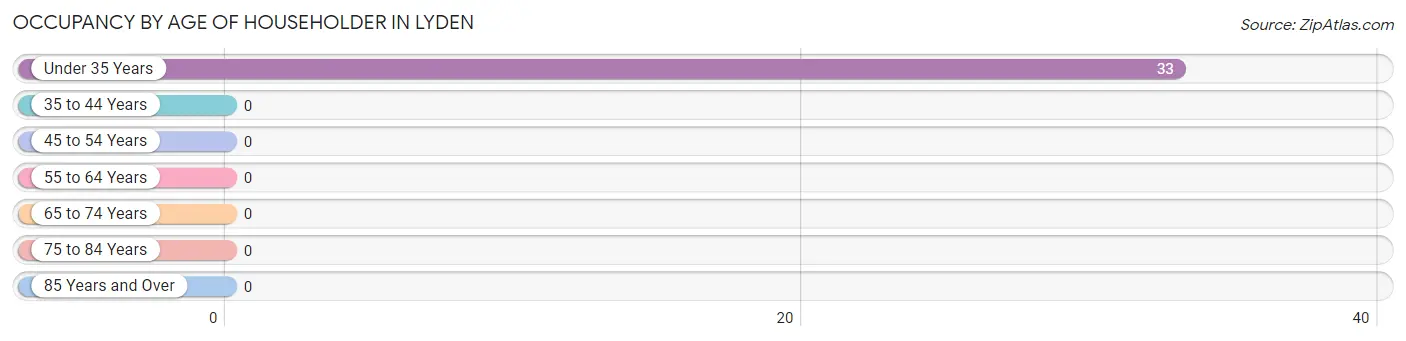
Occupancy by Age of Householder in Lyden
Age Bracket
# Households
% Households
Under 35 Years
33
100.0%
35 to 44 Years
0
0.0%
45 to 54 Years
0
0.0%
55 to 64 Years
0
0.0%
65 to 74 Years
0
0.0%
75 to 84 Years
0
0.0%
85 Years and Over
0
0.0%
Total
33
100.0%
Housing Finances in Lyden
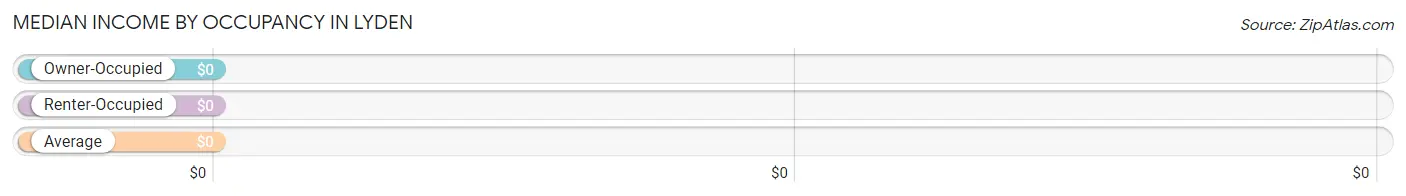
Median Income by Occupancy in Lyden
Occupancy Type
# Households
Median Income
Owner-Occupied
33 (100.0%)
$0
Renter-Occupied
0 (0.0%)
$0
Average
33 (100.0%)
$0
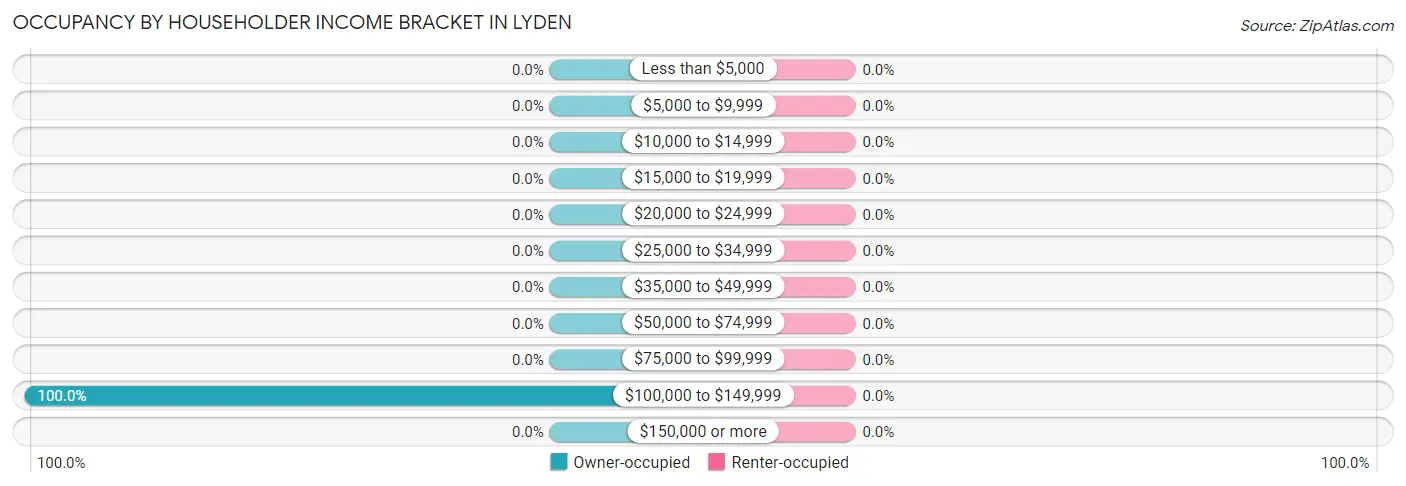
Occupancy by Householder Income Bracket in Lyden
Income Bracket
Owner-occupied
Renter-occupied
Less than $5,000
0 (0.0%)
0 (0.0%)
$5,000 to $9,999
0 (0.0%)
0 (0.0%)
$10,000 to $14,999
0 (0.0%)
0 (0.0%)
$15,000 to $19,999
0 (0.0%)
0 (0.0%)
$20,000 to $24,999
0 (0.0%)
0 (0.0%)
$25,000 to $34,999
0 (0.0%)
0 (0.0%)
$35,000 to $49,999
0 (0.0%)
0 (0.0%)
$50,000 to $74,999
0 (0.0%)
0 (0.0%)
$75,000 to $99,999
0 (0.0%)
0 (0.0%)
$100,000 to $149,999
33 (100.0%)
0 (0.0%)
$150,000 or more
0 (0.0%)
0 (0.0%)
Total
33 (100.0%)
0 (0.0%)
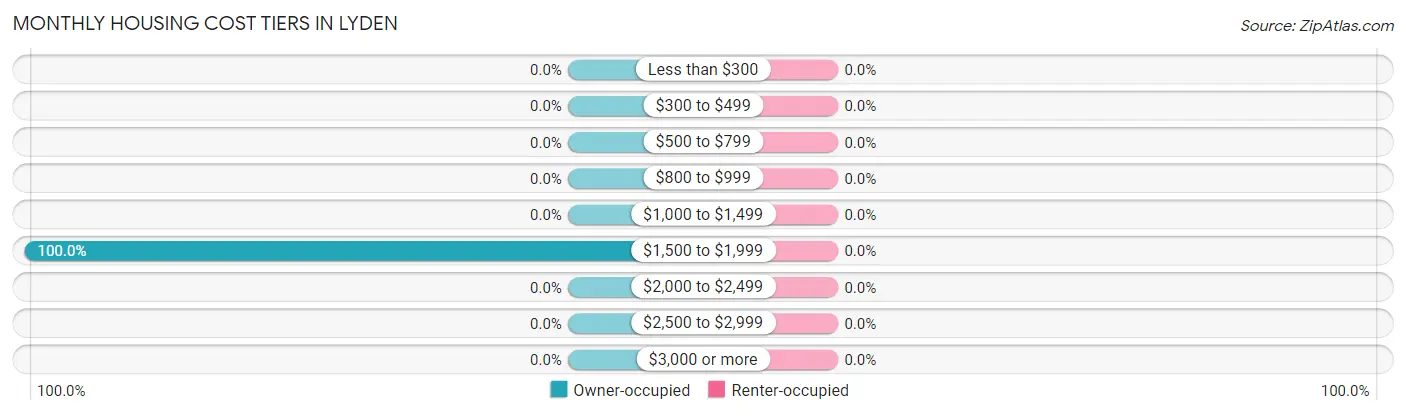
Monthly Housing Cost Tiers in Lyden
Monthly Cost
Owner-occupied
Renter-occupied
Less than $300
0 (0.0%)
0 (0.0%)
$300 to $499
0 (0.0%)
0 (0.0%)
$500 to $799
0 (0.0%)
0 (0.0%)
$800 to $999
0 (0.0%)
0 (0.0%)
$1,000 to $1,499
0 (0.0%)
0 (0.0%)
$1,500 to $1,999
33 (100.0%)
0 (0.0%)
$2,000 to $2,499
0 (0.0%)
0 (0.0%)
$2,500 to $2,999
0 (0.0%)
0 (0.0%)
$3,000 or more
0 (0.0%)
0 (0.0%)
Total
33 (100.0%)
0 (0.0%)
Physical Housing Characteristics in Lyden
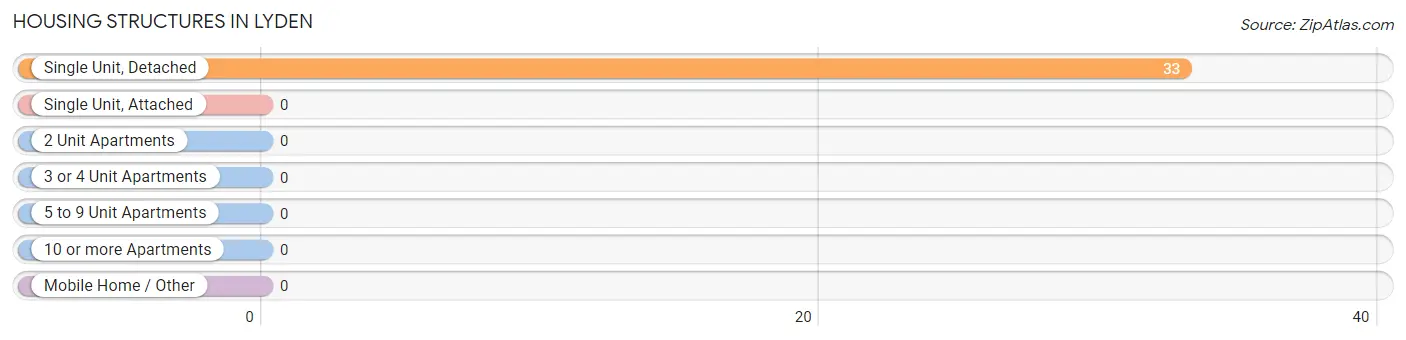
Housing Structures in Lyden
Structure Type
# Housing Units
% Housing Units
Single Unit, Detached
33
100.0%
Single Unit, Attached
0
0.0%
2 Unit Apartments
0
0.0%
3 or 4 Unit Apartments
0
0.0%
5 to 9 Unit Apartments
0
0.0%
10 or more Apartments
0
0.0%
Mobile Home / Other
0
0.0%
Total
33
100.0%
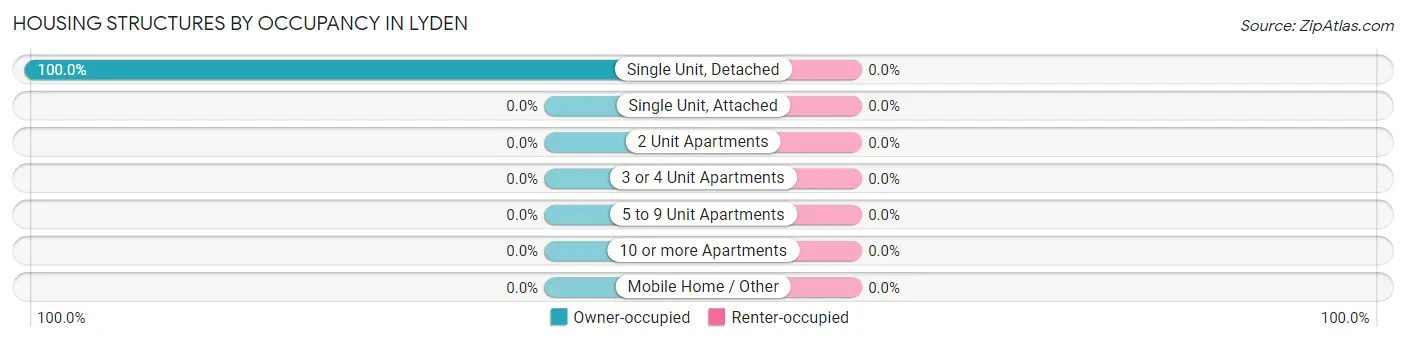
Housing Structures by Occupancy in Lyden
Structure Type
Owner-occupied
Renter-occupied
Single Unit, Detached
33 (100.0%)
0 (0.0%)
Single Unit, Attached
0 (0.0%)
0 (0.0%)
2 Unit Apartments
0 (0.0%)
0 (0.0%)
3 or 4 Unit Apartments
0 (0.0%)
0 (0.0%)
5 to 9 Unit Apartments
0 (0.0%)
0 (0.0%)
10 or more Apartments
0 (0.0%)
0 (0.0%)
Mobile Home / Other
0 (0.0%)
0 (0.0%)
Total
33 (100.0%)
0 (0.0%)
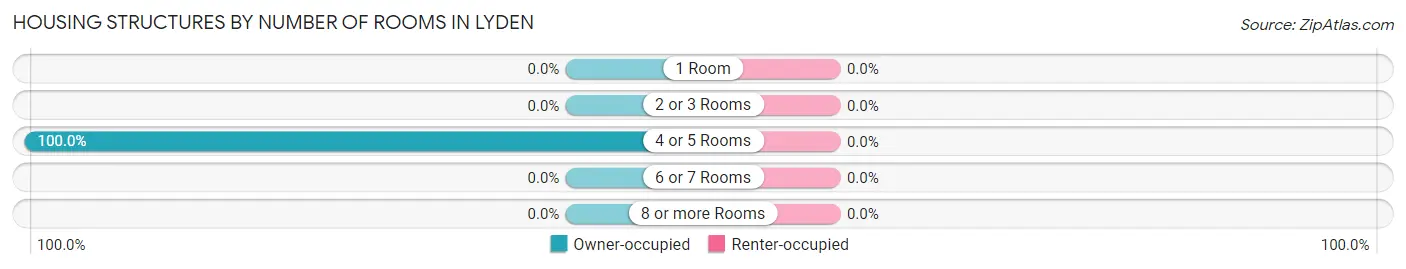
Housing Structures by Number of Rooms in Lyden
Number of Rooms
Owner-occupied
Renter-occupied
1 Room
0 (0.0%)
0 (0.0%)
2 or 3 Rooms
0 (0.0%)
0 (0.0%)
4 or 5 Rooms
33 (100.0%)
0 (0.0%)
6 or 7 Rooms
0 (0.0%)
0 (0.0%)
8 or more Rooms
0 (0.0%)
0 (0.0%)
Total
33 (100.0%)
0 (0.0%)
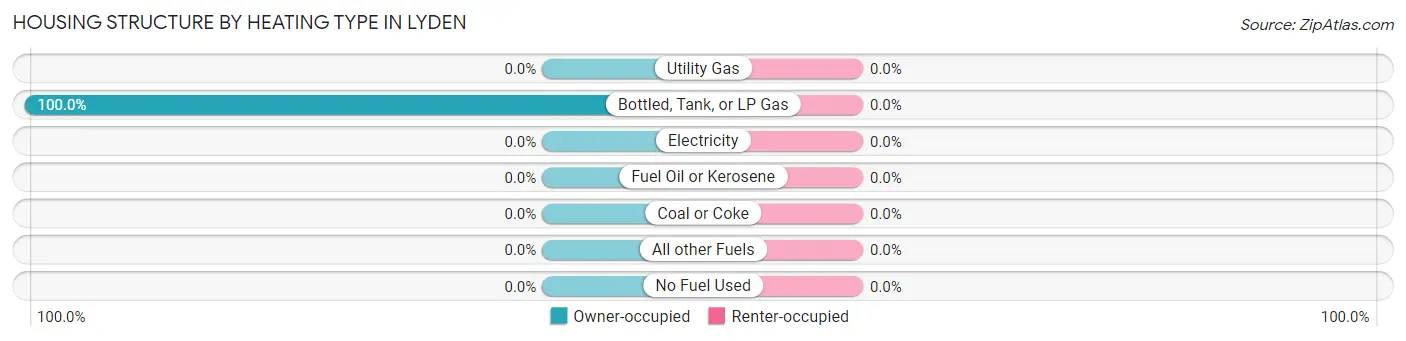
Housing Structure by Heating Type in Lyden
Heating Type
Owner-occupied
Renter-occupied
Utility Gas
0 (0.0%)
0 (0.0%)
Bottled, Tank, or LP Gas
33 (100.0%)
0 (0.0%)
Electricity
0 (0.0%)
0 (0.0%)
Fuel Oil or Kerosene
0 (0.0%)
0 (0.0%)
Coal or Coke
0 (0.0%)
0 (0.0%)
All other Fuels
0 (0.0%)
0 (0.0%)
No Fuel Used
0 (0.0%)
0 (0.0%)
Total
33 (100.0%)
0 (0.0%)
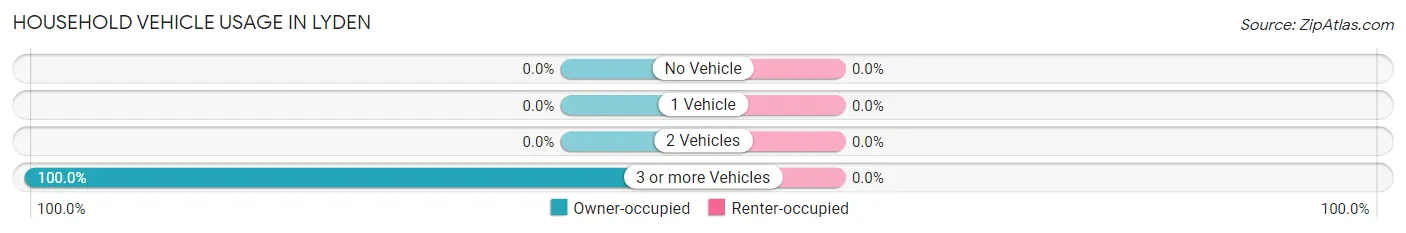
Household Vehicle Usage in Lyden
Vehicles per Household
Owner-occupied
Renter-occupied
No Vehicle
0 (0.0%)
0 (0.0%)
1 Vehicle
0 (0.0%)
0 (0.0%)
2 Vehicles
0 (0.0%)
0 (0.0%)
3 or more Vehicles
33 (100.0%)
0 (0.0%)
Total
33 (100.0%)
0 (0.0%)
Real Estate & Mortgages in Lyden
Real Estate and Mortgage Overview in Lyden
Characteristic
Without Mortgage
With Mortgage
Housing Units
0
33
Median Property Value
-
-
Median Household Income
-
-
Monthly Housing Costs
-
-
Real Estate Taxes
-
-
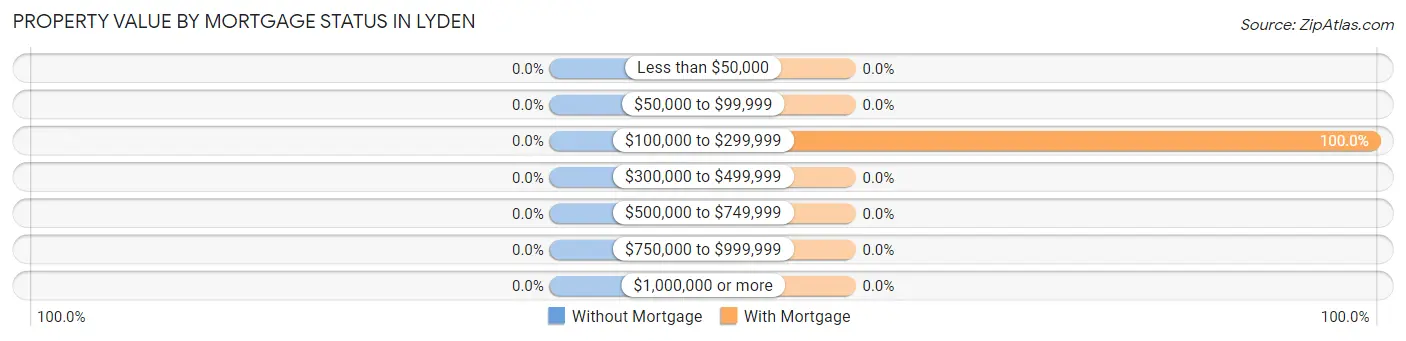
Property Value by Mortgage Status in Lyden
Property Value
Without Mortgage
With Mortgage
Less than $50,000
0 (0.0%)
0 (0.0%)
$50,000 to $99,999
0 (0.0%)
0 (0.0%)
$100,000 to $299,999
0 (0.0%)
33 (100.0%)
$300,000 to $499,999
0 (0.0%)
0 (0.0%)
$500,000 to $749,999
0 (0.0%)
0 (0.0%)
$750,000 to $999,999
0 (0.0%)
0 (0.0%)
$1,000,000 or more
0 (0.0%)
0 (0.0%)
Total
0 (0.0%)
33 (100.0%)
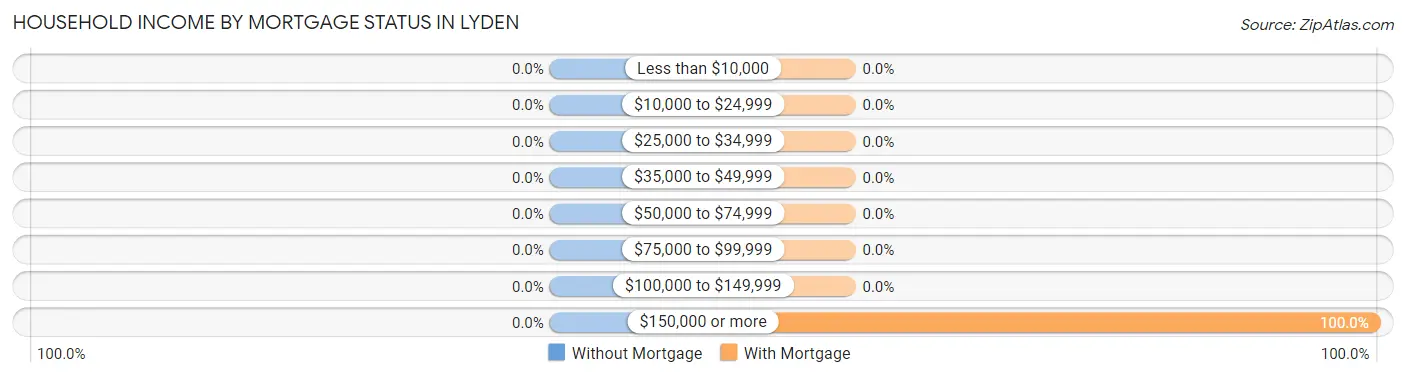
Household Income by Mortgage Status in Lyden
Household Income
Without Mortgage
With Mortgage
Less than $10,000
0 (0.0%)
0 (0.0%)
$10,000 to $24,999
0 (0.0%)
0 (0.0%)
$25,000 to $34,999
0 (0.0%)
0 (0.0%)
$35,000 to $49,999
0 (0.0%)
0 (0.0%)
$50,000 to $74,999
0 (0.0%)
0 (0.0%)
$75,000 to $99,999
0 (0.0%)
0 (0.0%)
$100,000 to $149,999
0 (0.0%)
0 (0.0%)
$150,000 or more
0 (0.0%)
33 (100.0%)
Total
0 (0.0%)
33 (100.0%)
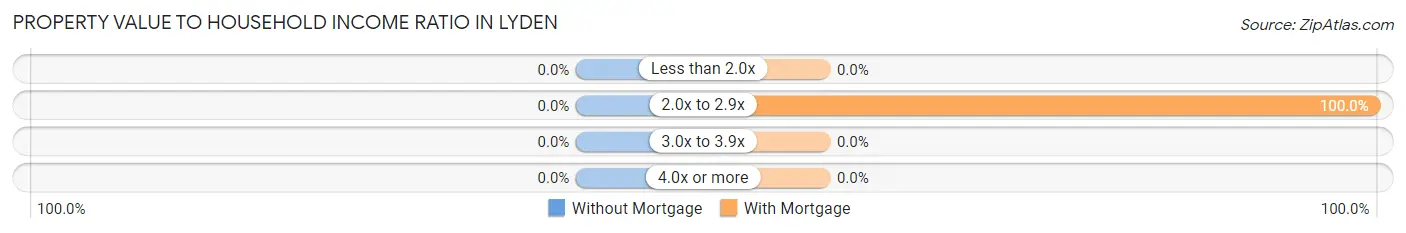
Property Value to Household Income Ratio in Lyden
Value-to-Income Ratio
Without Mortgage
With Mortgage
Less than 2.0x
0 (0.0%)
0 (0.0%)
2.0x to 2.9x
0 (0.0%)
33 (100.0%)
3.0x to 3.9x
0 (0.0%)
0 (0.0%)
4.0x or more
0 (0.0%)
0 (0.0%)
Total
0 (0.0%)
33 (100.0%)
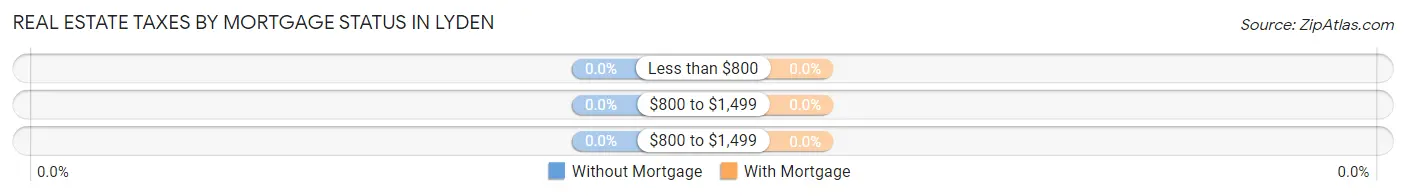
Real Estate Taxes by Mortgage Status in Lyden
Property Taxes
Without Mortgage
With Mortgage
Less than $800
0 (0.0%)
0 (0.0%)
$800 to $1,499
0 (0.0%)
0 (0.0%)
$800 to $1,499
0 (0.0%)
0 (0.0%)
Total
0 (0.0%)
33 (100.0%)
Health & Disability in Lyden
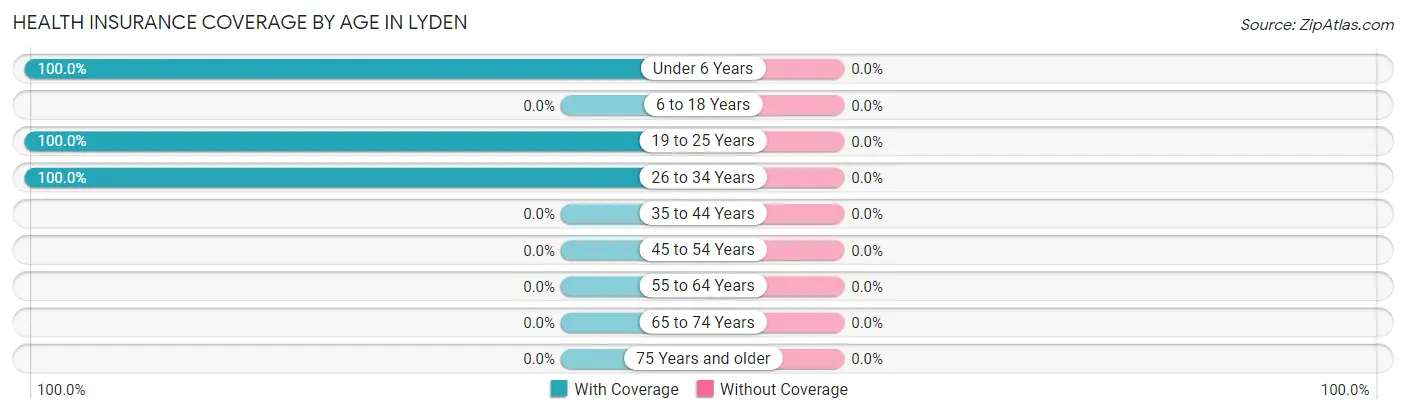
Health Insurance Coverage by Age in Lyden
Age Bracket
With Coverage
Without Coverage
Under 6 Years
43 (100.0%)
0 (0.0%)
6 to 18 Years
0 (0.0%)
0 (0.0%)
19 to 25 Years
19 (100.0%)
0 (0.0%)
26 to 34 Years
33 (100.0%)
0 (0.0%)
35 to 44 Years
0 (0.0%)
0 (0.0%)
45 to 54 Years
0 (0.0%)
0 (0.0%)
55 to 64 Years
0 (0.0%)
0 (0.0%)
65 to 74 Years
0 (0.0%)
0 (0.0%)
75 Years and older
0 (0.0%)
0 (0.0%)
Total
95 (100.0%)
0 (0.0%)
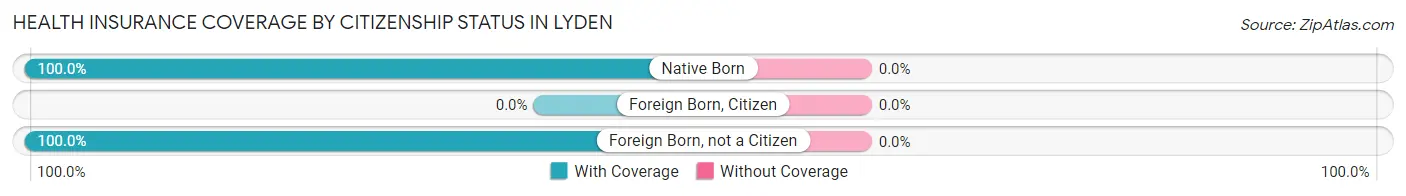
Health Insurance Coverage by Citizenship Status in Lyden
Citizenship Status
With Coverage
Without Coverage
Native Born
43 (100.0%)
0 (0.0%)
Foreign Born, Citizen
0 (0.0%)
0 (0.0%)
Foreign Born, not a Citizen
19 (100.0%)
0 (0.0%)
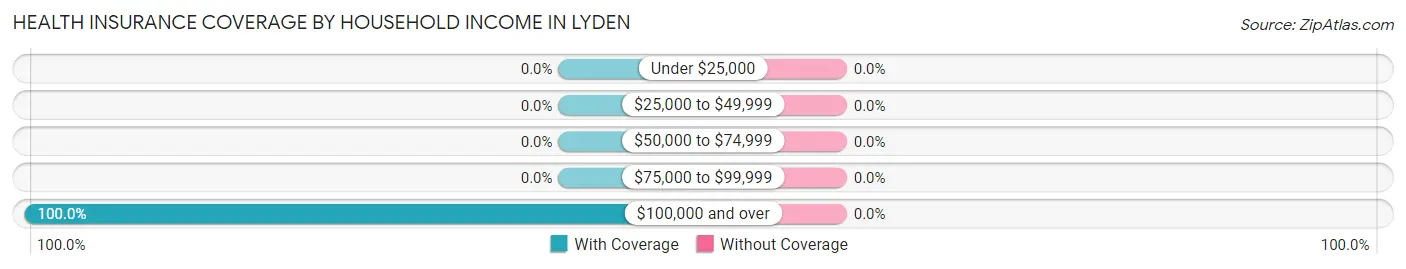
Health Insurance Coverage by Household Income in Lyden
Household Income
With Coverage
Without Coverage
Under $25,000
0 (0.0%)
0 (0.0%)
$25,000 to $49,999
0 (0.0%)
0 (0.0%)
$50,000 to $74,999
0 (0.0%)
0 (0.0%)
$75,000 to $99,999
0 (0.0%)
0 (0.0%)
$100,000 and over
95 (100.0%)
0 (0.0%)
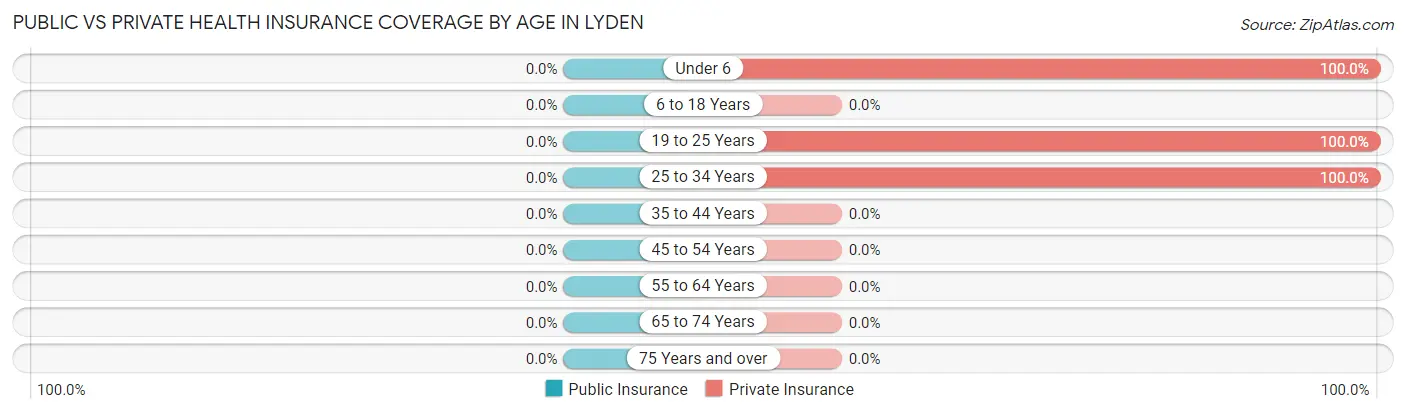
Public vs Private Health Insurance Coverage by Age in Lyden
Age Bracket
Public Insurance
Private Insurance
Under 6
0 (0.0%)
43 (100.0%)
6 to 18 Years
0 (0.0%)
0 (0.0%)
19 to 25 Years
0 (0.0%)
19 (100.0%)
25 to 34 Years
0 (0.0%)
33 (100.0%)
35 to 44 Years
0 (0.0%)
0 (0.0%)
45 to 54 Years
0 (0.0%)
0 (0.0%)
55 to 64 Years
0 (0.0%)
0 (0.0%)
65 to 74 Years
0 (0.0%)
0 (0.0%)
75 Years and over
0 (0.0%)
0 (0.0%)
Total
0 (0.0%)
95 (100.0%)
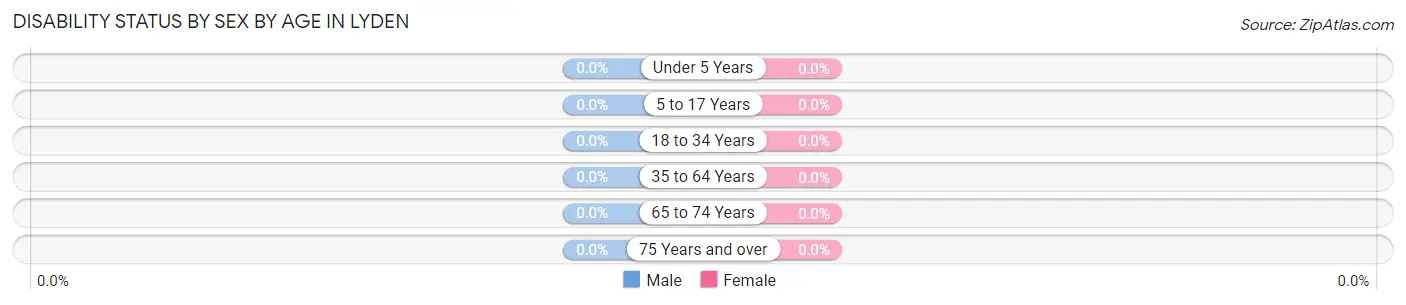
Disability Status by Sex by Age in Lyden
Age Bracket
Male
Female
Under 5 Years
0 (0.0%)
0 (0.0%)
5 to 17 Years
0 (0.0%)
0 (0.0%)
18 to 34 Years
0 (0.0%)
0 (0.0%)
35 to 64 Years
0 (0.0%)
0 (0.0%)
65 to 74 Years
0 (0.0%)
0 (0.0%)
75 Years and over
0 (0.0%)
0 (0.0%)
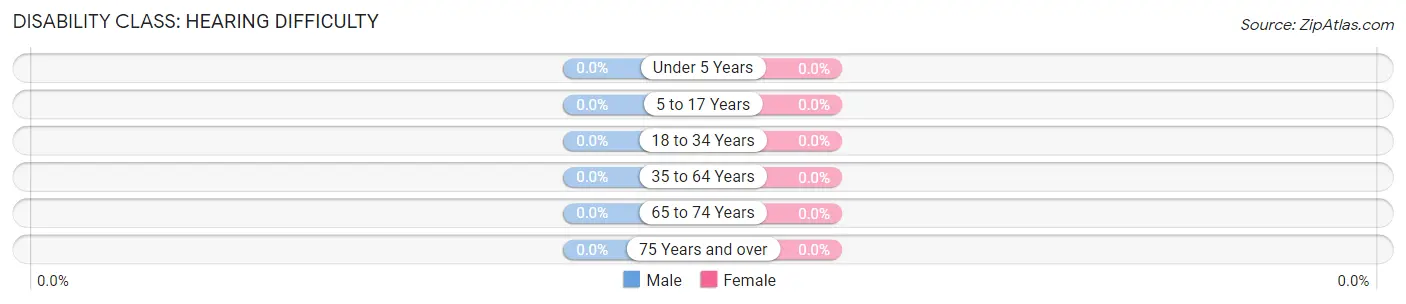
Disability Class by Sex by Age in Lyden
Disability Class: Hearing Difficulty
Age Bracket
Male
Female
Under 5 Years
0 (0.0%)
0 (0.0%)
5 to 17 Years
0 (0.0%)
0 (0.0%)
18 to 34 Years
0 (0.0%)
0 (0.0%)
35 to 64 Years
0 (0.0%)
0 (0.0%)
65 to 74 Years
0 (0.0%)
0 (0.0%)
75 Years and over
0 (0.0%)
0 (0.0%)
Disability Class: Vision Difficulty
Age Bracket
Male
Female
Under 5 Years
0 (0.0%)
0 (0.0%)
5 to 17 Years
0 (0.0%)
0 (0.0%)
18 to 34 Years
0 (0.0%)
0 (0.0%)
35 to 64 Years
0 (0.0%)
0 (0.0%)
65 to 74 Years
0 (0.0%)
0 (0.0%)
75 Years and over
0 (0.0%)
0 (0.0%)
Disability Class: Cognitive Difficulty
Age Bracket
Male
Female
5 to 17 Years
0 (0.0%)
0 (0.0%)
18 to 34 Years
0 (0.0%)
0 (0.0%)
35 to 64 Years
0 (0.0%)
0 (0.0%)
65 to 74 Years
0 (0.0%)
0 (0.0%)
75 Years and over
0 (0.0%)
0 (0.0%)
Disability Class: Ambulatory Difficulty
Age Bracket
Male
Female
5 to 17 Years
0 (0.0%)
0 (0.0%)
18 to 34 Years
0 (0.0%)
0 (0.0%)
35 to 64 Years
0 (0.0%)
0 (0.0%)
65 to 74 Years
0 (0.0%)
0 (0.0%)
75 Years and over
0 (0.0%)
0 (0.0%)
Disability Class: Self-Care Difficulty
Age Bracket
Male
Female
5 to 17 Years
0 (0.0%)
0 (0.0%)
18 to 34 Years
0 (0.0%)
0 (0.0%)
35 to 64 Years
0 (0.0%)
0 (0.0%)
65 to 74 Years
0 (0.0%)
0 (0.0%)
75 Years and over
0 (0.0%)
0 (0.0%)
Technology Access in Lyden
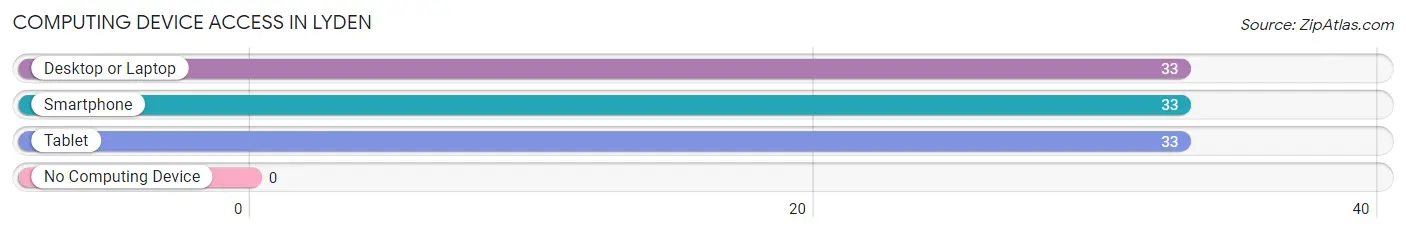
Computing Device Access in Lyden
Device Type
# Households
% Households
Desktop or Laptop
33
100.0%
Smartphone
33
100.0%
Tablet
33
100.0%
No Computing Device
0
0.0%
Total
33
100.0%
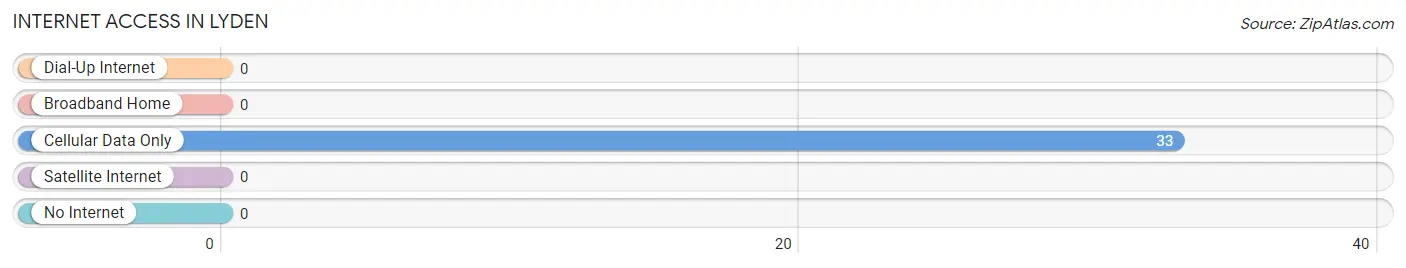
Internet Access in Lyden
Internet Type
# Households
% Households
Dial-Up Internet
0
0.0%
Broadband Home
0
0.0%
Cellular Data Only
33
100.0%
Satellite Internet
0
0.0%
No Internet
0
0.0%
Total
33
100.0%
Lyden Summary
Lyden is a small unincorporated community located in the state of New Mexico. It is situated in the southeastern corner of the state, in the county of Eddy. The town is located on the banks of the Pecos River, and is surrounded by the Chihuahuan Desert. The town has a population of approximately 200 people, and is home to a variety of businesses, including a gas station, a grocery store, and a post office.
History
The area that is now Lyden was first settled in the late 1800s by ranchers and farmers. The town was originally known as “Lyden’s Crossing”, named after the first settler, John Lyden. The town was officially established in 1891, and was incorporated in 1895.
In the early 1900s, the town was a major stop on the Santa Fe Trail, and was a popular destination for travelers. The town was also home to a number of businesses, including a hotel, a general store, and a saloon.
In the 1920s, the town began to decline as the railroad bypassed the town and the Santa Fe Trail was no longer used. The town’s population dwindled, and by the 1950s, the town was nearly abandoned.
In the late 1970s, the town began to experience a resurgence as people began to move back to the area. The town was revitalized, and today it is a popular destination for tourists and outdoor enthusiasts.
Geography
Lyden is located in the southeastern corner of New Mexico, in the county of Eddy. The town is situated on the banks of the Pecos River, and is surrounded by the Chihuahuan Desert. The town is located at an elevation of 4,000 feet, and has a semi-arid climate.
The town is located near the Guadalupe Mountains National Park, which is a popular destination for hikers and outdoor enthusiasts. The town is also located near the Carlsbad Caverns National Park, which is home to a variety of unique geological formations.
Economy
The economy of Lyden is largely based on tourism and outdoor recreation. The town is home to a variety of businesses, including a gas station, a grocery store, and a post office. The town is also home to a number of restaurants, bars, and other tourist attractions.
The town is also home to a number of ranches and farms, which produce a variety of crops, including alfalfa, cotton, and pecans. The town is also home to a number of oil and gas wells, which provide jobs and revenue for the town.
Demographics
As of the 2010 census, the population of Lyden was approximately 200 people. The town is predominantly white, with a small Hispanic population. The median household income in the town is approximately $30,000, and the median home value is approximately $90,000.
The town is home to a variety of religious denominations, including Catholic, Baptist, and Methodist. The town is also home to a variety of cultural events, including the annual Lyden Days Festival, which celebrates the town’s history and culture.
Conclusion
Lyden is a small unincorporated community located in the southeastern corner of New Mexico. The town is situated on the banks of the Pecos River, and is surrounded by the Chihuahuan Desert. The town has a population of approximately 200 people, and is home to a variety of businesses, including a gas station, a grocery store, and a post office. The town’s economy is largely based on tourism and outdoor recreation, and the town is home to a variety of cultural events, including the annual Lyden Days Festival.
Common Questions
What is the Total Population of Lyden?
Total Population of Lyden is 95.
What is the Total Male Population of Lyden?
Total Male Population of Lyden is 33.
What is the Total Female Population of Lyden?
Total Female Population of Lyden is 62.
What is the Ratio of Males per 100 Females in Lyden?
There are 53.23 Males per 100 Females in Lyden.
What is the Ratio of Females per 100 Males in Lyden?
There are 187.88 Females per 100 Males in Lyden.
What is the Median Population Age in Lyden?
Median Population Age in Lyden is 25.2 Years.
What is the Average Family Size in Lyden
Average Family Size in Lyden is 2.3 People.
What is the Average Household Size in Lyden
Average Household Size in Lyden is 2.9 People.
How Large is the Labor Force in Lyden?
There are 52 People in the Labor Forcein in Lyden.
What is the Percentage of People in the Labor Force in Lyden?
100.0% of People are in the Labor Force in Lyden.
Report Title
Report Link
HTML Copy & Paste Link
Social Media
Copy and paste the folowing code into any webpage where you would like this interactive chart to display