Zip Codes with the Highest Percentage of Population Employed in Architecture & Engineering in Silver Spring, MD
RELATED REPORTS & OPTIONS
Architecture & Engineering
Silver Spring
Compare Zip Codes
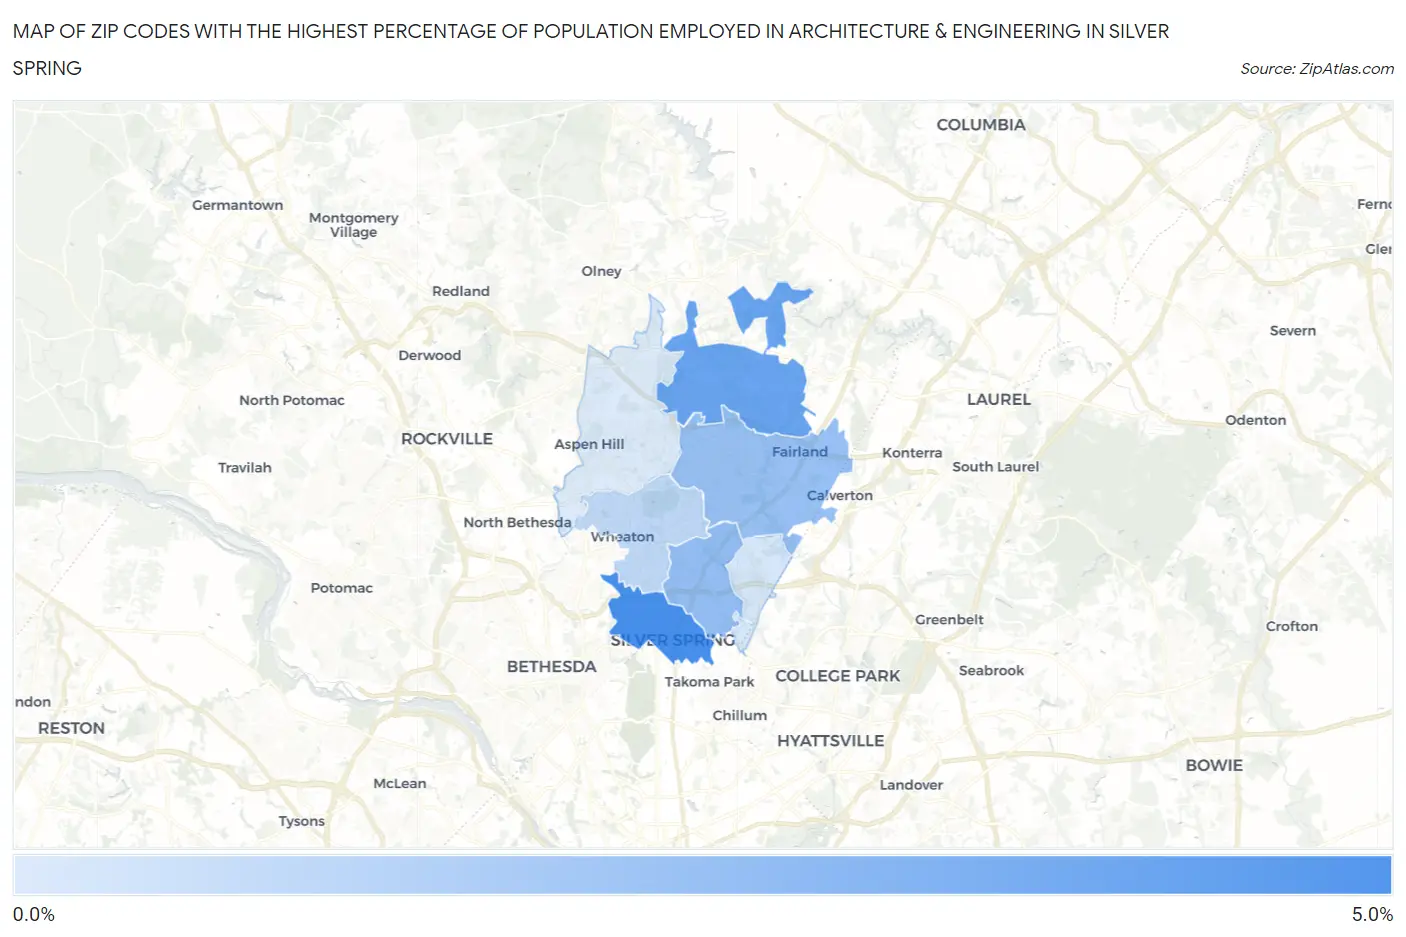
Map of Zip Codes with the Highest Percentage of Population Employed in Architecture & Engineering in Silver Spring
0.0%
5.0%
Zip Codes with the Highest Percentage of Population Employed in Architecture & Engineering in Silver Spring, MD
| Zip Code | % Employed | vs State | vs National | |
| 1. | 20910 | 4.2% | 2.4%(+1.77)#62 | 2.1%(+2.01)#2,546 |
| 2. | 20905 | 3.4% | 2.4%(+1.01)#103 | 2.1%(+1.25)#3,968 |
| 3. | 20901 | 2.5% | 2.4%(+0.104)#171 | 2.1%(+0.343)#7,029 |
| 4. | 20904 | 2.4% | 2.4%(-0.013)#183 | 2.1%(+0.225)#7,601 |
| 5. | 20902 | 1.5% | 2.4%(-0.841)#258 | 2.1%(-0.603)#12,533 |
| 6. | 20903 | 1.0% | 2.4%(-1.34)#303 | 2.1%(-1.10)#16,252 |
| 7. | 20906 | 0.90% | 2.4%(-1.49)#317 | 2.1%(-1.25)#17,392 |
1
Common Questions
What are the Top 5 Zip Codes with the Highest Percentage of Population Employed in Architecture & Engineering in Silver Spring, MD?
Top 5 Zip Codes with the Highest Percentage of Population Employed in Architecture & Engineering in Silver Spring, MD are:
What zip code has the Highest Percentage of Population Employed in Architecture & Engineering in Silver Spring, MD?
20910 has the Highest Percentage of Population Employed in Architecture & Engineering in Silver Spring, MD with 4.2%.
What is the Percentage of Population Employed in Architecture & Engineering in Silver Spring, MD?
Percentage of Population Employed in Architecture & Engineering in Silver Spring is 3.0%.
What is the Percentage of Population Employed in Architecture & Engineering in Maryland?
Percentage of Population Employed in Architecture & Engineering in Maryland is 2.4%.
What is the Percentage of Population Employed in Architecture & Engineering in the United States?
Percentage of Population Employed in Architecture & Engineering in the United States is 2.1%.