Zip Codes with the Highest Percentage of Population Employed in Real Estate, Rental & Leasing in Silver Spring, MD
RELATED REPORTS & OPTIONS
Real Estate, Rental & Leasing
Silver Spring
Compare Zip Codes
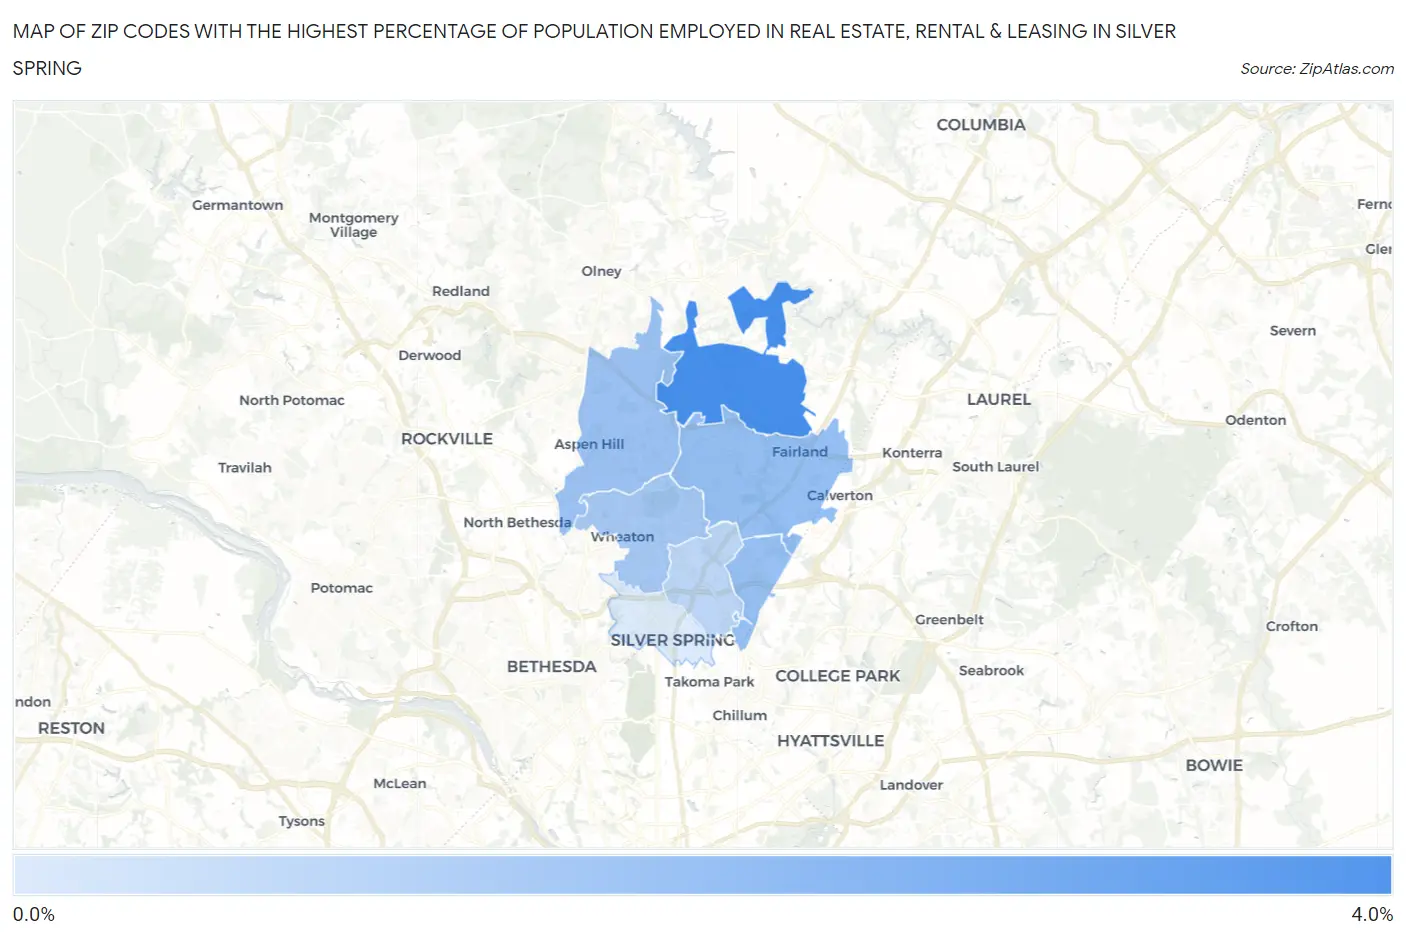
Map of Zip Codes with the Highest Percentage of Population Employed in Real Estate, Rental & Leasing in Silver Spring
0.0%
4.0%
Zip Codes with the Highest Percentage of Population Employed in Real Estate, Rental & Leasing in Silver Spring, MD
| Zip Code | % Employed | vs State | vs National | |
| 1. | 20905 | 3.4% | 2.1%(+1.32)#62 | 1.9%(+1.52)#3,004 |
| 2. | 20904 | 2.1% | 2.1%(+0.024)#164 | 1.9%(+0.222)#7,248 |
| 3. | 20903 | 2.1% | 2.1%(-0.017)#170 | 1.9%(+0.181)#7,463 |
| 4. | 20906 | 2.1% | 2.1%(-0.032)#173 | 1.9%(+0.166)#7,547 |
| 5. | 20902 | 1.9% | 2.1%(-0.214)#194 | 1.9%(-0.016)#8,631 |
| 6. | 20901 | 1.5% | 2.1%(-0.612)#245 | 1.9%(-0.414)#11,332 |
| 7. | 20910 | 0.96% | 2.1%(-1.13)#303 | 1.9%(-0.929)#15,465 |
1
Common Questions
What are the Top 5 Zip Codes with the Highest Percentage of Population Employed in Real Estate, Rental & Leasing in Silver Spring, MD?
Top 5 Zip Codes with the Highest Percentage of Population Employed in Real Estate, Rental & Leasing in Silver Spring, MD are:
What zip code has the Highest Percentage of Population Employed in Real Estate, Rental & Leasing in Silver Spring, MD?
20905 has the Highest Percentage of Population Employed in Real Estate, Rental & Leasing in Silver Spring, MD with 3.4%.
What is the Percentage of Population Employed in Real Estate, Rental & Leasing in Silver Spring, MD?
Percentage of Population Employed in Real Estate, Rental & Leasing in Silver Spring is 1.3%.
What is the Percentage of Population Employed in Real Estate, Rental & Leasing in Maryland?
Percentage of Population Employed in Real Estate, Rental & Leasing in Maryland is 2.1%.
What is the Percentage of Population Employed in Real Estate, Rental & Leasing in the United States?
Percentage of Population Employed in Real Estate, Rental & Leasing in the United States is 1.9%.