Zip Codes with the Highest Percentage of Population Employed in Food Preparation & Serving in Silver Spring, MD
RELATED REPORTS & OPTIONS
Food Preparation & Serving
Silver Spring
Compare Zip Codes
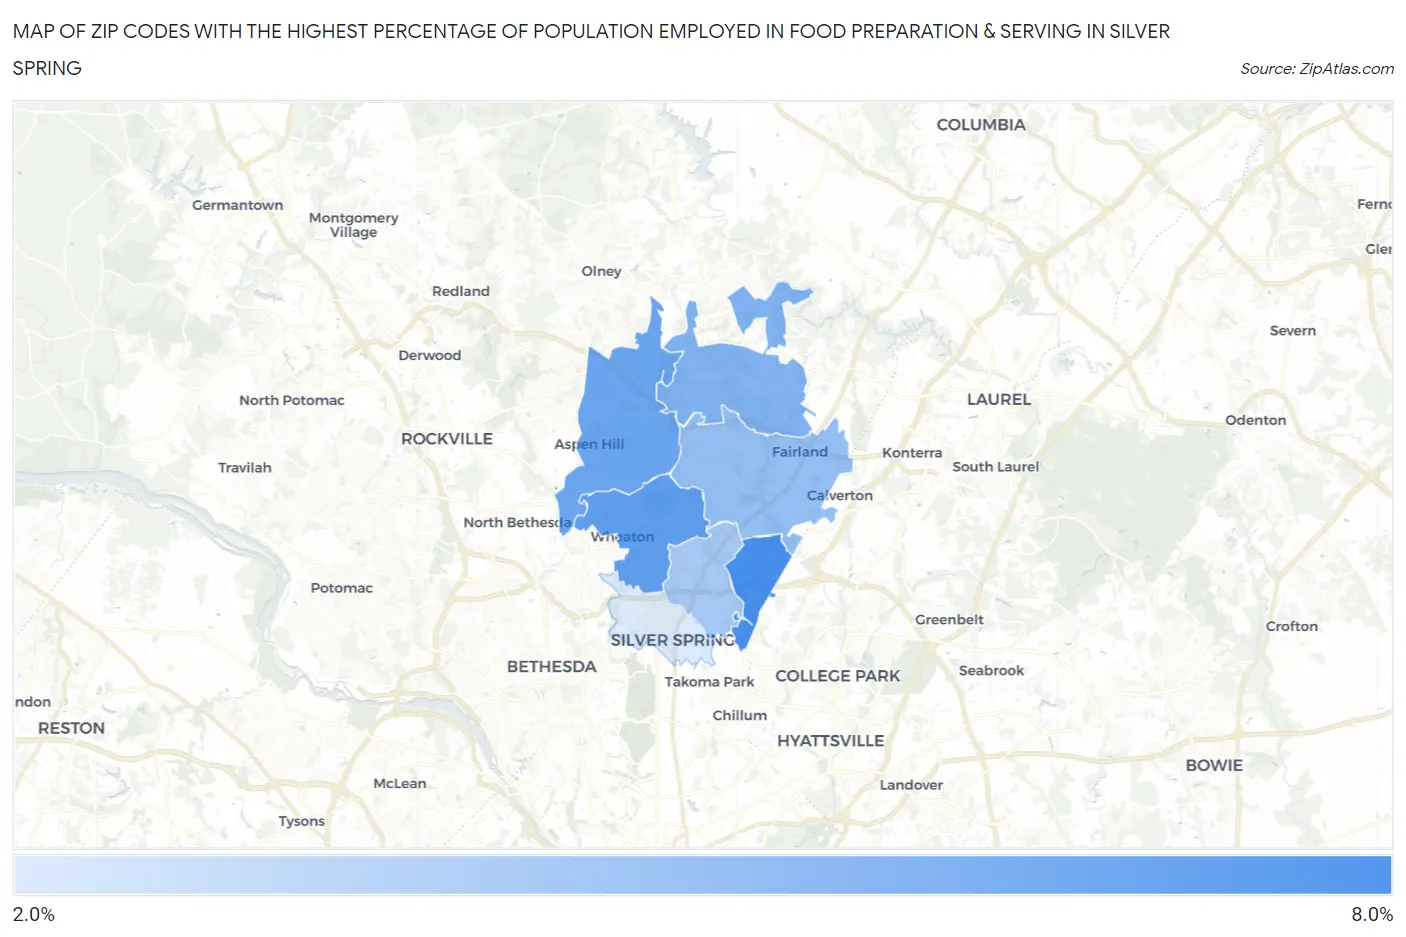
Map of Zip Codes with the Highest Percentage of Population Employed in Food Preparation & Serving in Silver Spring
0.0%
8.0%
Zip Codes with the Highest Percentage of Population Employed in Food Preparation & Serving in Silver Spring, MD
| Zip Code | % Employed | vs State | vs National | |
| 1. | 20903 | 7.2% | 4.4%(+2.82)#55 | 5.3%(+1.92)#6,128 |
| 2. | 20902 | 6.3% | 4.4%(+1.94)#76 | 5.3%(+1.03)#8,385 |
| 3. | 20906 | 5.9% | 4.4%(+1.52)#93 | 5.3%(+0.617)#9,673 |
| 4. | 20905 | 5.2% | 4.4%(+0.805)#137 | 5.3%(-0.100)#12,211 |
| 5. | 20904 | 4.5% | 4.4%(+0.111)#175 | 5.3%(-0.794)#15,064 |
| 6. | 20901 | 4.0% | 4.4%(-0.397)#210 | 5.3%(-1.30)#17,194 |
| 7. | 20910 | 2.1% | 4.4%(-2.28)#336 | 5.3%(-3.19)#24,403 |
1
Common Questions
What are the Top 5 Zip Codes with the Highest Percentage of Population Employed in Food Preparation & Serving in Silver Spring, MD?
Top 5 Zip Codes with the Highest Percentage of Population Employed in Food Preparation & Serving in Silver Spring, MD are:
What zip code has the Highest Percentage of Population Employed in Food Preparation & Serving in Silver Spring, MD?
20903 has the Highest Percentage of Population Employed in Food Preparation & Serving in Silver Spring, MD with 7.2%.
What is the Percentage of Population Employed in Food Preparation & Serving in Silver Spring, MD?
Percentage of Population Employed in Food Preparation & Serving in Silver Spring is 3.5%.
What is the Percentage of Population Employed in Food Preparation & Serving in Maryland?
Percentage of Population Employed in Food Preparation & Serving in Maryland is 4.4%.
What is the Percentage of Population Employed in Food Preparation & Serving in the United States?
Percentage of Population Employed in Food Preparation & Serving in the United States is 5.3%.