Zip Codes with the Highest Percentage of Population Employed in Life, Physical & Social Science in Silver Spring, MD
RELATED REPORTS & OPTIONS
Life, Physical & Social Science
Silver Spring
Compare Zip Codes
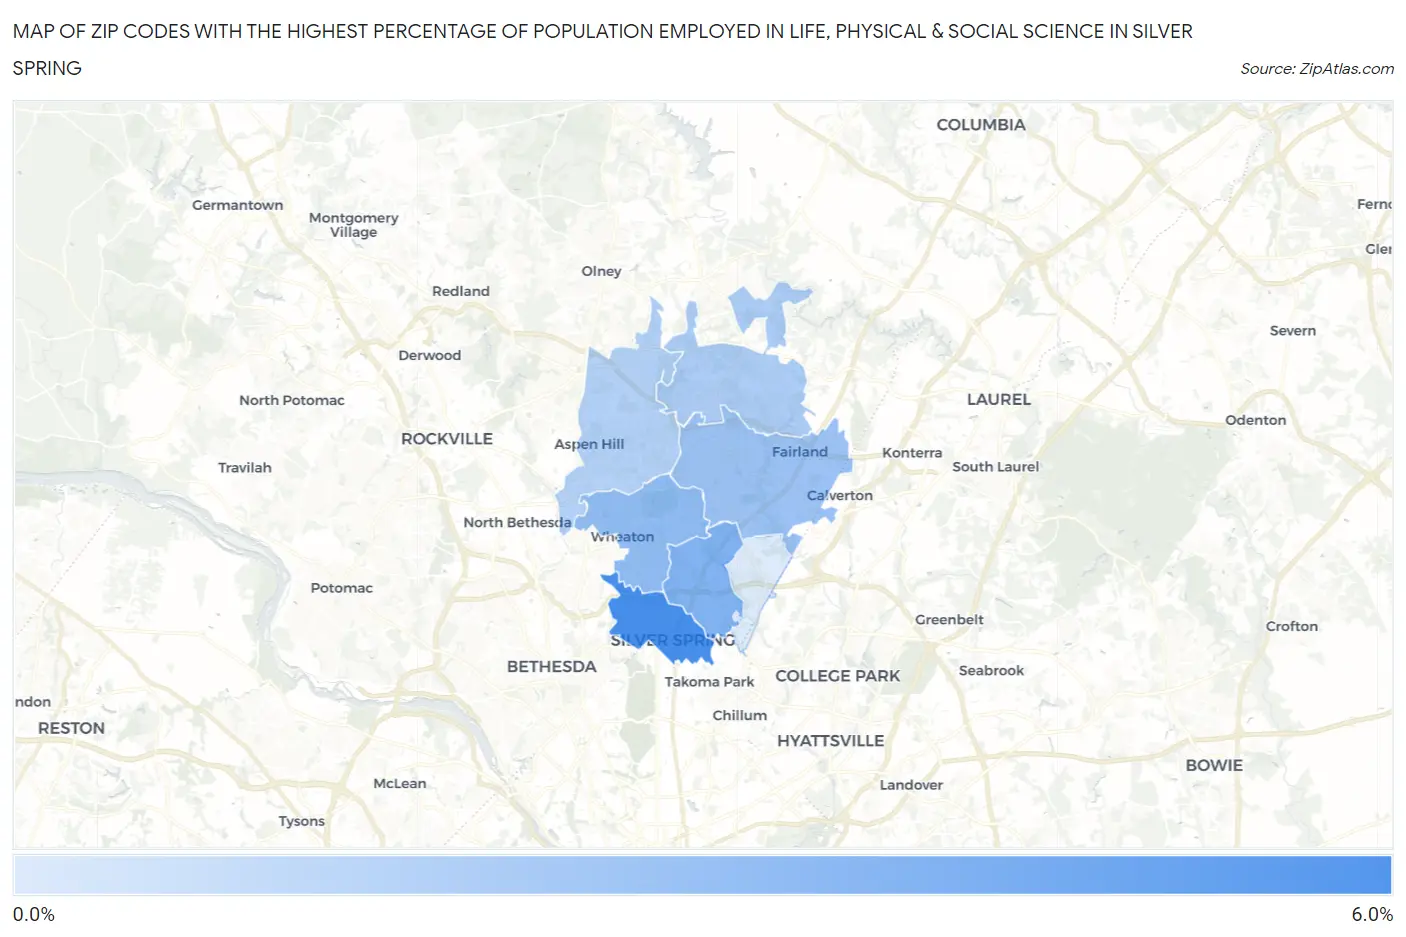
Map of Zip Codes with the Highest Percentage of Population Employed in Life, Physical & Social Science in Silver Spring
0.0%
6.0%
Zip Codes with the Highest Percentage of Population Employed in Life, Physical & Social Science in Silver Spring, MD
| Zip Code | % Employed | vs State | vs National | |
| 1. | 20910 | 5.7% | 2.2%(+3.55)#20 | 1.1%(+4.61)#590 |
| 2. | 20901 | 3.8% | 2.2%(+1.68)#48 | 1.1%(+2.74)#1,243 |
| 3. | 20902 | 3.3% | 2.2%(+1.16)#61 | 1.1%(+2.22)#1,564 |
| 4. | 20904 | 2.9% | 2.2%(+0.779)#70 | 1.1%(+1.84)#1,959 |
| 5. | 20905 | 2.4% | 2.2%(+0.267)#98 | 1.1%(+1.33)#2,718 |
| 6. | 20906 | 2.2% | 2.2%(+0.036)#114 | 1.1%(+1.10)#3,208 |
| 7. | 20903 | 0.88% | 2.2%(-1.27)#235 | 1.1%(-0.209)#10,134 |
1
Common Questions
What are the Top 5 Zip Codes with the Highest Percentage of Population Employed in Life, Physical & Social Science in Silver Spring, MD?
Top 5 Zip Codes with the Highest Percentage of Population Employed in Life, Physical & Social Science in Silver Spring, MD are:
What zip code has the Highest Percentage of Population Employed in Life, Physical & Social Science in Silver Spring, MD?
20910 has the Highest Percentage of Population Employed in Life, Physical & Social Science in Silver Spring, MD with 5.7%.
What is the Percentage of Population Employed in Life, Physical & Social Science in Silver Spring, MD?
Percentage of Population Employed in Life, Physical & Social Science in Silver Spring is 4.4%.
What is the Percentage of Population Employed in Life, Physical & Social Science in Maryland?
Percentage of Population Employed in Life, Physical & Social Science in Maryland is 2.2%.
What is the Percentage of Population Employed in Life, Physical & Social Science in the United States?
Percentage of Population Employed in Life, Physical & Social Science in the United States is 1.1%.