Zip Codes with the Highest Percentage of Population Employed in Architecture & Engineering in Bethesda, MD
RELATED REPORTS & OPTIONS
Architecture & Engineering
Bethesda
Compare Zip Codes
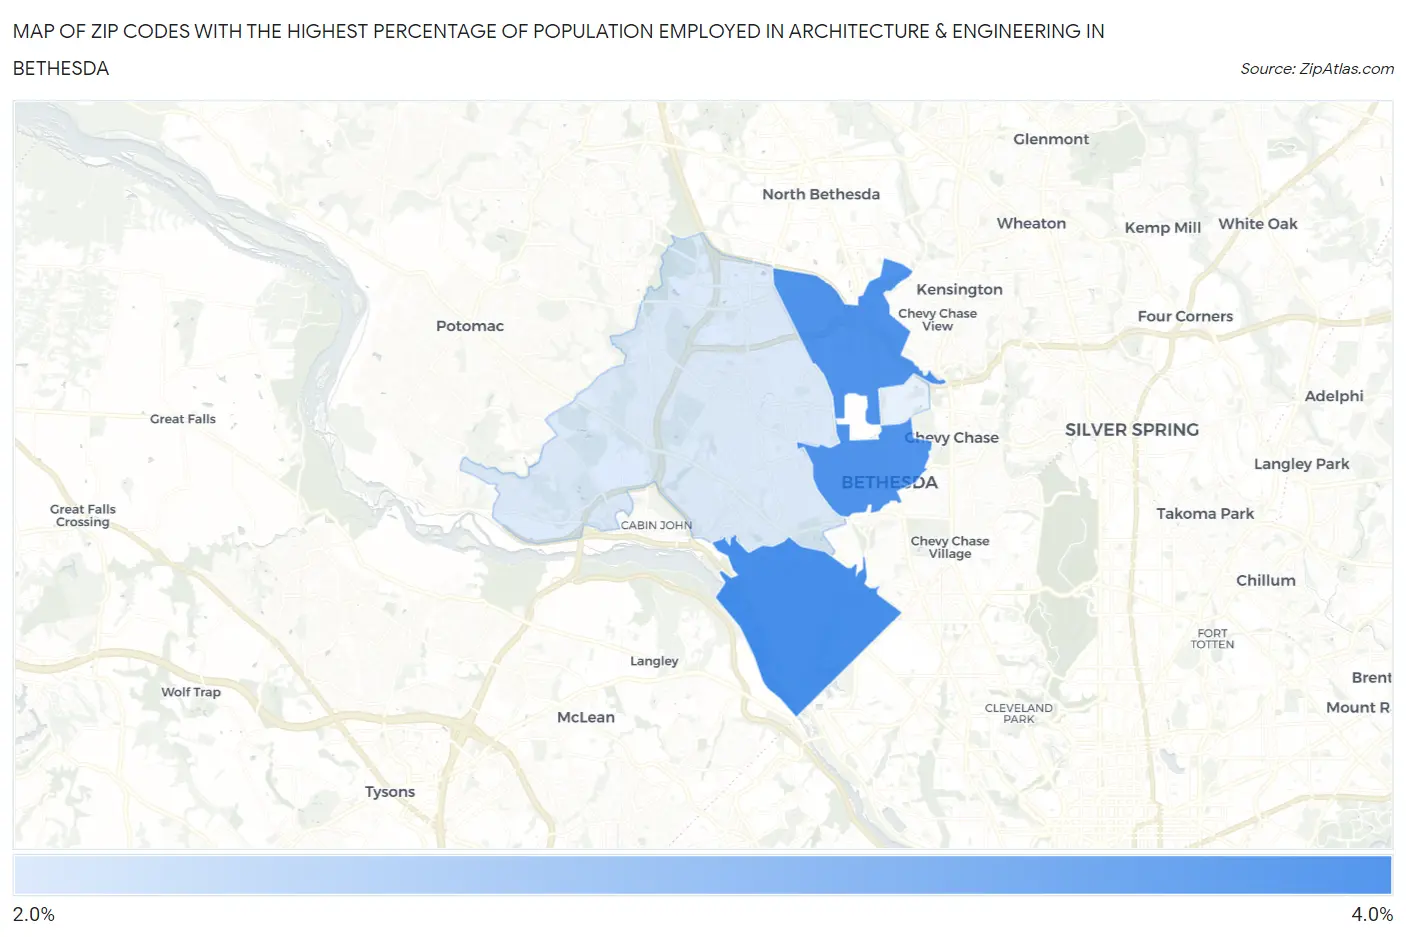
Map of Zip Codes with the Highest Percentage of Population Employed in Architecture & Engineering in Bethesda
0.0%
4.0%
Zip Codes with the Highest Percentage of Population Employed in Architecture & Engineering in Bethesda, MD
| Zip Code | % Employed | vs State | vs National | |
| 1. | 20816 | 3.2% | 2.4%(+0.800)#110 | 2.1%(+1.04)#4,494 |
| 2. | 20814 | 3.1% | 2.4%(+0.749)#113 | 2.1%(+0.987)#4,634 |
| 3. | 20817 | 2.1% | 2.4%(-0.335)#217 | 2.1%(-0.097)#9,306 |
1
Common Questions
What are the Top 3 Zip Codes with the Highest Percentage of Population Employed in Architecture & Engineering in Bethesda, MD?
Top 3 Zip Codes with the Highest Percentage of Population Employed in Architecture & Engineering in Bethesda, MD are:
What zip code has the Highest Percentage of Population Employed in Architecture & Engineering in Bethesda, MD?
20816 has the Highest Percentage of Population Employed in Architecture & Engineering in Bethesda, MD with 3.2%.
What is the Percentage of Population Employed in Architecture & Engineering in Bethesda, MD?
Percentage of Population Employed in Architecture & Engineering in Bethesda is 2.8%.
What is the Percentage of Population Employed in Architecture & Engineering in Maryland?
Percentage of Population Employed in Architecture & Engineering in Maryland is 2.4%.
What is the Percentage of Population Employed in Architecture & Engineering in the United States?
Percentage of Population Employed in Architecture & Engineering in the United States is 2.1%.