Zip Codes with the Highest Percentage of Population Employed in Architecture & Engineering in Annapolis, MD
RELATED REPORTS & OPTIONS
Architecture & Engineering
Annapolis
Compare Zip Codes
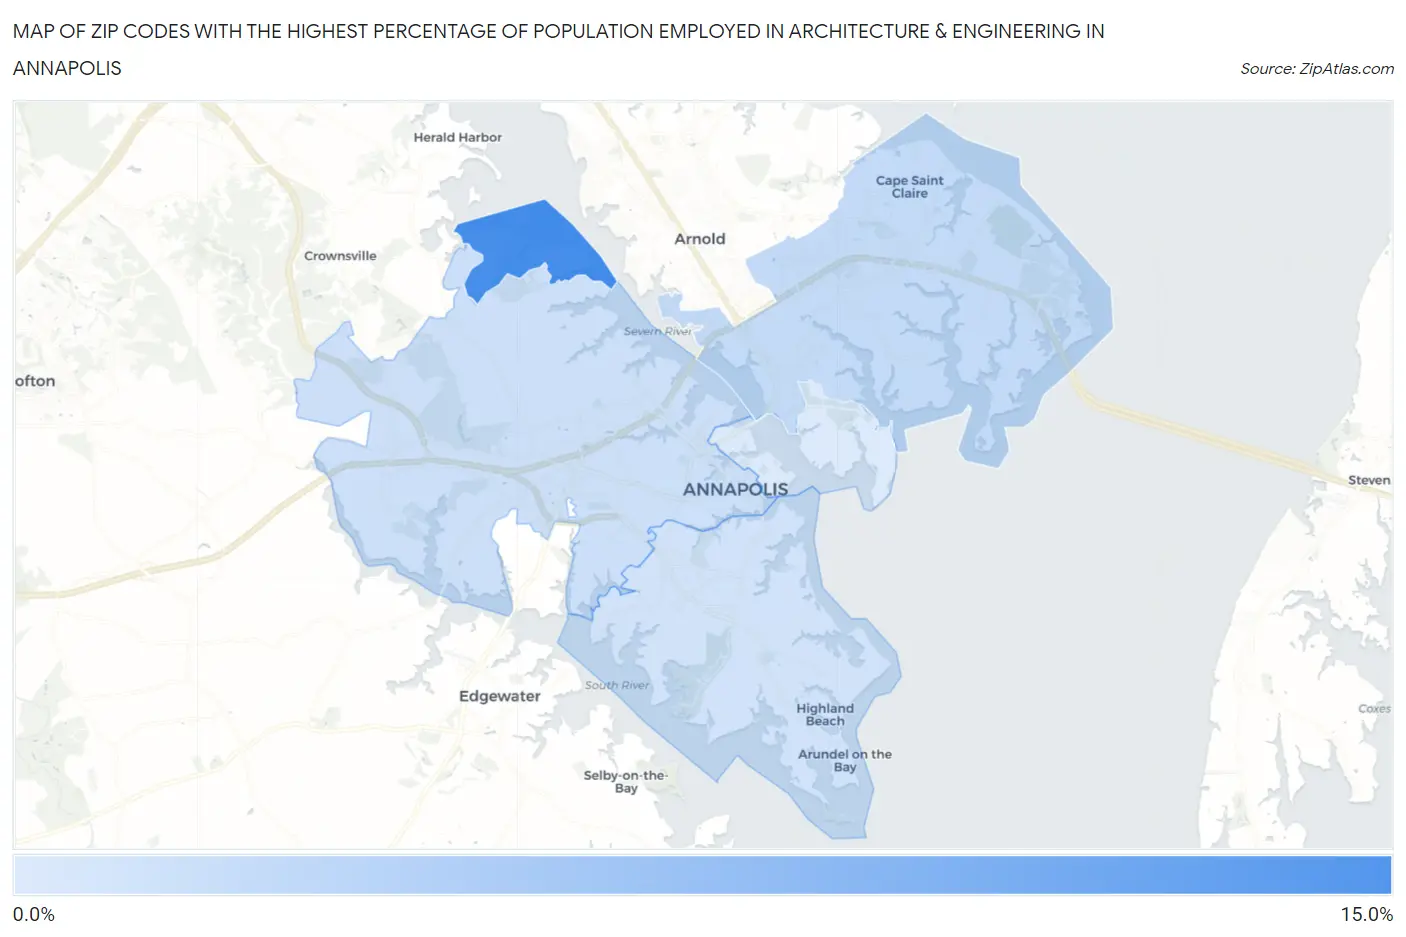
Map of Zip Codes with the Highest Percentage of Population Employed in Architecture & Engineering in Annapolis
0.0%
15.0%
Zip Codes with the Highest Percentage of Population Employed in Architecture & Engineering in Annapolis, MD
| Zip Code | % Employed | vs State | vs National | |
| 1. | 21405 | 12.9% | 2.4%(+10.5)#11 | 2.1%(+10.7)#203 |
| 2. | 21409 | 3.5% | 2.4%(+1.15)#89 | 2.1%(+1.39)#3,644 |
| 3. | 21401 | 3.0% | 2.4%(+0.589)#123 | 2.1%(+0.827)#5,133 |
| 4. | 21403 | 2.5% | 2.4%(+0.153)#165 | 2.1%(+0.391)#6,833 |
| 5. | 21402 | 1.8% | 2.4%(-0.617)#238 | 2.1%(-0.379)#11,005 |
1
Common Questions
What are the Top 3 Zip Codes with the Highest Percentage of Population Employed in Architecture & Engineering in Annapolis, MD?
Top 3 Zip Codes with the Highest Percentage of Population Employed in Architecture & Engineering in Annapolis, MD are:
What zip code has the Highest Percentage of Population Employed in Architecture & Engineering in Annapolis, MD?
21405 has the Highest Percentage of Population Employed in Architecture & Engineering in Annapolis, MD with 12.9%.
What is the Percentage of Population Employed in Architecture & Engineering in Annapolis, MD?
Percentage of Population Employed in Architecture & Engineering in Annapolis is 2.2%.
What is the Percentage of Population Employed in Architecture & Engineering in Maryland?
Percentage of Population Employed in Architecture & Engineering in Maryland is 2.4%.
What is the Percentage of Population Employed in Architecture & Engineering in the United States?
Percentage of Population Employed in Architecture & Engineering in the United States is 2.1%.