Zip Codes with the Highest Percentage of Population Employed in Architecture & Engineering in Columbia, MD
RELATED REPORTS & OPTIONS
Architecture & Engineering
Columbia
Compare Zip Codes
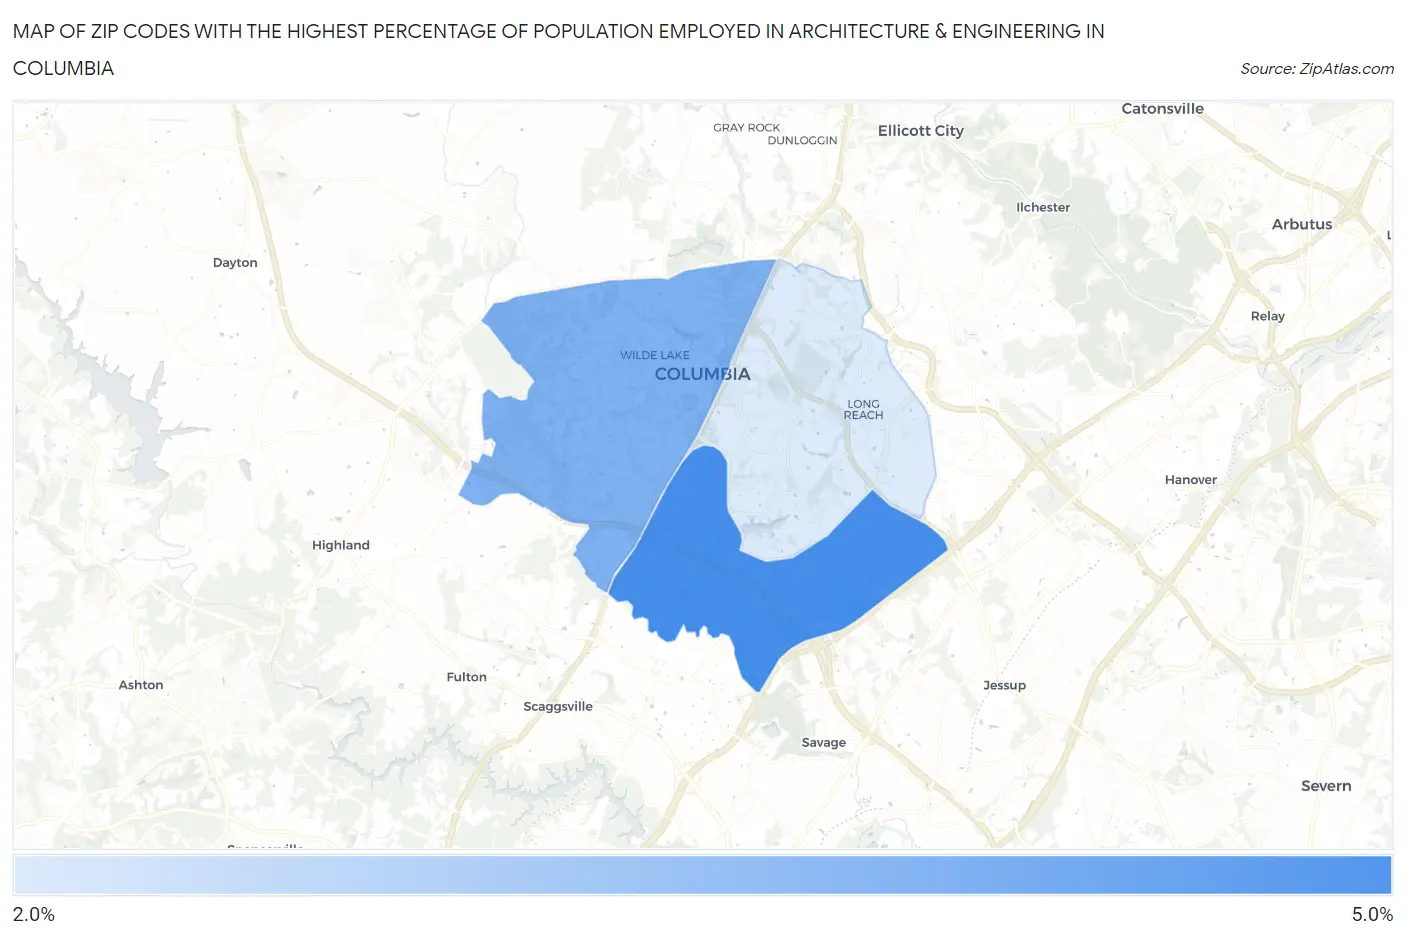
Map of Zip Codes with the Highest Percentage of Population Employed in Architecture & Engineering in Columbia
0.0%
5.0%
Zip Codes with the Highest Percentage of Population Employed in Architecture & Engineering in Columbia, MD
| Zip Code | % Employed | vs State | vs National | |
| 1. | 21046 | 4.8% | 2.4%(+2.42)#46 | 2.1%(+2.66)#1,828 |
| 2. | 21044 | 4.1% | 2.4%(+1.69)#66 | 2.1%(+1.93)#2,656 |
| 3. | 21045 | 2.9% | 2.4%(+0.467)#136 | 2.1%(+0.705)#5,566 |
1
Common Questions
What are the Top Zip Codes with the Highest Percentage of Population Employed in Architecture & Engineering in Columbia, MD?
Top Zip Codes with the Highest Percentage of Population Employed in Architecture & Engineering in Columbia, MD are:
What zip code has the Highest Percentage of Population Employed in Architecture & Engineering in Columbia, MD?
21046 has the Highest Percentage of Population Employed in Architecture & Engineering in Columbia, MD with 4.8%.
What is the Percentage of Population Employed in Architecture & Engineering in Columbia, MD?
Percentage of Population Employed in Architecture & Engineering in Columbia is 3.7%.
What is the Percentage of Population Employed in Architecture & Engineering in Maryland?
Percentage of Population Employed in Architecture & Engineering in Maryland is 2.4%.
What is the Percentage of Population Employed in Architecture & Engineering in the United States?
Percentage of Population Employed in Architecture & Engineering in the United States is 2.1%.