Zip Codes with the Highest Percentage of Population with a Degree in Science and Engineering in Silver Spring, MD
RELATED REPORTS & OPTIONS
Science and Engineering
Silver Spring
Compare Zip Codes
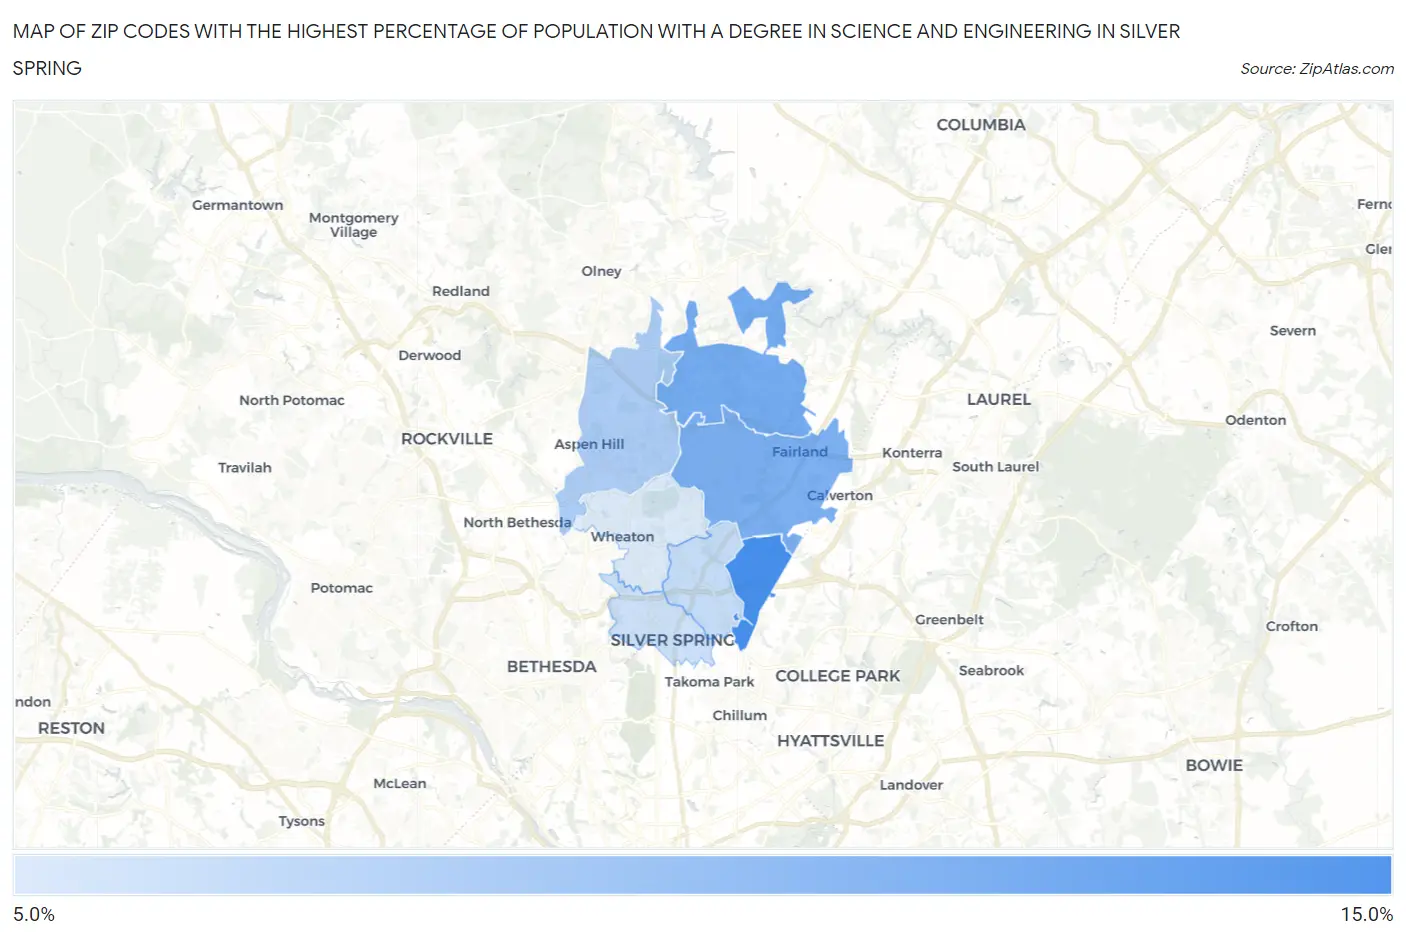
Map of Zip Codes with the Highest Percentage of Population with a Degree in Science and Engineering in Silver Spring
0.0%
15.0%
Zip Codes with the Highest Percentage of Population with a Degree in Science and Engineering in Silver Spring, MD
| Zip Code | % Graduates | vs State | vs National | |
| 1. | 20903 | 13.2% | 8.8%(+4.37)#78 | 9.8%(+3.39)#8,971 |
| 2. | 20905 | 10.7% | 8.8%(+1.90)#128 | 9.8%(+0.929)#13,504 |
| 3. | 20904 | 10.4% | 8.8%(+1.63)#141 | 9.8%(+0.657)#14,093 |
| 4. | 20906 | 7.9% | 8.8%(-0.939)#264 | 9.8%(-1.91)#19,933 |
| 5. | 20901 | 6.6% | 8.8%(-2.20)#314 | 9.8%(-3.17)#22,398 |
| 6. | 20910 | 6.3% | 8.8%(-2.55)#331 | 9.8%(-3.52)#22,994 |
| 7. | 20902 | 5.5% | 8.8%(-3.30)#351 | 9.8%(-4.28)#24,122 |
1
Common Questions
What are the Top 5 Zip Codes with the Highest Percentage of Population with a Degree in Science and Engineering in Silver Spring, MD?
Top 5 Zip Codes with the Highest Percentage of Population with a Degree in Science and Engineering in Silver Spring, MD are:
What zip code has the Highest Percentage of Population with a Degree in Science and Engineering in Silver Spring, MD?
20903 has the Highest Percentage of Population with a Degree in Science and Engineering in Silver Spring, MD with 13.2%.
What is the Percentage of Population with a Degree in Science and Engineering in Silver Spring, MD?
Percentage of Population with a Degree in Science and Engineering in Silver Spring is 6.8%.
What is the Percentage of Population with a Degree in Science and Engineering in Maryland?
Percentage of Population with a Degree in Science and Engineering in Maryland is 8.8%.
What is the Percentage of Population with a Degree in Science and Engineering in the United States?
Percentage of Population with a Degree in Science and Engineering in the United States is 9.8%.