Zip Codes with the Highest Percentage of Population Employed in Architecture & Engineering in Laurel, MD
RELATED REPORTS & OPTIONS
Architecture & Engineering
Laurel
Compare Zip Codes
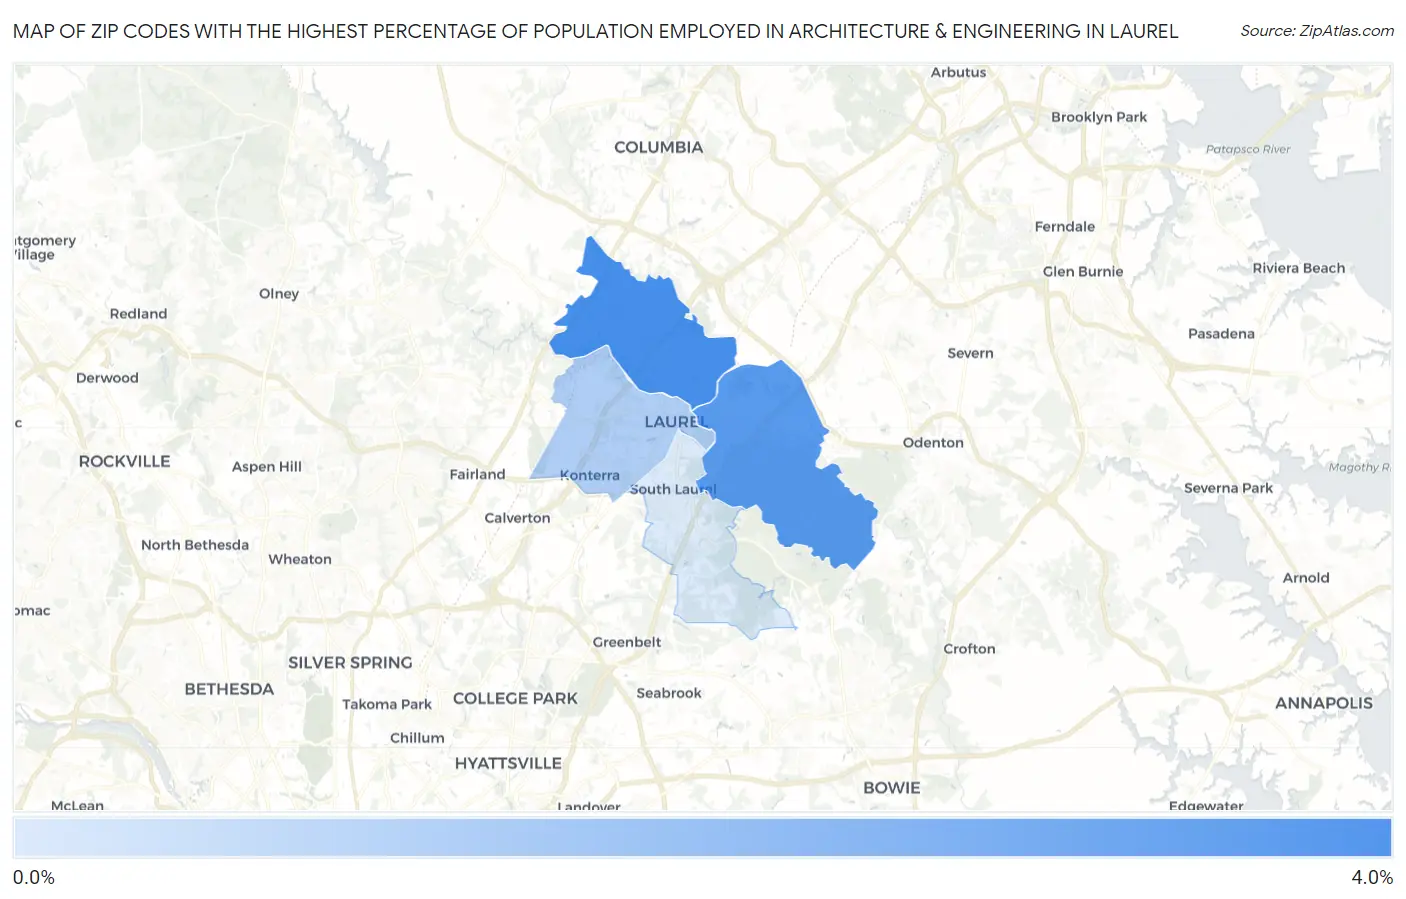
Map of Zip Codes with the Highest Percentage of Population Employed in Architecture & Engineering in Laurel
0.0%
4.0%
Zip Codes with the Highest Percentage of Population Employed in Architecture & Engineering in Laurel, MD
| Zip Code | % Employed | vs State | vs National | |
| 1. | 20723 | 3.8% | 2.4%(+1.46)#77 | 2.1%(+1.70)#3,015 |
| 2. | 20724 | 3.5% | 2.4%(+1.14)#92 | 2.1%(+1.37)#3,672 |
| 3. | 20707 | 1.8% | 2.4%(-0.577)#235 | 2.1%(-0.339)#10,771 |
| 4. | 20708 | 0.92% | 2.4%(-1.47)#316 | 2.1%(-1.23)#17,240 |
1
Common Questions
What are the Top 3 Zip Codes with the Highest Percentage of Population Employed in Architecture & Engineering in Laurel, MD?
Top 3 Zip Codes with the Highest Percentage of Population Employed in Architecture & Engineering in Laurel, MD are:
What zip code has the Highest Percentage of Population Employed in Architecture & Engineering in Laurel, MD?
20723 has the Highest Percentage of Population Employed in Architecture & Engineering in Laurel, MD with 3.8%.
What is the Percentage of Population Employed in Architecture & Engineering in Laurel, MD?
Percentage of Population Employed in Architecture & Engineering in Laurel is 1.5%.
What is the Percentage of Population Employed in Architecture & Engineering in Maryland?
Percentage of Population Employed in Architecture & Engineering in Maryland is 2.4%.
What is the Percentage of Population Employed in Architecture & Engineering in the United States?
Percentage of Population Employed in Architecture & Engineering in the United States is 2.1%.