Zip Codes with the Highest Percentage of Population with a Degree in Visual and Performing Arts in Bethesda, MD
RELATED REPORTS & OPTIONS
Visual and Performing Arts
Bethesda
Compare Zip Codes
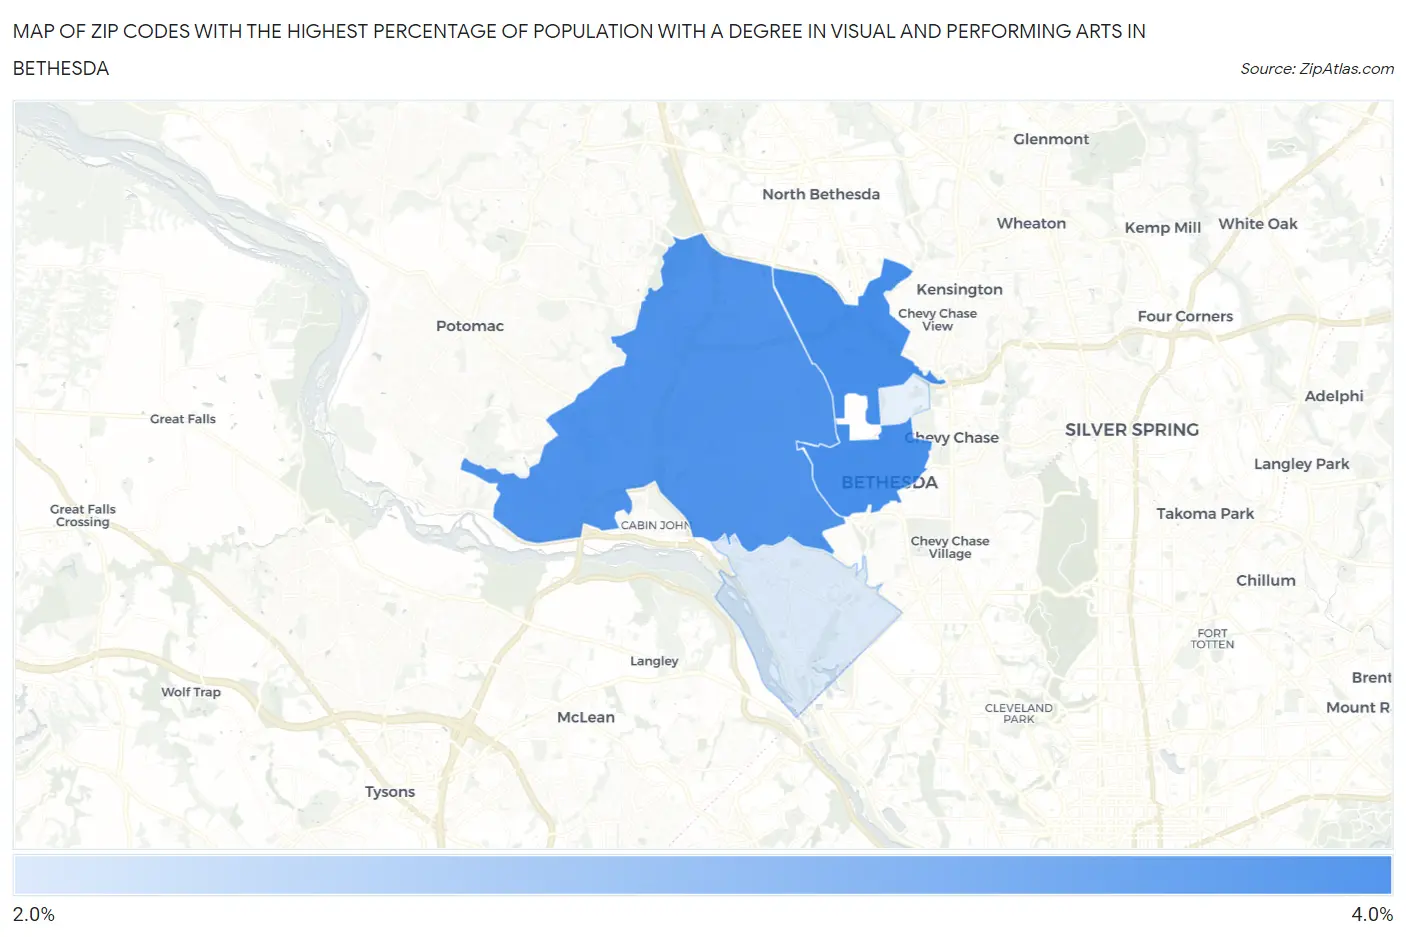
Map of Zip Codes with the Highest Percentage of Population with a Degree in Visual and Performing Arts in Bethesda
0.0%
4.0%
Zip Codes with the Highest Percentage of Population with a Degree in Visual and Performing Arts in Bethesda, MD
| Zip Code | % Graduates | vs State | vs National | |
| 1. | 20814 | 3.5% | 3.8%(-0.367)#205 | 4.3%(-0.796)#11,047 |
| 2. | 20817 | 3.4% | 3.8%(-0.418)#211 | 4.3%(-0.847)#11,241 |
| 3. | 20816 | 2.7% | 3.8%(-1.14)#254 | 4.3%(-1.57)#13,951 |
1
Common Questions
What are the Top 3 Zip Codes with the Highest Percentage of Population with a Degree in Visual and Performing Arts in Bethesda, MD?
Top 3 Zip Codes with the Highest Percentage of Population with a Degree in Visual and Performing Arts in Bethesda, MD are:
What zip code has the Highest Percentage of Population with a Degree in Visual and Performing Arts in Bethesda, MD?
20814 has the Highest Percentage of Population with a Degree in Visual and Performing Arts in Bethesda, MD with 3.5%.
What is the Percentage of Population with a Degree in Visual and Performing Arts in Bethesda, MD?
Percentage of Population with a Degree in Visual and Performing Arts in Bethesda is 3.2%.
What is the Percentage of Population with a Degree in Visual and Performing Arts in Maryland?
Percentage of Population with a Degree in Visual and Performing Arts in Maryland is 3.8%.
What is the Percentage of Population with a Degree in Visual and Performing Arts in the United States?
Percentage of Population with a Degree in Visual and Performing Arts in the United States is 4.3%.