Zip Codes with the Highest Percentage of Population Employed in Community & Social Service in Bethesda, MD
RELATED REPORTS & OPTIONS
Community & Social Service
Bethesda
Compare Zip Codes
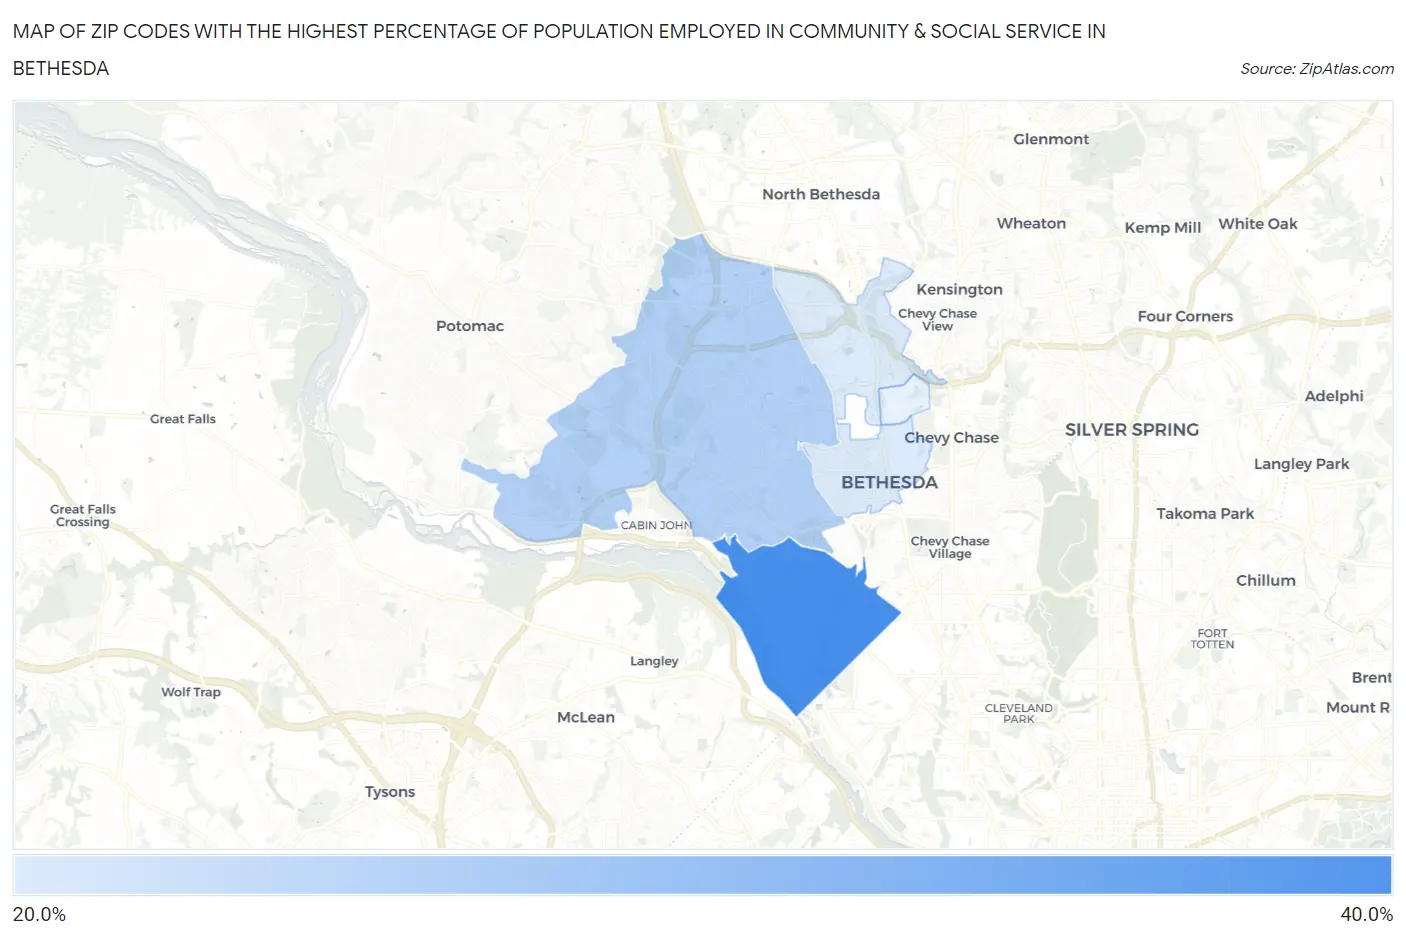
Map of Zip Codes with the Highest Percentage of Population Employed in Community & Social Service in Bethesda
0.0%
40.0%
Zip Codes with the Highest Percentage of Population Employed in Community & Social Service in Bethesda, MD
| Zip Code | % Employed | vs State | vs National | |
| 1. | 20816 | 31.7% | 12.6%(+19.1)#9 | 11.2%(+20.5)#504 |
| 2. | 20817 | 24.1% | 12.6%(+11.5)#15 | 11.2%(+12.9)#1,093 |
| 3. | 20814 | 21.2% | 12.6%(+8.58)#30 | 11.2%(+9.97)#1,665 |
1
Common Questions
What are the Top 3 Zip Codes with the Highest Percentage of Population Employed in Community & Social Service in Bethesda, MD?
Top 3 Zip Codes with the Highest Percentage of Population Employed in Community & Social Service in Bethesda, MD are:
What zip code has the Highest Percentage of Population Employed in Community & Social Service in Bethesda, MD?
20816 has the Highest Percentage of Population Employed in Community & Social Service in Bethesda, MD with 31.7%.
What is the Percentage of Population Employed in Community & Social Service in Bethesda, MD?
Percentage of Population Employed in Community & Social Service in Bethesda is 25.1%.
What is the Percentage of Population Employed in Community & Social Service in Maryland?
Percentage of Population Employed in Community & Social Service in Maryland is 12.6%.
What is the Percentage of Population Employed in Community & Social Service in the United States?
Percentage of Population Employed in Community & Social Service in the United States is 11.2%.