Zip Codes with the Highest Percentage of Population with a Degree in Visual and Performing Arts in Laurel, MD
RELATED REPORTS & OPTIONS
Visual and Performing Arts
Laurel
Compare Zip Codes
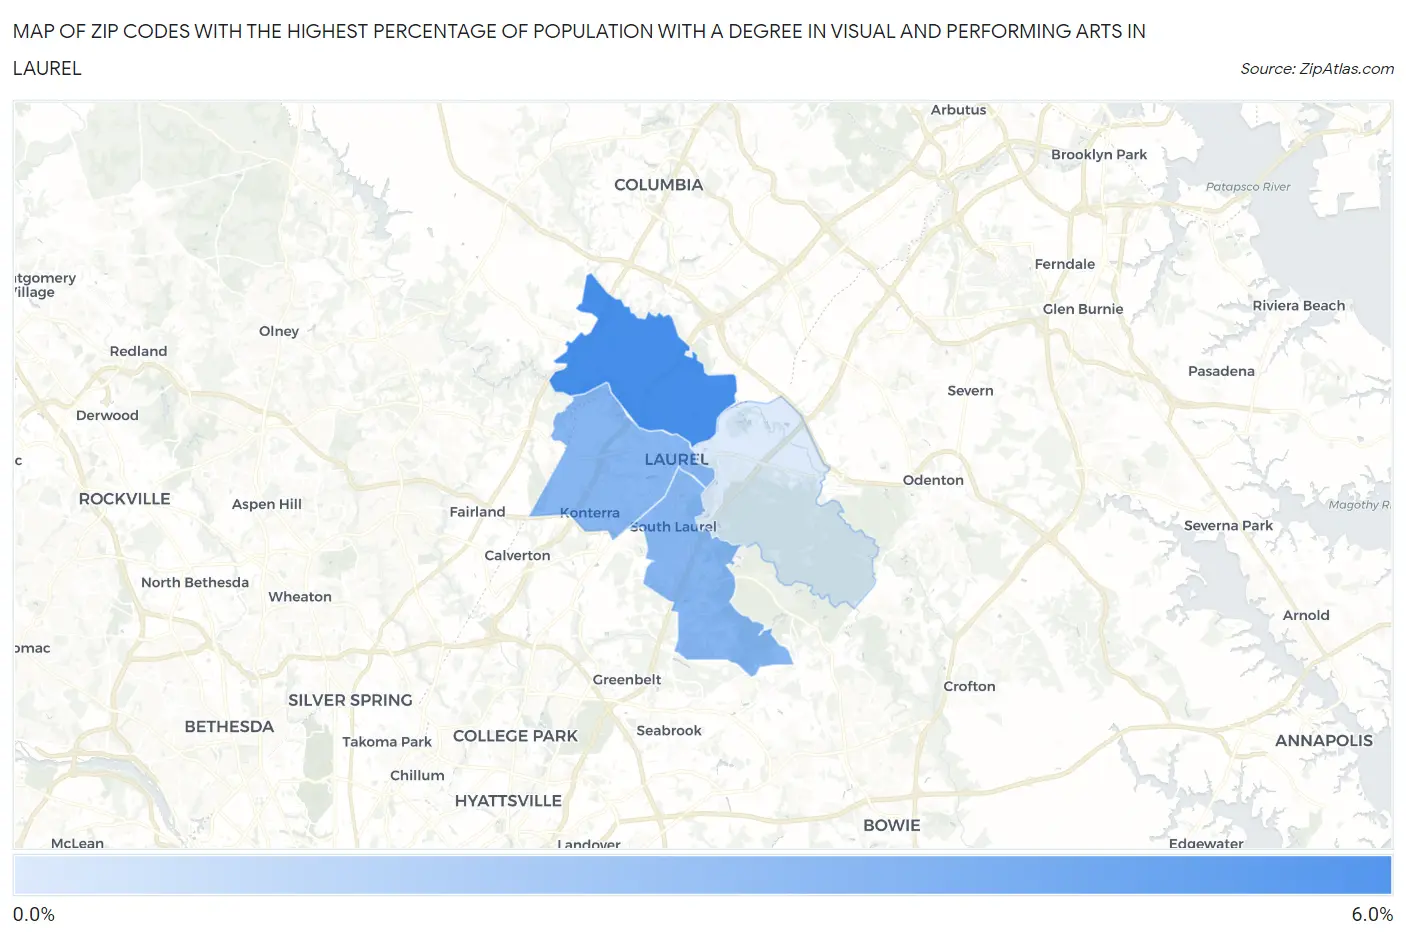
Map of Zip Codes with the Highest Percentage of Population with a Degree in Visual and Performing Arts in Laurel
0.0%
6.0%
Zip Codes with the Highest Percentage of Population with a Degree in Visual and Performing Arts in Laurel, MD
| Zip Code | % Graduates | vs State | vs National | |
| 1. | 20723 | 5.3% | 3.8%(+1.45)#95 | 4.3%(+1.02)#6,108 |
| 2. | 20707 | 3.4% | 3.8%(-0.455)#214 | 4.3%(-0.884)#11,361 |
| 3. | 20708 | 3.4% | 3.8%(-0.465)#217 | 4.3%(-0.894)#11,398 |
| 4. | 20724 | 0.88% | 3.8%(-2.94)#343 | 4.3%(-3.37)#19,980 |
1
Common Questions
What are the Top 3 Zip Codes with the Highest Percentage of Population with a Degree in Visual and Performing Arts in Laurel, MD?
Top 3 Zip Codes with the Highest Percentage of Population with a Degree in Visual and Performing Arts in Laurel, MD are:
What zip code has the Highest Percentage of Population with a Degree in Visual and Performing Arts in Laurel, MD?
20723 has the Highest Percentage of Population with a Degree in Visual and Performing Arts in Laurel, MD with 5.3%.
What is the Percentage of Population with a Degree in Visual and Performing Arts in Laurel, MD?
Percentage of Population with a Degree in Visual and Performing Arts in Laurel is 3.1%.
What is the Percentage of Population with a Degree in Visual and Performing Arts in Maryland?
Percentage of Population with a Degree in Visual and Performing Arts in Maryland is 3.8%.
What is the Percentage of Population with a Degree in Visual and Performing Arts in the United States?
Percentage of Population with a Degree in Visual and Performing Arts in the United States is 4.3%.