Zip Codes with the Highest Percentage of Population with a Degree in Visual and Performing Arts in Frederick, MD
RELATED REPORTS & OPTIONS
Visual and Performing Arts
Frederick
Compare Zip Codes
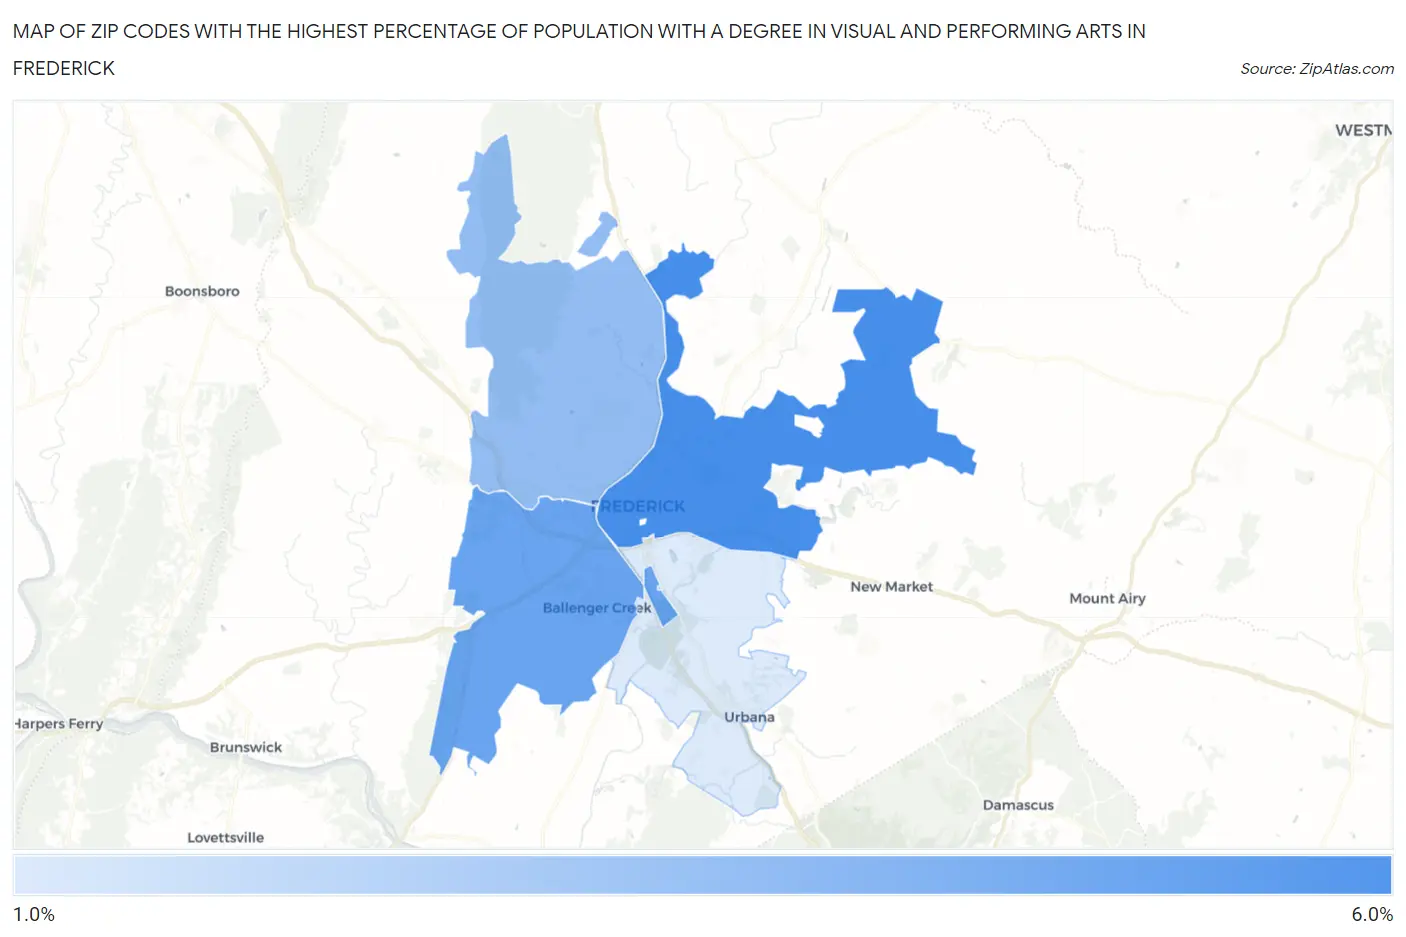
Map of Zip Codes with the Highest Percentage of Population with a Degree in Visual and Performing Arts in Frederick
0.0%
6.0%
Zip Codes with the Highest Percentage of Population with a Degree in Visual and Performing Arts in Frederick, MD
| Zip Code | % Graduates | vs State | vs National | |
| 1. | 21701 | 5.2% | 3.8%(+1.34)#100 | 4.3%(+0.909)#6,319 |
| 2. | 21703 | 4.4% | 3.8%(+0.606)#137 | 4.3%(+0.177)#8,014 |
| 3. | 21702 | 3.6% | 3.8%(-0.273)#200 | 4.3%(-0.702)#10,700 |
| 4. | 21704 | 2.0% | 3.8%(-1.86)#299 | 4.3%(-2.28)#16,559 |
1
Common Questions
What are the Top 3 Zip Codes with the Highest Percentage of Population with a Degree in Visual and Performing Arts in Frederick, MD?
Top 3 Zip Codes with the Highest Percentage of Population with a Degree in Visual and Performing Arts in Frederick, MD are:
What zip code has the Highest Percentage of Population with a Degree in Visual and Performing Arts in Frederick, MD?
21701 has the Highest Percentage of Population with a Degree in Visual and Performing Arts in Frederick, MD with 5.2%.
What is the Percentage of Population with a Degree in Visual and Performing Arts in Frederick, MD?
Percentage of Population with a Degree in Visual and Performing Arts in Frederick is 5.3%.
What is the Percentage of Population with a Degree in Visual and Performing Arts in Maryland?
Percentage of Population with a Degree in Visual and Performing Arts in Maryland is 3.8%.
What is the Percentage of Population with a Degree in Visual and Performing Arts in the United States?
Percentage of Population with a Degree in Visual and Performing Arts in the United States is 4.3%.