Zip Codes with the Highest Percentage of Population Employed in Food Preparation & Serving in Bethesda, MD
RELATED REPORTS & OPTIONS
Food Preparation & Serving
Bethesda
Compare Zip Codes
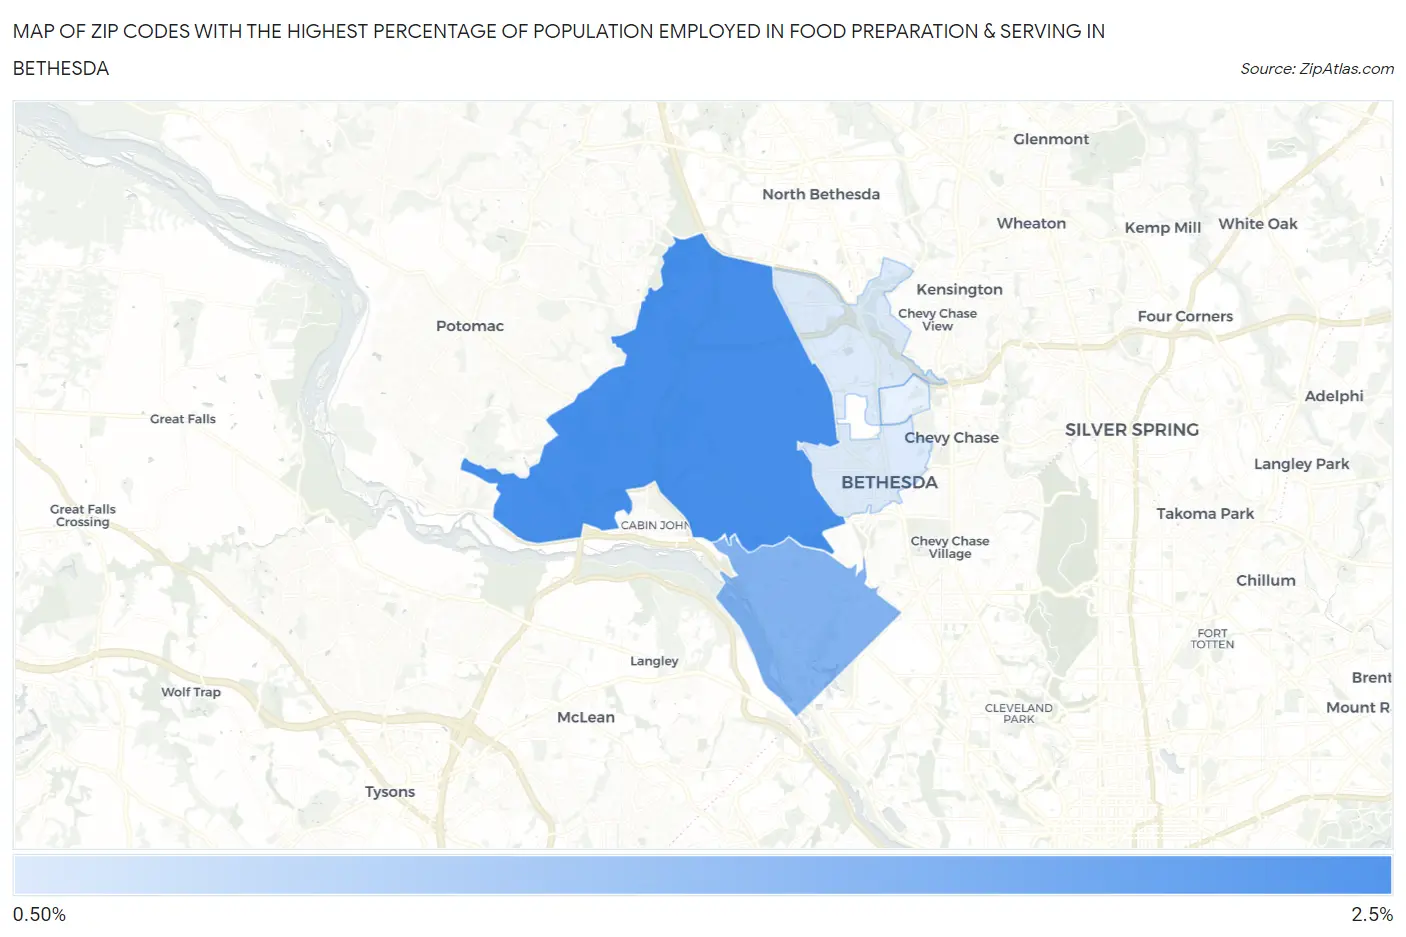
Map of Zip Codes with the Highest Percentage of Population Employed in Food Preparation & Serving in Bethesda
0.0%
2.5%
Zip Codes with the Highest Percentage of Population Employed in Food Preparation & Serving in Bethesda, MD
| Zip Code | % Employed | vs State | vs National | |
| 1. | 20817 | 2.3% | 4.4%(-2.10)#324 | 5.3%(-3.01)#23,845 |
| 2. | 20816 | 1.7% | 4.4%(-2.64)#352 | 5.3%(-3.55)#25,423 |
| 3. | 20814 | 0.95% | 4.4%(-3.43)#376 | 5.3%(-4.33)#27,050 |
1
Common Questions
What are the Top 3 Zip Codes with the Highest Percentage of Population Employed in Food Preparation & Serving in Bethesda, MD?
Top 3 Zip Codes with the Highest Percentage of Population Employed in Food Preparation & Serving in Bethesda, MD are:
What zip code has the Highest Percentage of Population Employed in Food Preparation & Serving in Bethesda, MD?
20817 has the Highest Percentage of Population Employed in Food Preparation & Serving in Bethesda, MD with 2.3%.
What is the Percentage of Population Employed in Food Preparation & Serving in Bethesda, MD?
Percentage of Population Employed in Food Preparation & Serving in Bethesda is 1.5%.
What is the Percentage of Population Employed in Food Preparation & Serving in Maryland?
Percentage of Population Employed in Food Preparation & Serving in Maryland is 4.4%.
What is the Percentage of Population Employed in Food Preparation & Serving in the United States?
Percentage of Population Employed in Food Preparation & Serving in the United States is 5.3%.