Zip Codes with the Highest Percentage of Population with a Degree in Visual and Performing Arts in Rockville, MD
RELATED REPORTS & OPTIONS
Visual and Performing Arts
Rockville
Compare Zip Codes
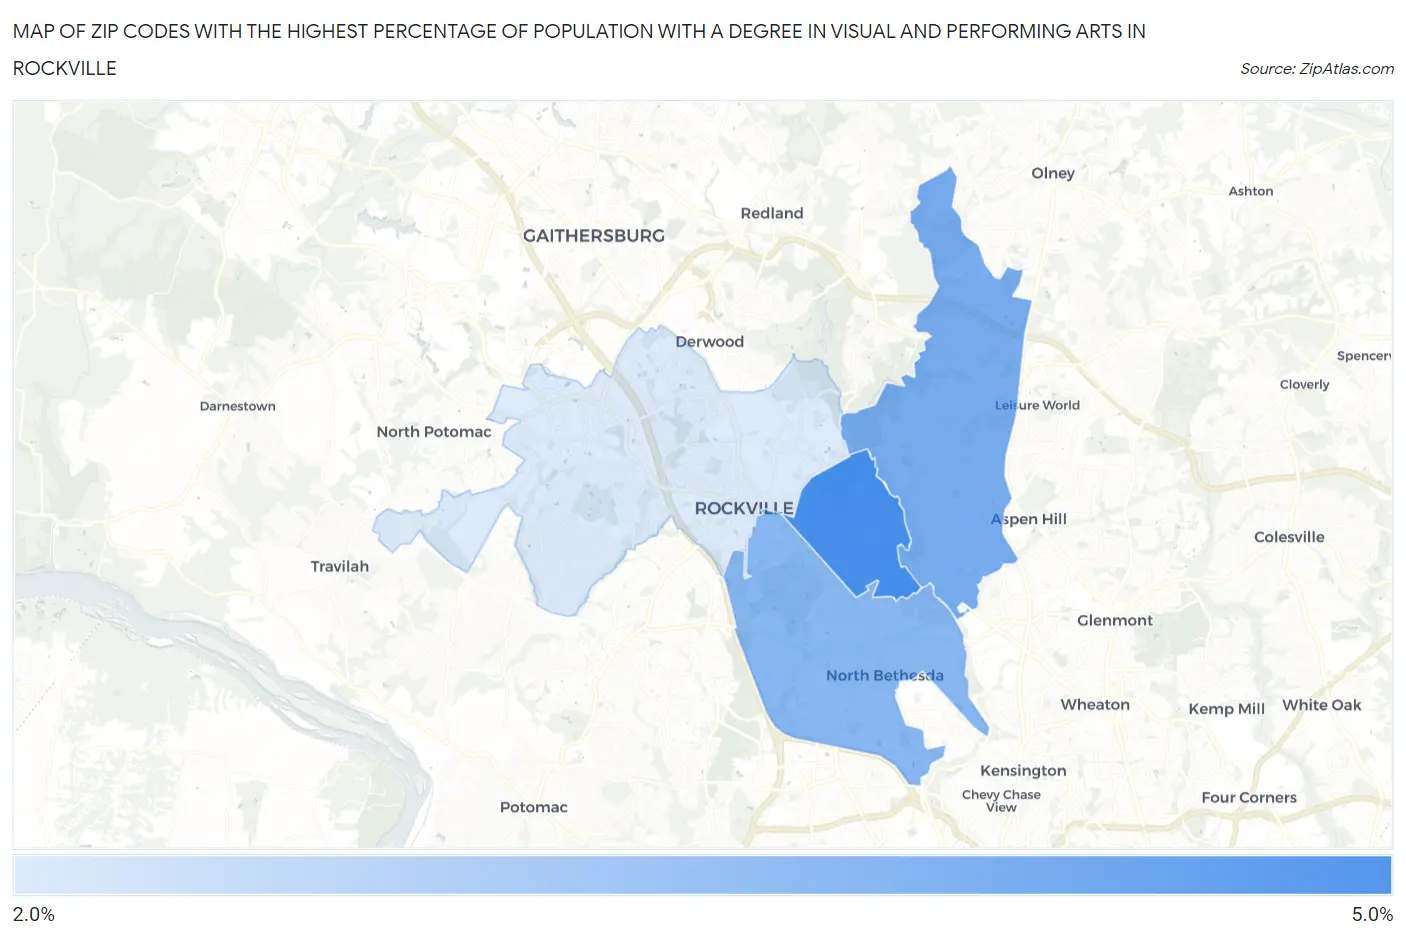
Map of Zip Codes with the Highest Percentage of Population with a Degree in Visual and Performing Arts in Rockville
0.0%
5.0%
Zip Codes with the Highest Percentage of Population with a Degree in Visual and Performing Arts in Rockville, MD
| Zip Code | % Graduates | vs State | vs National | |
| 1. | 20851 | 4.1% | 3.8%(+0.314)#156 | 4.3%(-0.115)#8,808 |
| 2. | 20853 | 3.7% | 3.8%(-0.090)#186 | 4.3%(-0.519)#10,050 |
| 3. | 20852 | 3.6% | 3.8%(-0.212)#195 | 4.3%(-0.641)#10,465 |
| 4. | 20850 | 2.9% | 3.8%(-0.907)#237 | 4.3%(-1.34)#13,031 |
1
Common Questions
What are the Top 3 Zip Codes with the Highest Percentage of Population with a Degree in Visual and Performing Arts in Rockville, MD?
Top 3 Zip Codes with the Highest Percentage of Population with a Degree in Visual and Performing Arts in Rockville, MD are:
What zip code has the Highest Percentage of Population with a Degree in Visual and Performing Arts in Rockville, MD?
20851 has the Highest Percentage of Population with a Degree in Visual and Performing Arts in Rockville, MD with 4.1%.
What is the Percentage of Population with a Degree in Visual and Performing Arts in Rockville, MD?
Percentage of Population with a Degree in Visual and Performing Arts in Rockville is 3.1%.
What is the Percentage of Population with a Degree in Visual and Performing Arts in Maryland?
Percentage of Population with a Degree in Visual and Performing Arts in Maryland is 3.8%.
What is the Percentage of Population with a Degree in Visual and Performing Arts in the United States?
Percentage of Population with a Degree in Visual and Performing Arts in the United States is 4.3%.