Zip Codes with the Highest Percentage of Population Employed in Administrative & Support Services in Bethesda, MD
RELATED REPORTS & OPTIONS
Administrative & Support Services
Bethesda
Compare Zip Codes
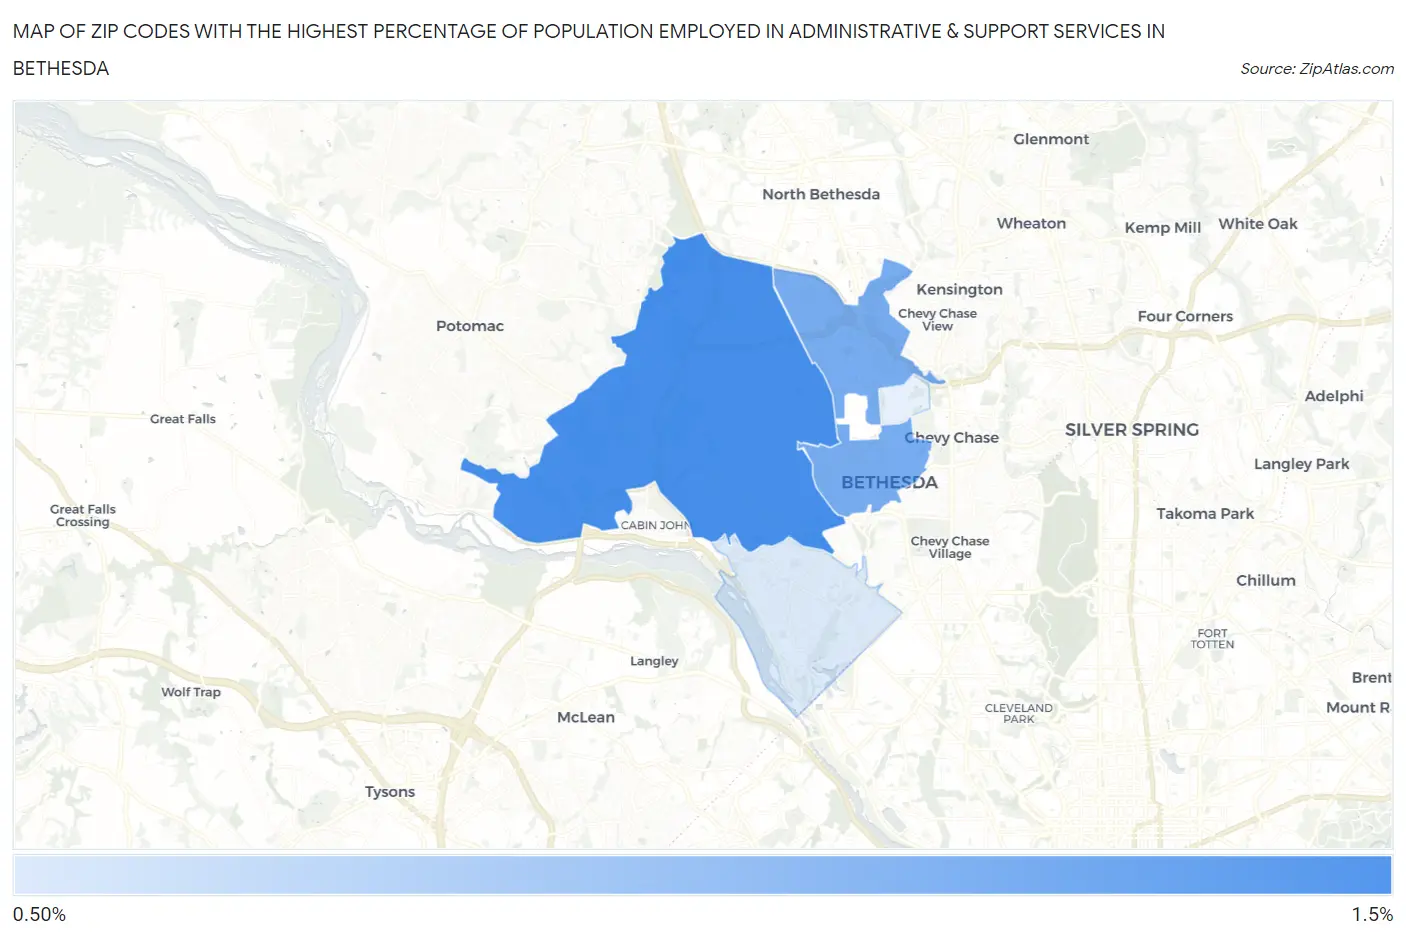
Map of Zip Codes with the Highest Percentage of Population Employed in Administrative & Support Services in Bethesda
0.0%
1.5%
Zip Codes with the Highest Percentage of Population Employed in Administrative & Support Services in Bethesda, MD
| Zip Code | % Employed | vs State | vs National | |
| 1. | 20817 | 1.5% | 4.2%(-2.78)#347 | 4.1%(-2.70)#22,923 |
| 2. | 20814 | 1.2% | 4.2%(-3.00)#353 | 4.1%(-2.92)#23,746 |
| 3. | 20816 | 0.76% | 4.2%(-3.47)#367 | 4.1%(-3.39)#25,213 |
1
Common Questions
What are the Top 3 Zip Codes with the Highest Percentage of Population Employed in Administrative & Support Services in Bethesda, MD?
Top 3 Zip Codes with the Highest Percentage of Population Employed in Administrative & Support Services in Bethesda, MD are:
What zip code has the Highest Percentage of Population Employed in Administrative & Support Services in Bethesda, MD?
20817 has the Highest Percentage of Population Employed in Administrative & Support Services in Bethesda, MD with 1.5%.
What is the Percentage of Population Employed in Administrative & Support Services in Bethesda, MD?
Percentage of Population Employed in Administrative & Support Services in Bethesda is 1.2%.
What is the Percentage of Population Employed in Administrative & Support Services in Maryland?
Percentage of Population Employed in Administrative & Support Services in Maryland is 4.2%.
What is the Percentage of Population Employed in Administrative & Support Services in the United States?
Percentage of Population Employed in Administrative & Support Services in the United States is 4.1%.