Zip Codes with the Highest Percentage of Population Employed in Life, Physical & Social Science in Bethesda, MD
RELATED REPORTS & OPTIONS
Life, Physical & Social Science
Bethesda
Compare Zip Codes
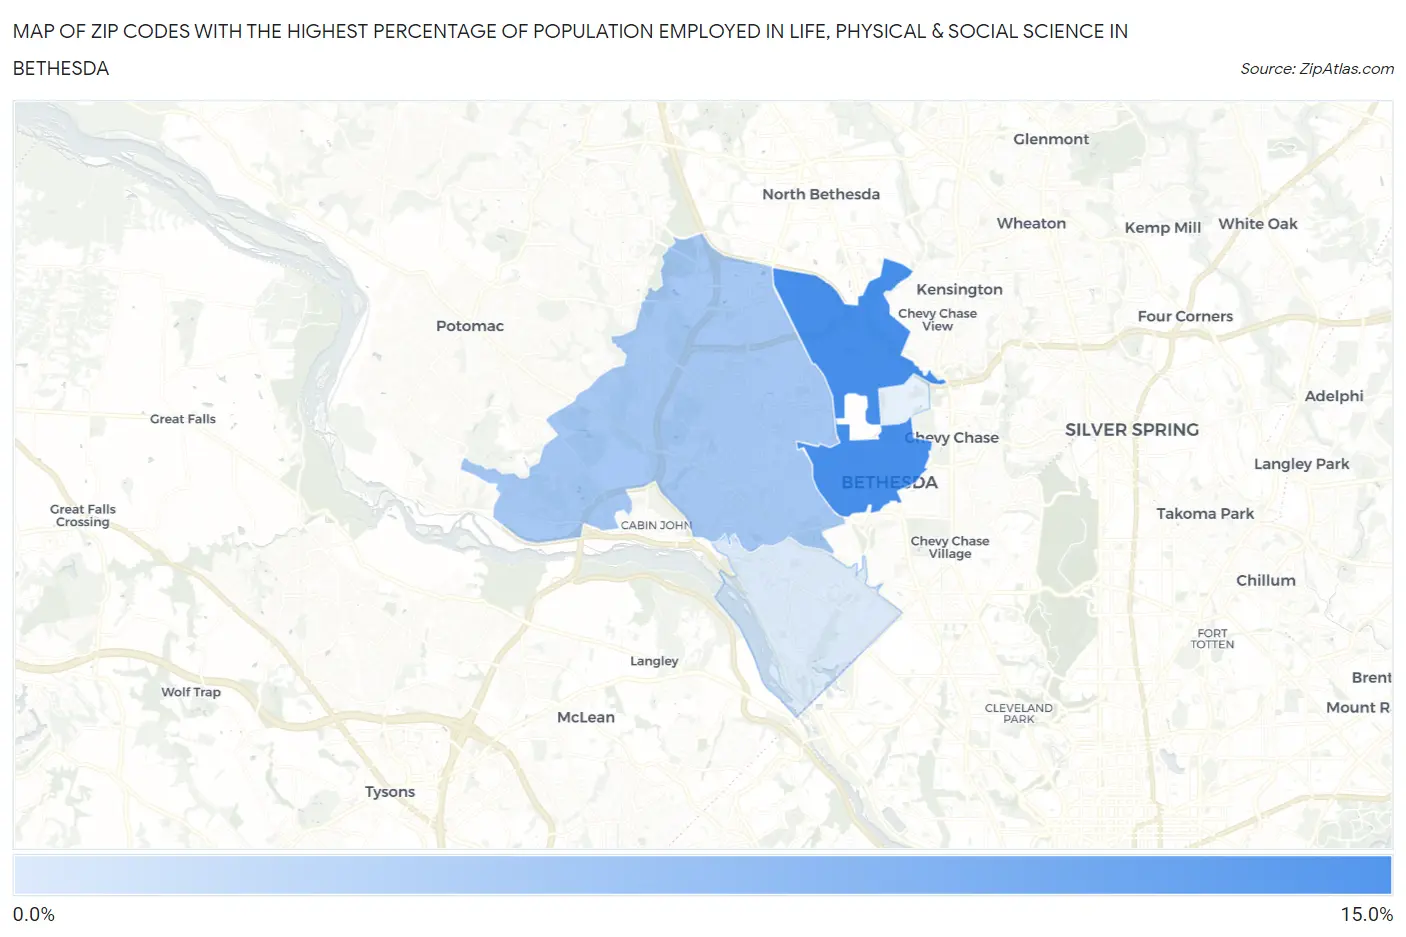
Map of Zip Codes with the Highest Percentage of Population Employed in Life, Physical & Social Science in Bethesda
0.0%
15.0%
Zip Codes with the Highest Percentage of Population Employed in Life, Physical & Social Science in Bethesda, MD
| Zip Code | % Employed | vs State | vs National | |
| 1. | 20814 | 11.2% | 2.2%(+9.04)#2 | 1.1%(+10.1)#164 |
| 2. | 20817 | 6.9% | 2.2%(+4.76)#11 | 1.1%(+5.82)#420 |
| 3. | 20816 | 4.6% | 2.2%(+2.40)#32 | 1.1%(+3.46)#907 |
1
Common Questions
What are the Top 3 Zip Codes with the Highest Percentage of Population Employed in Life, Physical & Social Science in Bethesda, MD?
Top 3 Zip Codes with the Highest Percentage of Population Employed in Life, Physical & Social Science in Bethesda, MD are:
What zip code has the Highest Percentage of Population Employed in Life, Physical & Social Science in Bethesda, MD?
20814 has the Highest Percentage of Population Employed in Life, Physical & Social Science in Bethesda, MD with 11.2%.
What is the Percentage of Population Employed in Life, Physical & Social Science in Bethesda, MD?
Percentage of Population Employed in Life, Physical & Social Science in Bethesda is 9.2%.
What is the Percentage of Population Employed in Life, Physical & Social Science in Maryland?
Percentage of Population Employed in Life, Physical & Social Science in Maryland is 2.2%.
What is the Percentage of Population Employed in Life, Physical & Social Science in the United States?
Percentage of Population Employed in Life, Physical & Social Science in the United States is 1.1%.