Zip Codes with the Highest Percentage of Population with a Degree in Communications in Lenexa, KS
RELATED REPORTS & OPTIONS
Communications
Lenexa
Compare Zip Codes
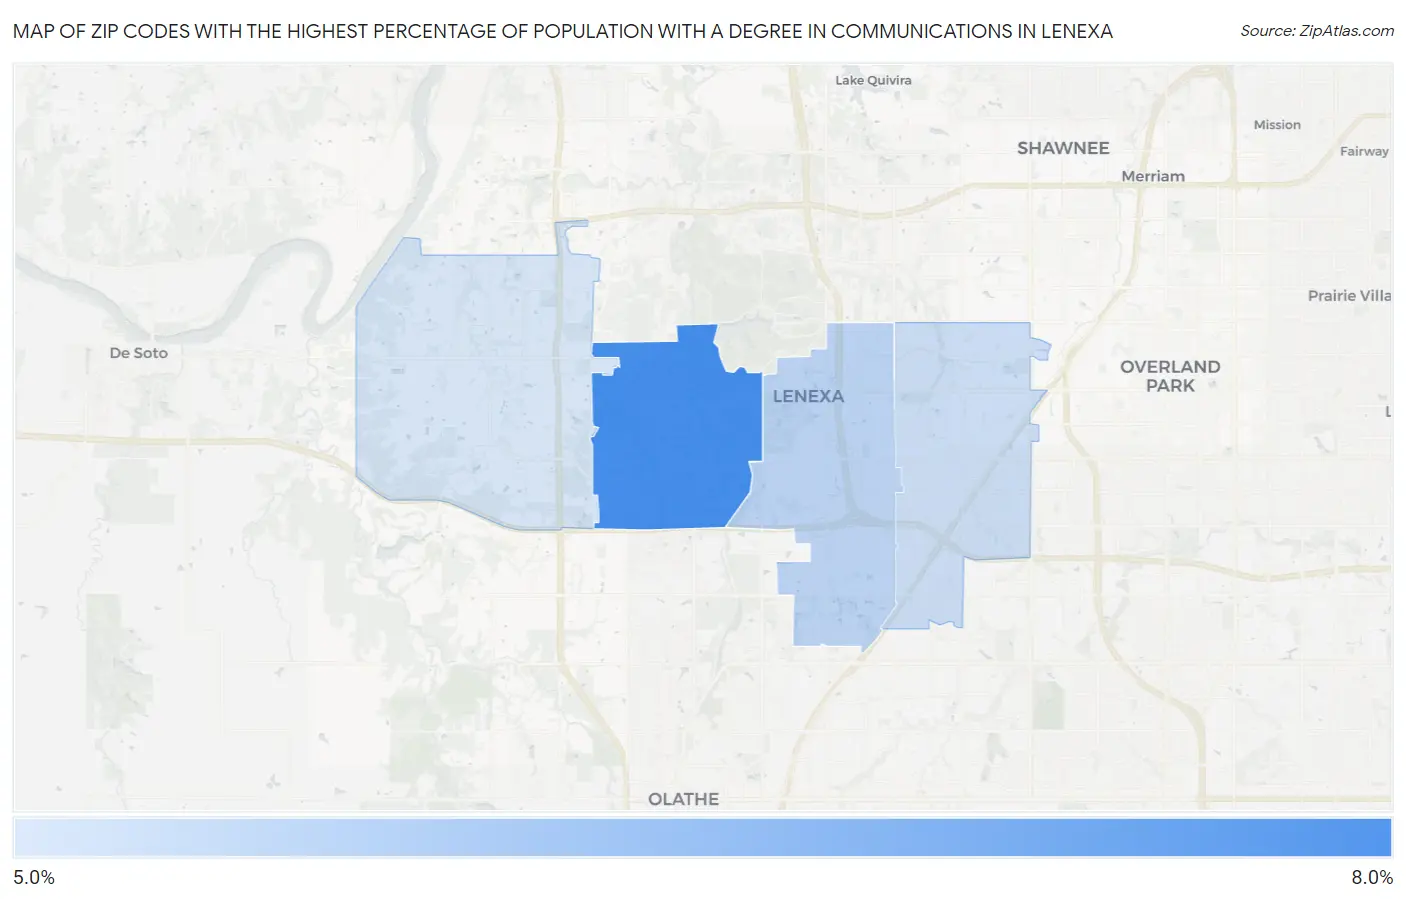
Map of Zip Codes with the Highest Percentage of Population with a Degree in Communications in Lenexa
0.0%
8.0%
Zip Codes with the Highest Percentage of Population with a Degree in Communications in Lenexa, KS
| Zip Code | % Graduates | vs State | vs National | |
| 1. | 66220 | 7.0% | 4.1%(+2.91)#57 | 4.1%(+2.91)#2,566 |
| 2. | 66219 | 5.4% | 4.1%(+1.27)#96 | 4.1%(+1.28)#4,818 |
| 3. | 66215 | 5.2% | 4.1%(+1.07)#100 | 4.1%(+1.07)#5,236 |
| 4. | 66227 | 5.1% | 4.1%(+0.924)#107 | 4.1%(+0.926)#5,550 |
1
Common Questions
What are the Top 3 Zip Codes with the Highest Percentage of Population with a Degree in Communications in Lenexa, KS?
Top 3 Zip Codes with the Highest Percentage of Population with a Degree in Communications in Lenexa, KS are:
What zip code has the Highest Percentage of Population with a Degree in Communications in Lenexa, KS?
66220 has the Highest Percentage of Population with a Degree in Communications in Lenexa, KS with 7.0%.
What is the Percentage of Population with a Degree in Communications in Lenexa, KS?
Percentage of Population with a Degree in Communications in Lenexa is 5.8%.
What is the Percentage of Population with a Degree in Communications in Kansas?
Percentage of Population with a Degree in Communications in Kansas is 4.1%.
What is the Percentage of Population with a Degree in Communications in the United States?
Percentage of Population with a Degree in Communications in the United States is 4.1%.