Zip Codes with the Highest Percentage of Population Employed in Real Estate, Rental & Leasing in Lenexa, KS
RELATED REPORTS & OPTIONS
Real Estate, Rental & Leasing
Lenexa
Compare Zip Codes
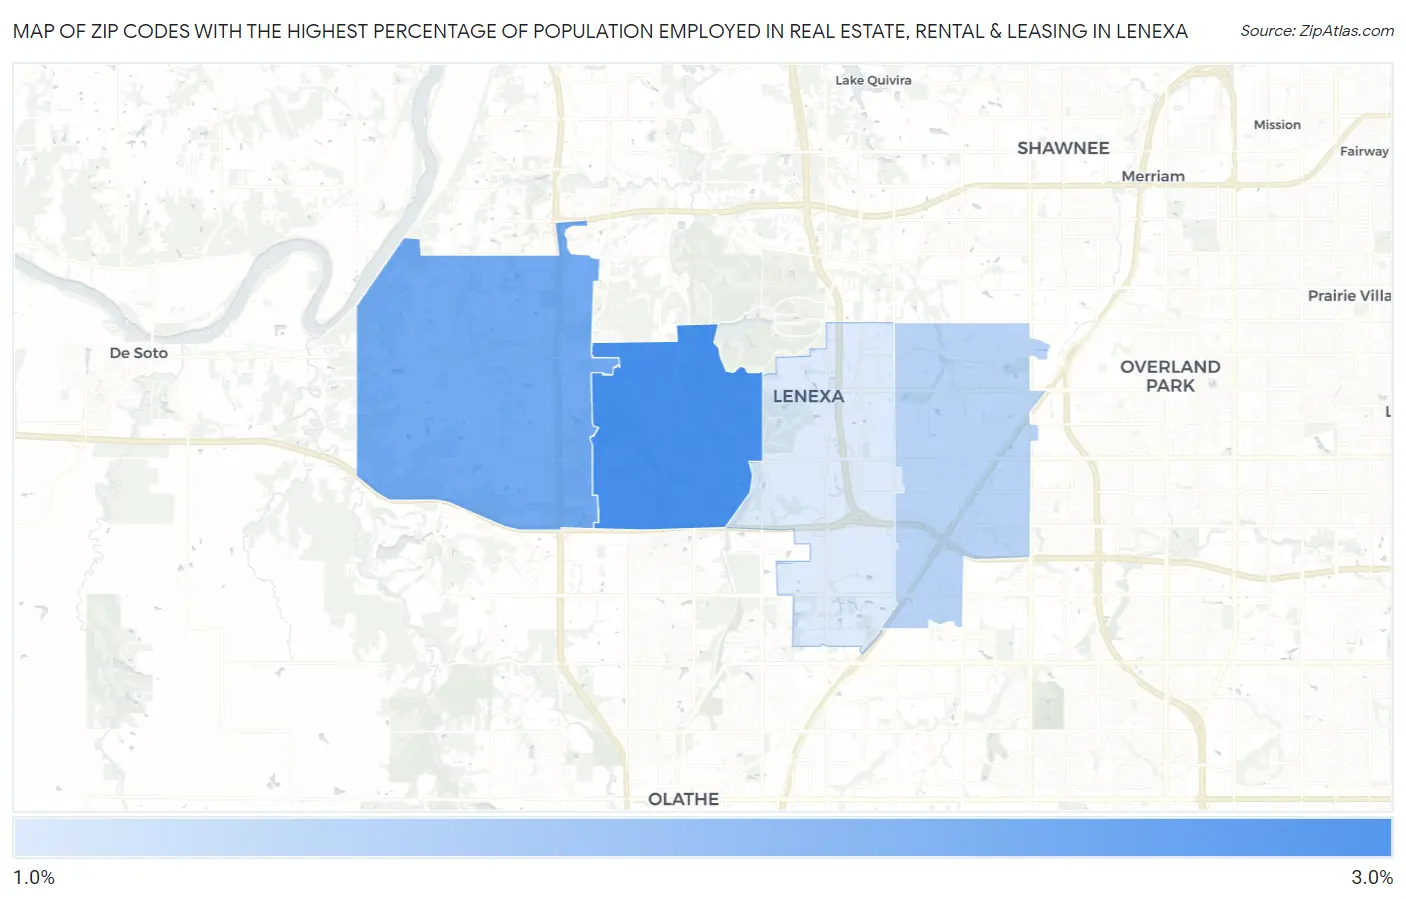
Map of Zip Codes with the Highest Percentage of Population Employed in Real Estate, Rental & Leasing in Lenexa
0.0%
3.0%
Zip Codes with the Highest Percentage of Population Employed in Real Estate, Rental & Leasing in Lenexa, KS
| Zip Code | % Employed | vs State | vs National | |
| 1. | 66220 | 3.0% | 1.4%(+1.59)#42 | 1.9%(+1.08)#3,988 |
| 2. | 66227 | 2.6% | 1.4%(+1.21)#57 | 1.9%(+0.693)#5,147 |
| 3. | 66215 | 2.0% | 1.4%(+0.615)#87 | 1.9%(+0.101)#7,881 |
| 4. | 66219 | 1.7% | 1.4%(+0.295)#114 | 1.9%(-0.219)#9,958 |
1
Common Questions
What are the Top 3 Zip Codes with the Highest Percentage of Population Employed in Real Estate, Rental & Leasing in Lenexa, KS?
Top 3 Zip Codes with the Highest Percentage of Population Employed in Real Estate, Rental & Leasing in Lenexa, KS are:
What zip code has the Highest Percentage of Population Employed in Real Estate, Rental & Leasing in Lenexa, KS?
66220 has the Highest Percentage of Population Employed in Real Estate, Rental & Leasing in Lenexa, KS with 3.0%.
What is the Percentage of Population Employed in Real Estate, Rental & Leasing in Lenexa, KS?
Percentage of Population Employed in Real Estate, Rental & Leasing in Lenexa is 2.1%.
What is the Percentage of Population Employed in Real Estate, Rental & Leasing in Kansas?
Percentage of Population Employed in Real Estate, Rental & Leasing in Kansas is 1.4%.
What is the Percentage of Population Employed in Real Estate, Rental & Leasing in the United States?
Percentage of Population Employed in Real Estate, Rental & Leasing in the United States is 1.9%.