Zip Codes with the Highest Percentage of Population Employed in Accommodation & Food Services in Lenexa, KS
RELATED REPORTS & OPTIONS
Accommodation & Food Services
Lenexa
Compare Zip Codes
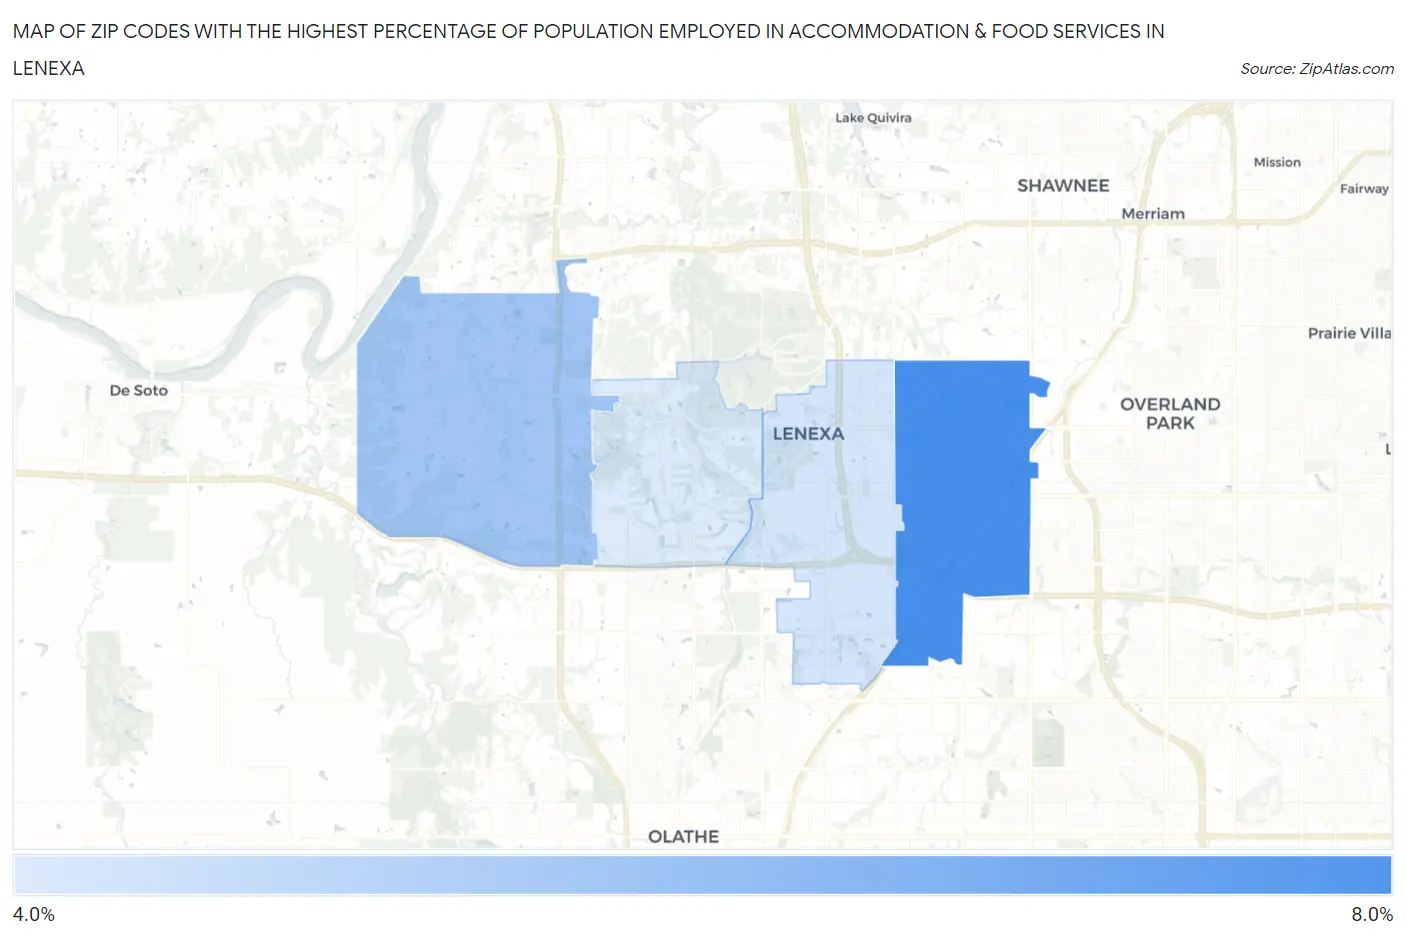
Map of Zip Codes with the Highest Percentage of Population Employed in Accommodation & Food Services in Lenexa
0.0%
8.0%
Zip Codes with the Highest Percentage of Population Employed in Accommodation & Food Services in Lenexa, KS
| Zip Code | % Employed | vs State | vs National | |
| 1. | 66215 | 7.6% | 6.2%(+1.38)#104 | 6.9%(+0.725)#8,740 |
| 2. | 66227 | 5.6% | 6.2%(-0.671)#204 | 6.9%(-1.33)#14,890 |
| 3. | 66219 | 4.4% | 6.2%(-1.82)#264 | 6.9%(-2.47)#18,802 |
| 4. | 66220 | 4.2% | 6.2%(-2.03)#277 | 6.9%(-2.69)#19,514 |
1
Common Questions
What are the Top 3 Zip Codes with the Highest Percentage of Population Employed in Accommodation & Food Services in Lenexa, KS?
Top 3 Zip Codes with the Highest Percentage of Population Employed in Accommodation & Food Services in Lenexa, KS are:
What zip code has the Highest Percentage of Population Employed in Accommodation & Food Services in Lenexa, KS?
66215 has the Highest Percentage of Population Employed in Accommodation & Food Services in Lenexa, KS with 7.6%.
What is the Percentage of Population Employed in Accommodation & Food Services in Lenexa, KS?
Percentage of Population Employed in Accommodation & Food Services in Lenexa is 6.9%.
What is the Percentage of Population Employed in Accommodation & Food Services in Kansas?
Percentage of Population Employed in Accommodation & Food Services in Kansas is 6.2%.
What is the Percentage of Population Employed in Accommodation & Food Services in the United States?
Percentage of Population Employed in Accommodation & Food Services in the United States is 6.9%.