Zip Codes with the Highest Percentage of Immigrants from Eastern Asia in Lenexa, KS
RELATED REPORTS & OPTIONS
Eastern Asia
Lenexa
Compare Zip Codes
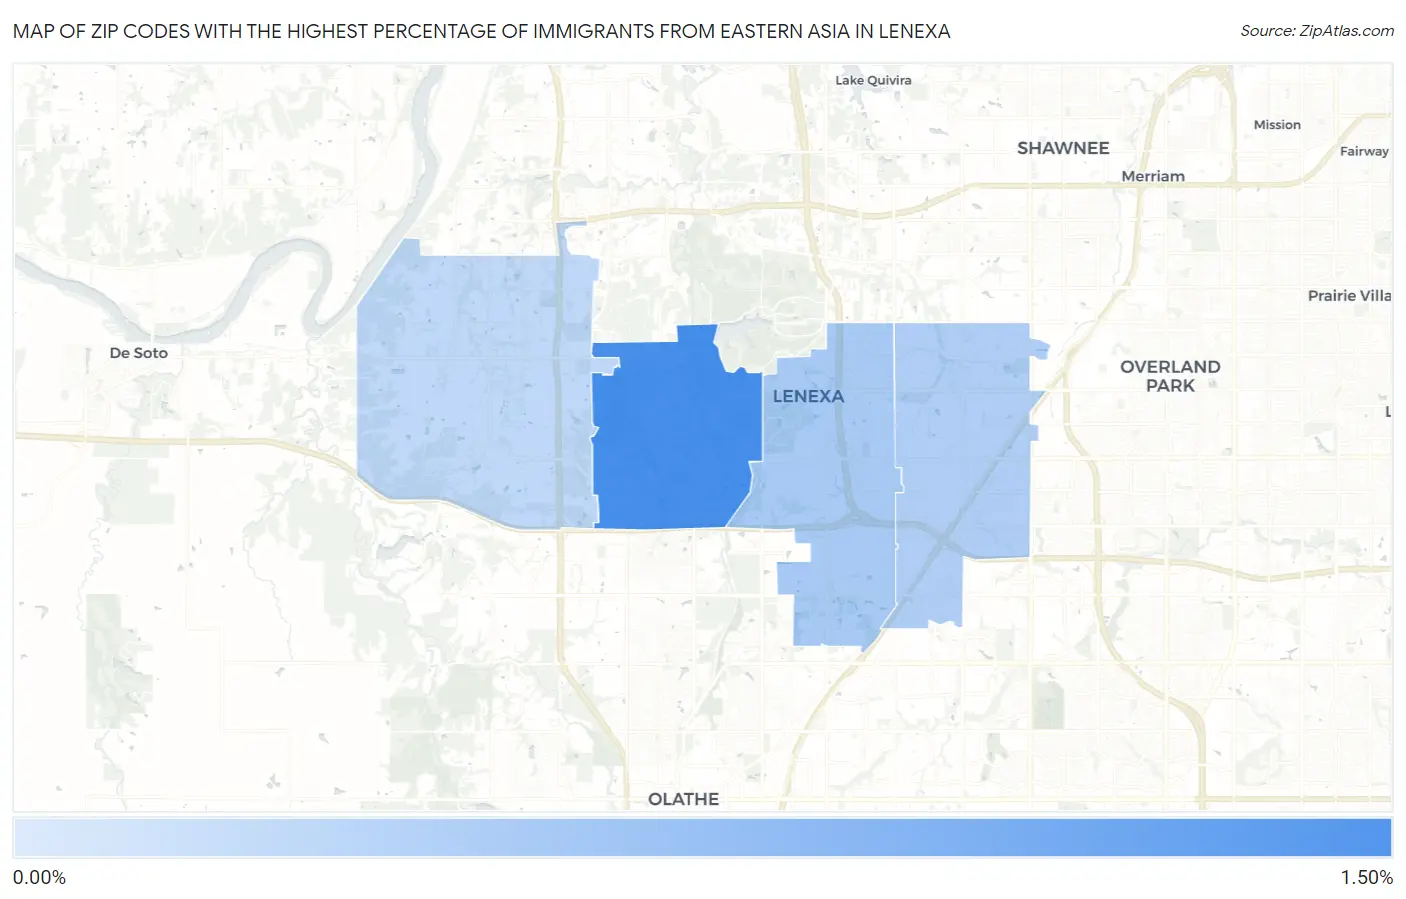
Map of Zip Codes with the Highest Percentage of Immigrants from Eastern Asia in Lenexa
0.00%
1.50%
Zip Codes with the Highest Percentage of Immigrants from Eastern Asia in Lenexa, KS
| Zip Code | Eastern Asia | vs State | vs National | |
| 1. | 66220 | 1.29% | 0.50%(+0.787)#33 | 1.28%(+0.015)#3,077 |
| 2. | 66219 | 0.46% | 0.50%(-0.041)#87 | 1.28%(-0.813)#6,949 |
| 3. | 66215 | 0.40% | 0.50%(-0.104)#97 | 1.28%(-0.876)#7,552 |
| 4. | 66227 | 0.25% | 0.50%(-0.253)#122 | 1.28%(-1.02)#9,450 |
1
Common Questions
What are the Top 3 Zip Codes with the Highest Percentage of Immigrants from Eastern Asia in Lenexa, KS?
Top 3 Zip Codes with the Highest Percentage of Immigrants from Eastern Asia in Lenexa, KS are:
What zip code has the Highest Percentage of Immigrants from Eastern Asia in Lenexa, KS?
66220 has the Highest Percentage of Immigrants from Eastern Asia in Lenexa, KS with 1.29%.
What is the Percentage of Immigrants from Eastern Asia in Lenexa, KS?
Percentage of Immigrants from Eastern Asia in Lenexa is 0.67%.
What is the Percentage of Immigrants from Eastern Asia in Kansas?
Percentage of Immigrants from Eastern Asia in Kansas is 0.50%.
What is the Percentage of Immigrants from Eastern Asia in the United States?
Percentage of Immigrants from Eastern Asia in the United States is 1.28%.