Zip Codes with the Highest Percentage of Immigrants from Eastern Europe in Lenexa, KS
RELATED REPORTS & OPTIONS
Eastern Europe
Lenexa
Compare Zip Codes
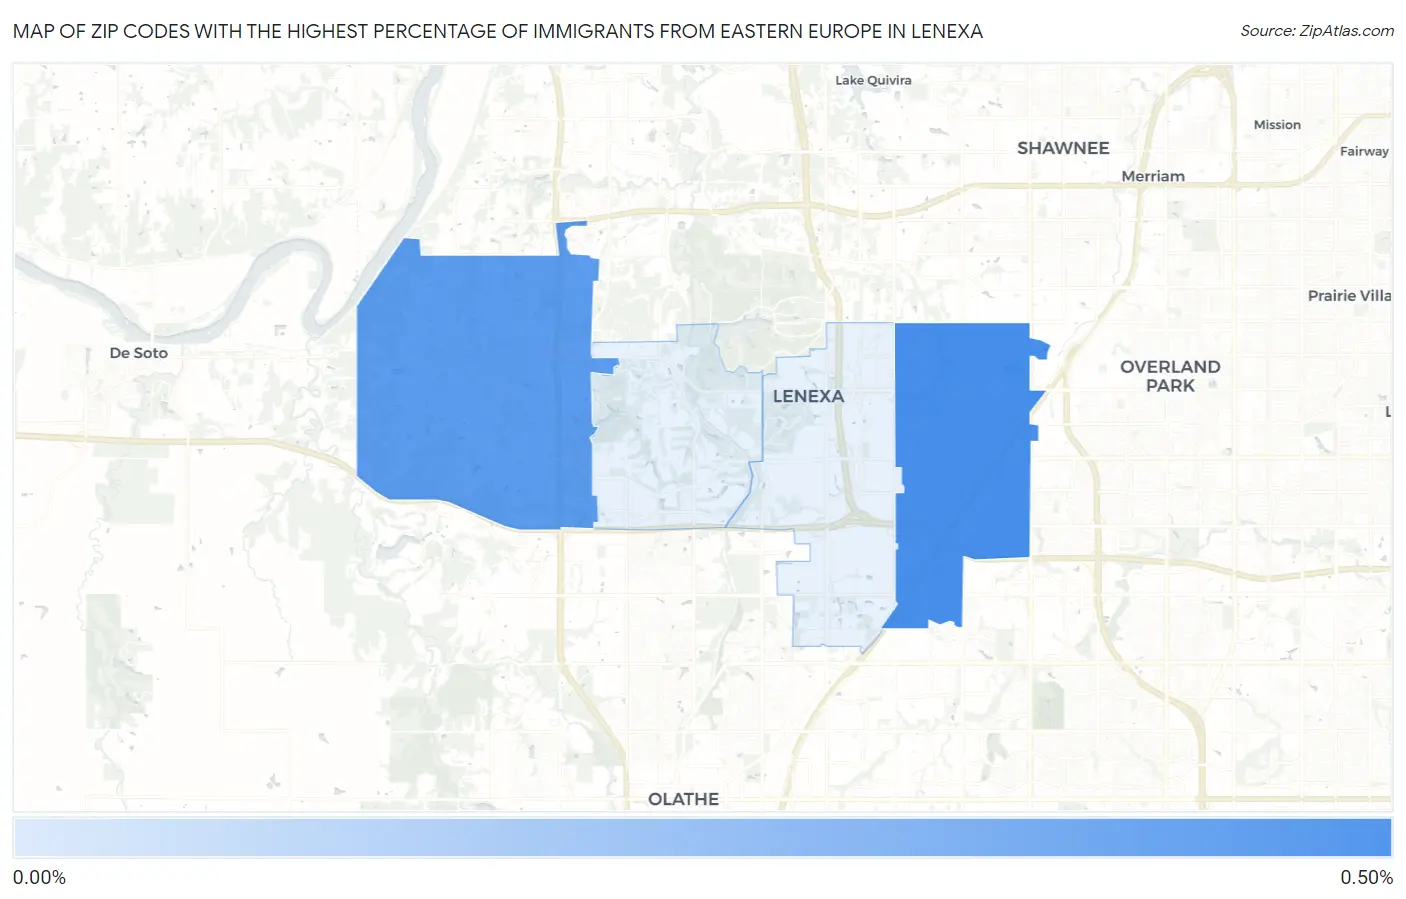
Map of Zip Codes with the Highest Percentage of Immigrants from Eastern Europe in Lenexa
0.00%
0.50%
Zip Codes with the Highest Percentage of Immigrants from Eastern Europe in Lenexa, KS
| Zip Code | Eastern Europe | vs State | vs National | |
| 1. | 66215 | 0.40% | 0.17%(+0.234)#43 | 0.67%(-0.263)#6,335 |
| 2. | 66227 | 0.35% | 0.17%(+0.184)#48 | 0.67%(-0.313)#6,856 |
1
Common Questions
What are the Top 3 Zip Codes with the Highest Percentage of Immigrants from Eastern Europe in Lenexa, KS?
Top 3 Zip Codes with the Highest Percentage of Immigrants from Eastern Europe in Lenexa, KS are:
What zip code has the Highest Percentage of Immigrants from Eastern Europe in Lenexa, KS?
66215 has the Highest Percentage of Immigrants from Eastern Europe in Lenexa, KS with 0.40%.
What is the Percentage of Immigrants from Eastern Europe in Lenexa, KS?
Percentage of Immigrants from Eastern Europe in Lenexa is 0.27%.
What is the Percentage of Immigrants from Eastern Europe in Kansas?
Percentage of Immigrants from Eastern Europe in Kansas is 0.17%.
What is the Percentage of Immigrants from Eastern Europe in the United States?
Percentage of Immigrants from Eastern Europe in the United States is 0.67%.